File:Fig5 Deroulers DiagnosticPath2013 8.jpg
Original file (1,200 × 900 pixels, file size: 92 KB, MIME type: image/jpeg)
Summary
| Description |
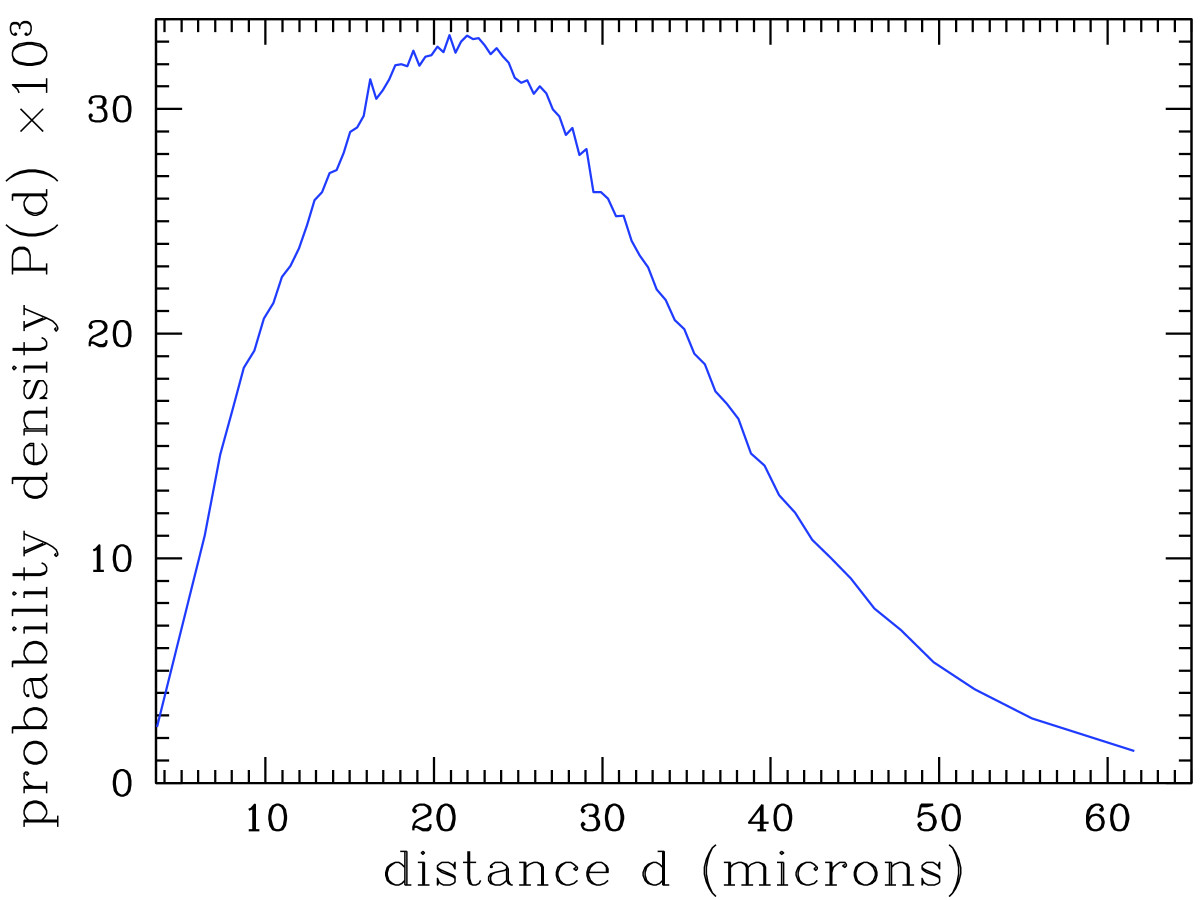
Figure 5. The positions of the 154240 identified nuclei were obtained from the analysis with ImageJ of the digital slide on a laptop computer. Since the slide was too large to fit into the computer’s memory, it was turned into a mosaic of 16 pieces with overlap of 60 pixels, and each piece underwent automated analysis independently. Then the results were aggregated. The graph shows the probability density function of the distance of a cell nucleus to its nearest neighbor in the whole sample. |
|---|---|
| Source |
Deroulers, Christophe; Ameisen, David; Badoual, Mathilde; Gerin, Chloé; Granier, Alexandre; Lartaud, Marc (2013). "Analyzing huge pathology images with open source software". Diagnostic Pathology 8: 92. doi:10.1186/1746-1596-8-92. ISSN 1746-1596. http://www.diagnosticpathology.org/content/8/1/92. |
| Date |
2013 |
| Author |
Deroulers, Christophe; Ameisen, David; Badoual, Mathilde; Gerin, Chloé; Granier, Alexandre; Lartaud, Marc |
| Permission (Reusing this file) |
|
| Other versions |
Licensing
|
|
This work is licensed under the Creative Commons Attribution 2.0 License. |
File history
Click on a date/time to view the file as it appeared at that time.
| Date/Time | Thumbnail | Dimensions | User | Comment | |
|---|---|---|---|---|---|
| current | 17:00, 29 September 2015 | | 1,200 × 900 (92 KB) | Shawndouglas (talk | contribs) |
You cannot overwrite this file.
File usage
The following 2 pages use this file:


