Difference between revisions of "File:Fig1 Cassim AfricanJLabMed2020 9-2.jpg"
From LIMSWiki
Jump to navigationJump to searchShawndouglas (talk | contribs) |
Shawndouglas (talk | contribs) (Added summary.) |
||
| Line 1: | Line 1: | ||
==Summary== | |||
{{Information | |||
|Description='''Figure 1.''' Flowchart depicting all steps required to develop a turn-around time dashboard, South Africa, 2018 | |||
|Source={{cite journal |title=Timely delivery of laboratory efficiency information, Part I: Developing an interactive turnaround time dashboard at a high-volume laboratory |journal=African Journal of Laboratory Medicine |author=Cassim, N.; Tepper, M.E.; Coetzee, L.M.; Glencross, D.K. |volume=9 |issue=2 |at=a947 |year=2020 |doi=10.4102/ajlm.v9i2.947}} | |||
|Author=Cassim, N.; Tepper, M.E.; Coetzee, L.M.; Glencross, D.K. | |||
|Date=2020 | |||
|Permission=[http://creativecommons.org/licenses/by/4.0/ Creative Commons Attribution 4.0 International] | |||
}} | |||
== Licensing == | == Licensing == | ||
{{cc-by-4.0}} | {{cc-by-4.0}} | ||
Latest revision as of 21:31, 18 January 2021
Summary
| Description |
Figure 1. Flowchart depicting all steps required to develop a turn-around time dashboard, South Africa, 2018 |
|---|---|
| Source |
Cassim, N.; Tepper, M.E.; Coetzee, L.M.; Glencross, D.K. (2020). "Timely delivery of laboratory efficiency information, Part I: Developing an interactive turnaround time dashboard at a high-volume laboratory". African Journal of Laboratory Medicine 9 (2): a947. doi:10.4102/ajlm.v9i2.947. |
| Date |
2020 |
| Author |
Cassim, N.; Tepper, M.E.; Coetzee, L.M.; Glencross, D.K. |
| Permission (Reusing this file) |
|
| Other versions |
Licensing
|
|
This work is licensed under the Creative Commons Attribution 4.0 License. |
File history
Click on a date/time to view the file as it appeared at that time.
| Date/Time | Thumbnail | Dimensions | User | Comment | |
|---|---|---|---|---|---|
| current | 21:31, 18 January 2021 | 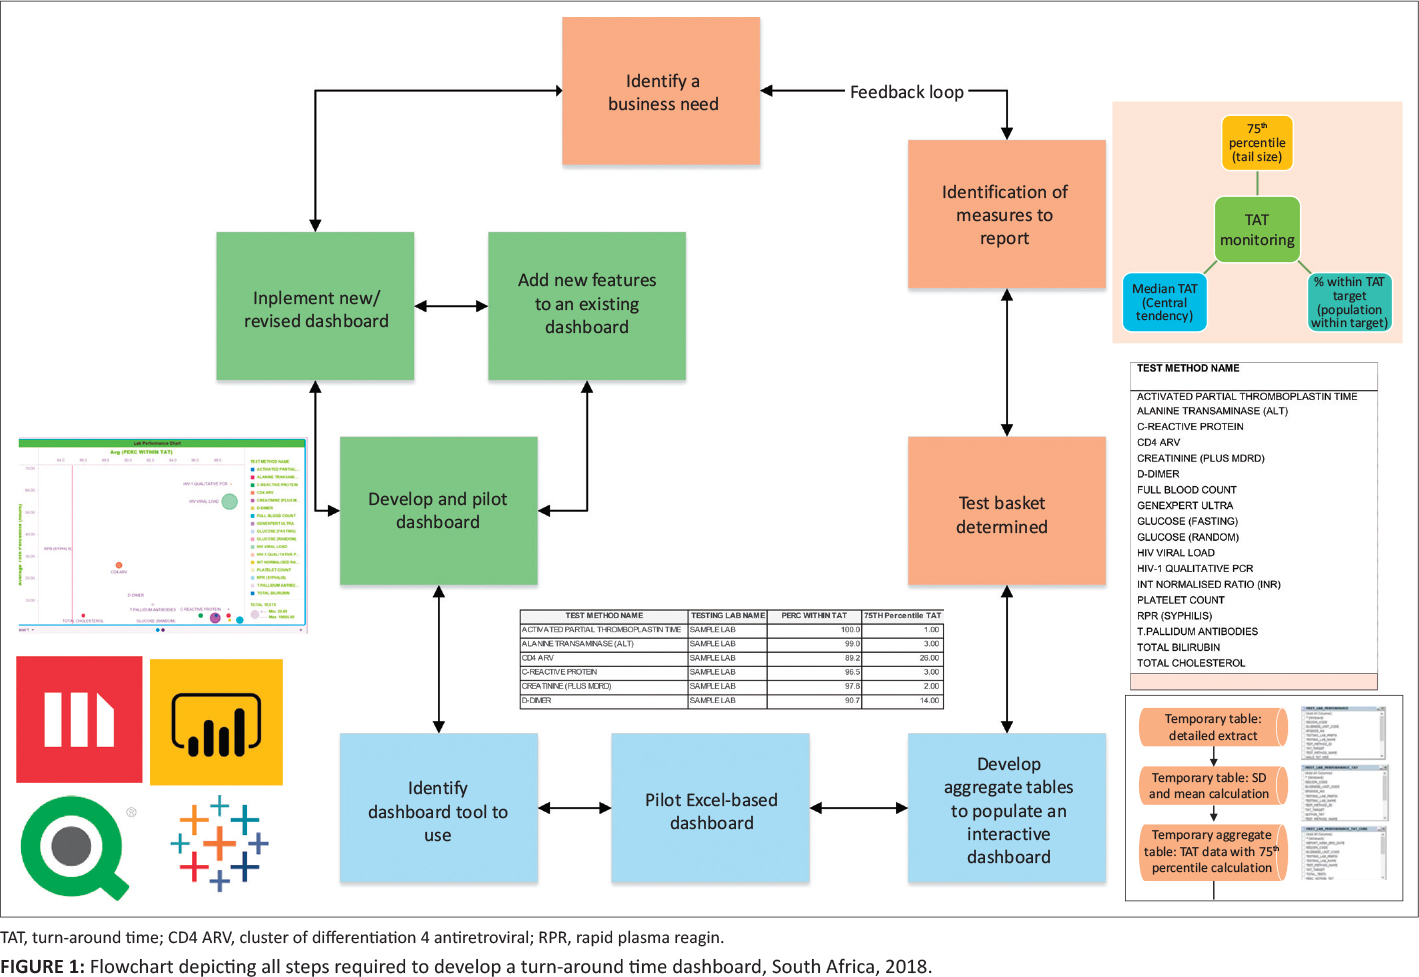 | 1,419 × 977 (771 KB) | Shawndouglas (talk | contribs) |
You cannot overwrite this file.
File usage
The following 2 pages use this file:


