File:Fig1 Zehl FrontInNeuro2016 10.jpg
Original file (1,009 × 640 pixels, file size: 463 KB, MIME type: image/jpeg)
Summary
| Description |
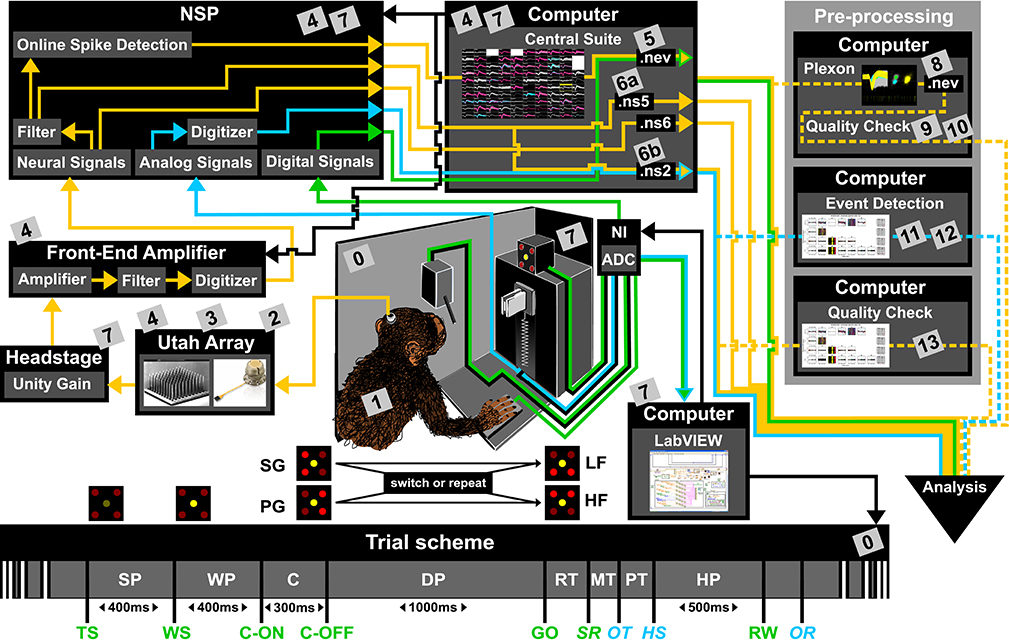
Figure 1. Overview of the reach-to-grasp setup. Bottom: Time line of the experiment indicating the sequence of presented stimuli (WS, C-ON, C-OFF, GO, RW), the behavioral epochs (SP, WP, C, DP, RT, MT, PT, MP) and registered behavioral events (TS, SR, OT, HS). Fixed durations of behavioral epochs are specified in the time line. The abbreviations used in the trial scheme are explained in Table 1. The sketch of the experimental setup above illustrates the involved hard and software components (boxes) as well as the signal flow. The signal flow is composed of two streams of signals: Recording and processing of the neuronal signals (yellow arrows) and the signals related behavior (green and blue arrows). The controller of each component is indicated by black arrows. The gray boxes indicate files that contain metadata generated or updated at this stage (cf. numbers in boxes to labels in Table 2 for details). The signal flow of the neuronal data starts at the level of the Utah array, continues with the headstage, the Front-End Amplifier, the Neural Signal Processor (NSP), and ends with saving the data as three Blackrock specific data file formats (.nev, .ns2 and .ns5/.ns6) using Central Suite running on the data acquisition PC. The stream of behavioral signals is split into two parallel pathways. One of them contains the analog signals (force and displacement sensors), colored in blue, and the other one the digital signals (LEDs, table switch, and reward control), colored in green. The correct sequence of trial events (presentation of stimuli), the setting of the load force of the object and the performed behavior (timing, movement) are monitored (blue and green arrows) and controlled (black arrows) online via LabVIEW on a second setup control PC. The digitization of the signals is performed via an Analog-Digital converter (ADC) of National Instruments (NI) which is upstream to the setup control PC. The ADC is also upstream to NSP which is used to save all digital or digitized signals into the nev data file via Central Suite. In parallel the analog signals of the load and displacement sensors of the object are fed directly into the NSP and saved into the .ns2 file. Consecutive preprocessing of the neuronal as well as the behavioral signals (flow of preprocessed signals marked by dashed lines) is performed offline on separate PCs, such as the spike sorting with the Plexon offline Spike Sorter or other preprocessing steps with custom programs (e.g., “Quality Check” or “Event Detection”). Image of Utah array courtesy of Blackrock Microsystems. |
|---|---|
| Source |
Zehl, L.; Jaillet, F.; Stoewer, A.; Grewe, J.; Sobolev, A.; Wachtler, T.; Brochier, T.G.; Riehle, A.; Denker, M.; Grün, S. (2016). "Handling metadata in a neurophysiology laboratory". Frontiers in Neuroinformatics 10: 26. doi:10.3389/fninf.2016.00026. |
| Date |
2016 |
| Author |
Zehl, L.; Jaillet, F.; Stoewer, A.; Grewe, J.; Sobolev, A.; Wachtler, T.; Brochier, T.G.; Riehle, A.; Denker, M.; Grün, S. |
| Permission (Reusing this file) |
|
| Other versions |
Licensing
|
|
This work is licensed under the Creative Commons Attribution 4.0 License. |
File history
Click on a date/time to view the file as it appeared at that time.
| Date/Time | Thumbnail | Dimensions | User | Comment | |
|---|---|---|---|---|---|
| current | 23:13, 20 December 2017 | | 1,009 × 640 (463 KB) | Shawndouglas (talk | contribs) |
You cannot overwrite this file.
File usage
The following page uses this file:


