File:Fig3 Mudge AnalBioChem2017 409-12.gif
Original file (499 × 1,106 pixels, file size: 59 KB, MIME type: image/gif)
Summary
| Description |
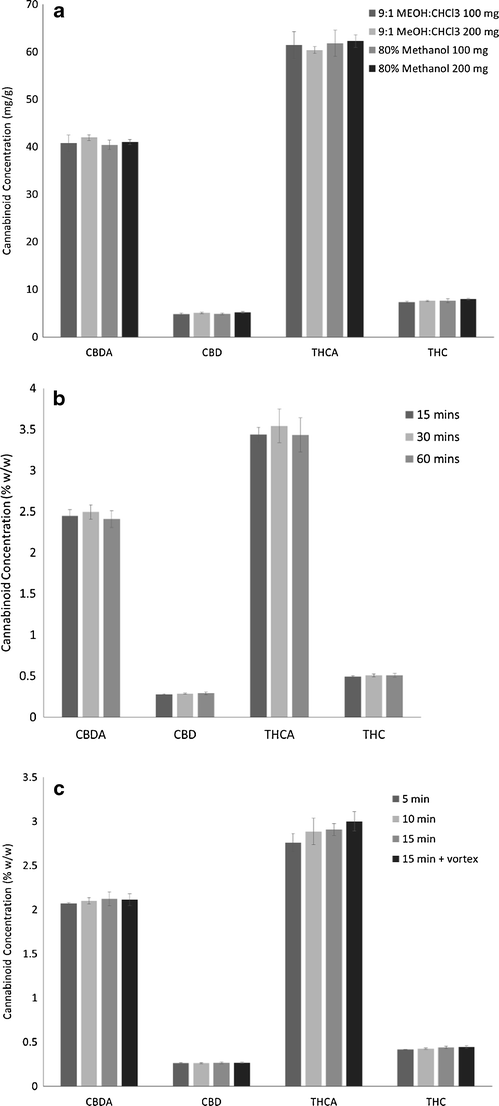
Figure 3. Optimization of a green chemistry extraction protocol. The figure shows concentration of the four major cannabinoids comparing (a) solvent composition and volume to mass ratio; (b) extraction times of 15, 30, and 60 minutes, and (c) short extraction times of 5, 10, and 15 minutes, as well as 15 minutes with vortexing every 5 minutes (n = 3). |
|---|---|
| Source |
Mudge, E.M.; Murch, S.J.; Brown, P.N. (2017). "Leaner and greener analysis of cannabinoids". Analytical and Bioanalytical Chemistry 409 (12): 3153–63. doi:10.1007/s00216-017-0256-3. |
| Date |
2017 |
| Author |
Mudge, E.M.; Murch, S.J.; Brown, P.N. |
| Permission (Reusing this file) |
|
| Other versions |
Licensing
|
|
This work is licensed under the Creative Commons Attribution 4.0 License. |
File history
Click on a date/time to view the file as it appeared at that time.
| Date/Time | Thumbnail | Dimensions | User | Comment | |
|---|---|---|---|---|---|
| current | 23:16, 2 July 2019 | | 499 × 1,106 (59 KB) | Shawndouglas (talk | contribs) |
You cannot overwrite this file.
File usage
The following page uses this file:


