Difference between revisions of "File:Fig6 Crisan PeerJ2018 6.jpg"
Shawndouglas (talk | contribs) |
Shawndouglas (talk | contribs) (Added summary.) |
||
| Line 1: | Line 1: | ||
==Summary== | |||
{{Information | |||
|Description='''Figure 6.''' Design Choice Questionnaire results. Responses are grouped according to question type: wording (A), design choices (B), and full reports (C), and partitioned into clinician participants (squares) and non-clinician participants (circles). Responses are colored according to whether they are the control design from the original report (white) or an alternative design devised in the design sprint (black). Lines connect options between clinician and non-clinicians preferences, with thicker crossing lines showing discordance between the two groups and vertical lines showing concordance in preferences. Rescaled rank scores are shown against a reference of random permutations (see Methods), with scores closer to 1 indicating the most preferred response. Specific questions are indicated with Q; the questions as presented to the participants are shown in Table S6. | |||
|Source={{cite journal |title=Evidence-based design and evaluation of a whole genome sequencing clinical report for the reference microbiology laboratory |journal=PeerJ |author=Crisan, A.; McKee, G.; Munzner, T.; Gardy, J.L. |volume=6 |pages=e4218 |year=2018 |doi=10.7717/peerj.4218}} | |||
|Author=Crisan, A.; McKee, G.; Munzner, T.; Gardy, J.L. | |||
|Date=2018 | |||
|Permission=[http://creativecommons.org/licenses/by/4.0/ Creative Commons Attribution 4.0 International] | |||
}} | |||
== Licensing == | == Licensing == | ||
{{cc-by-4.0}} | {{cc-by-4.0}} | ||
Latest revision as of 20:15, 15 February 2018
Summary
| Description |
Figure 6. Design Choice Questionnaire results. Responses are grouped according to question type: wording (A), design choices (B), and full reports (C), and partitioned into clinician participants (squares) and non-clinician participants (circles). Responses are colored according to whether they are the control design from the original report (white) or an alternative design devised in the design sprint (black). Lines connect options between clinician and non-clinicians preferences, with thicker crossing lines showing discordance between the two groups and vertical lines showing concordance in preferences. Rescaled rank scores are shown against a reference of random permutations (see Methods), with scores closer to 1 indicating the most preferred response. Specific questions are indicated with Q; the questions as presented to the participants are shown in Table S6. |
|---|---|
| Source |
Crisan, A.; McKee, G.; Munzner, T.; Gardy, J.L. (2018). "Evidence-based design and evaluation of a whole genome sequencing clinical report for the reference microbiology laboratory". PeerJ 6: e4218. doi:10.7717/peerj.4218. |
| Date |
2018 |
| Author |
Crisan, A.; McKee, G.; Munzner, T.; Gardy, J.L. |
| Permission (Reusing this file) |
|
| Other versions |
Licensing
|
|
This work is licensed under the Creative Commons Attribution 4.0 License. |
File history
Click on a date/time to view the file as it appeared at that time.
| Date/Time | Thumbnail | Dimensions | User | Comment | |
|---|---|---|---|---|---|
| current | 20:15, 15 February 2018 | 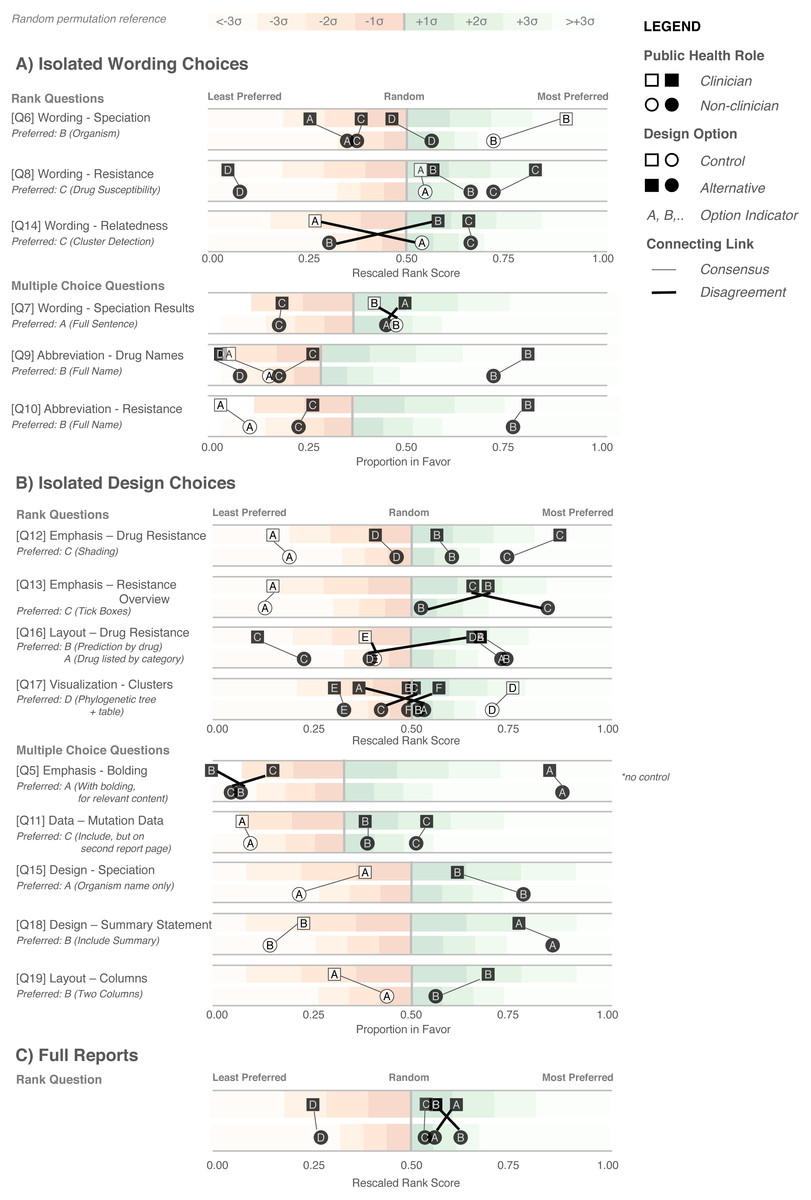 | 811 × 1,200 (169 KB) | Shawndouglas (talk | contribs) |
You cannot overwrite this file.
File usage
The following page uses this file:


