Difference between revisions of "Template:Article of the week"
Shawndouglas (talk | contribs) (Updated article of the week text.) |
Shawndouglas (talk | contribs) (Updated article of the week text.) |
||
| Line 1: | Line 1: | ||
<div style="float: left; margin: 0.5em 0.9em 0.4em 0em;">[[File:Fig2 Bekker JofCheminformatics2016 8-1.gif|240px]]</div> | <div style="float: left; margin: 0.5em 0.9em 0.4em 0em;">[[File:Fig2 Bekker JofCheminformatics2016 8-1.gif|240px]]</div> | ||
'''"[[Journal: | '''"[[Journal:VennDiagramWeb: A web application for the generation of highly customizable Venn and Euler diagrams|VennDiagramWeb: A web application for the generation of highly customizable Venn and Euler diagrams]]"''' | ||
Visualization of data generated by high-throughput, high-dimensionality experiments is rapidly becoming a rate-limiting step in [[Computational informatics|computational biology]]. There is an ongoing need to quickly develop high-quality visualizations that can be easily customized or incorporated into automated pipelines. This often requires an interface for manual plot modification, rapid cycles of tweaking visualization parameters, and the generation of graphics code. To facilitate this process for the generation of highly-customizable, high-resolution Venn and Euler diagrams, we introduce ''VennDiagramWeb'': a web application for the widely used VennDiagram R package. ''VennDiagramWeb'' allows real-time modification of Venn and Euler diagrams, with parameter setting through a web interface and immediate visualization of results. It allows customization of essentially all aspects of figures, but also supports integration into computational pipelines via download of [[R (programming language)|R code]]. Users can upload data and download figures in a range of formats, and there is exhaustive support documentation. ('''[[Journal:VennDiagramWeb: A web application for the generation of highly customizable Venn and Euler diagrams|Full article...]]''')<br /> | |||
<br /> | <br /> | ||
''Recently featured'': | ''Recently featured'': | ||
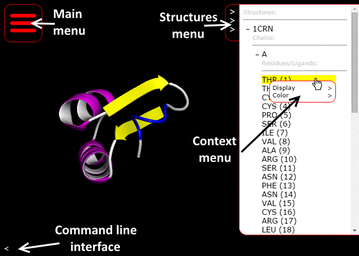
: ▪ [[Journal:Molmil: A molecular viewer for the PDB and beyond|Molmil: A molecular viewer for the PDB and beyond]] | |||
: ▪ [[Journal:Smart electronic laboratory notebooks for the NIST research environment|Smart electronic laboratory notebooks for the NIST research environment]] | : ▪ [[Journal:Smart electronic laboratory notebooks for the NIST research environment|Smart electronic laboratory notebooks for the NIST research environment]] | ||
: ▪ [[Journal:Making the leap from research laboratory to clinic: Challenges and opportunities for next-generation sequencing in infectious disease diagnostics|Making the leap from research laboratory to clinic: Challenges and opportunities for next-generation sequencing in infectious disease diagnostics]] | : ▪ [[Journal:Making the leap from research laboratory to clinic: Challenges and opportunities for next-generation sequencing in infectious disease diagnostics|Making the leap from research laboratory to clinic: Challenges and opportunities for next-generation sequencing in infectious disease diagnostics]] | ||
Revision as of 17:31, 12 December 2016
"VennDiagramWeb: A web application for the generation of highly customizable Venn and Euler diagrams"
Visualization of data generated by high-throughput, high-dimensionality experiments is rapidly becoming a rate-limiting step in computational biology. There is an ongoing need to quickly develop high-quality visualizations that can be easily customized or incorporated into automated pipelines. This often requires an interface for manual plot modification, rapid cycles of tweaking visualization parameters, and the generation of graphics code. To facilitate this process for the generation of highly-customizable, high-resolution Venn and Euler diagrams, we introduce VennDiagramWeb: a web application for the widely used VennDiagram R package. VennDiagramWeb allows real-time modification of Venn and Euler diagrams, with parameter setting through a web interface and immediate visualization of results. It allows customization of essentially all aspects of figures, but also supports integration into computational pipelines via download of R code. Users can upload data and download figures in a range of formats, and there is exhaustive support documentation. (Full article...)
Recently featured:


