File:Fig5 Kapoor JofAppCliMedPhys2023 24-10.jpg
Original file (1,381 × 905 pixels, file size: 319 KB, MIME type: image/jpeg)
Summary
| Description |
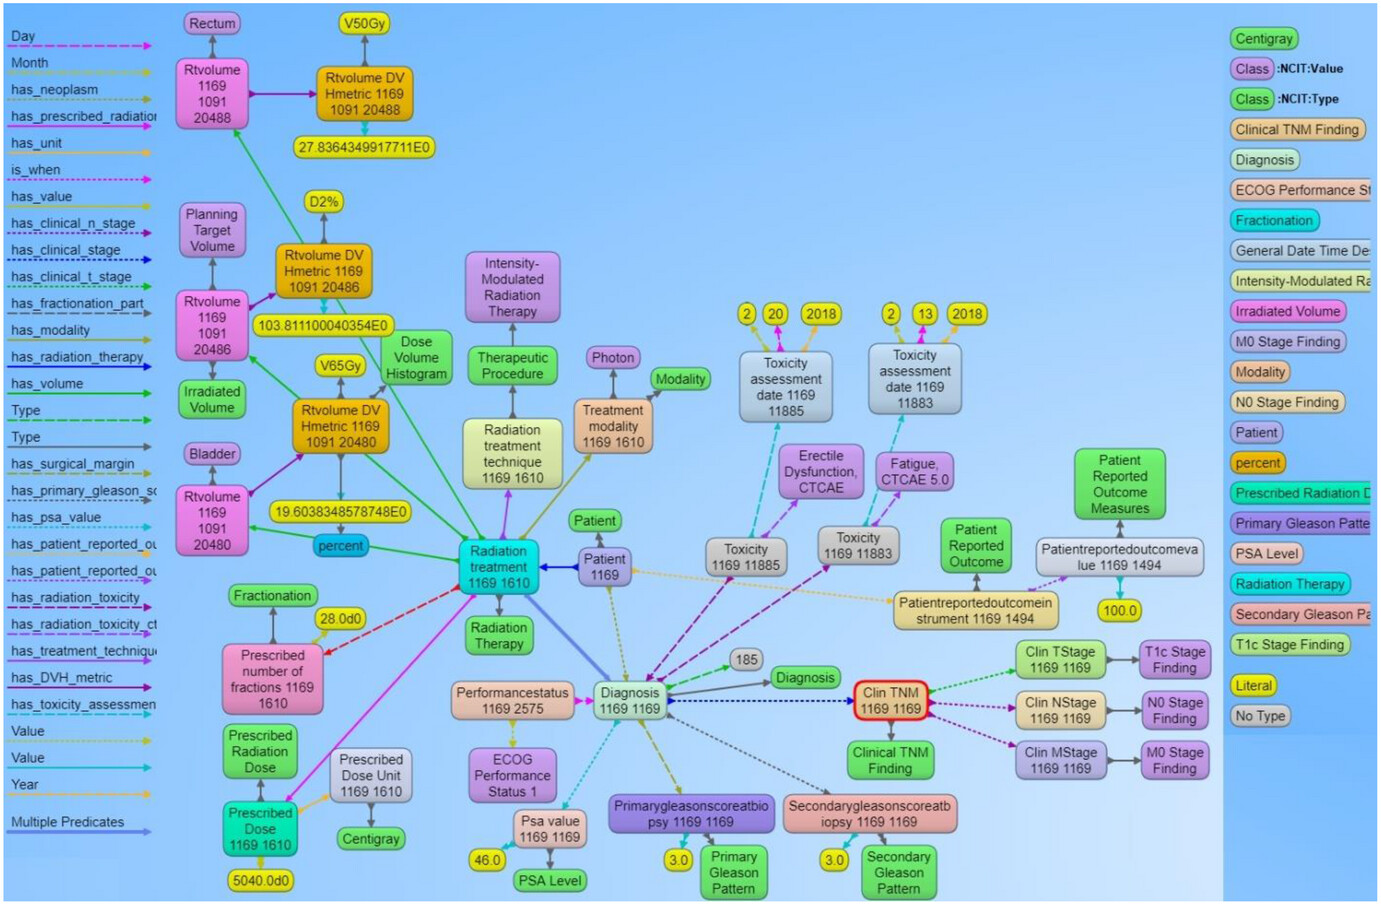
Figure 5. Example of the graph structure of a prostate cancer patient record based on the ontology. Each node in the graph are entities that represent objects or concepts and have a unique identifier and can have properties and relationships to other nodes in the graph. These nodes are connected by directed edges, representing relationships between the information, such as the relationship between the diagnosis node and the radiation treatment node. Similarly, there are edges from the diagnosis node to the toxicity node and further to the specific CTCAE toxicity class, indicating that the patient was evaluated for adverse effects after receiving radiation therapy. The different types of edge relationships from the ontology that are used in this example are listed on the left panel of the figure. The right panel shows different types of nodes that are used in the example. |
|---|---|
| Source |
Kapoor, Rishabh; Sleeman IV, William C.; Ghosh, Preetam; Palta, Jatinder (2023). "Infrastructure tools to support an effective radiation oncology learning health system". Journal of Applied Clinical Medical Physics 24 (10): e14127. doi:10.1002/acm2.14127. |
| Date |
2023 |
| Author |
Kapoor, Rishabh; Sleeman IV, William C.; Ghosh, Preetam; Palta, Jatinder |
| Permission (Reusing this file) |
|
| Other versions |
Licensing
|
|
This work is licensed under the Creative Commons Attribution 4.0 License. |
File history
Click on a date/time to view the file as it appeared at that time.
| Date/Time | Thumbnail | Dimensions | User | Comment | |
|---|---|---|---|---|---|
| current | 00:24, 10 May 2024 | | 1,381 × 905 (319 KB) | Shawndouglas (talk | contribs) |
You cannot overwrite this file.
File usage
The following page uses this file:


