Search results
From LIMSWiki
Jump to navigationJump to search
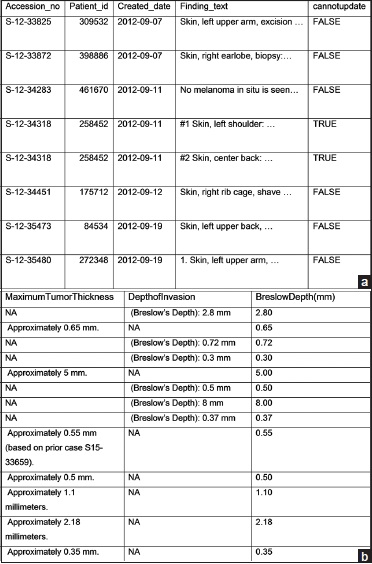
File:Fig4 Ye JofPathInformatics2016 7.jpg ...on of an R data frame containing two columns of extracted elements and one column of tidy data (BreslowDepth[mm]) derived from the first two columns.(372 × 564 (78 KB)) - 22:46, 16 November 2016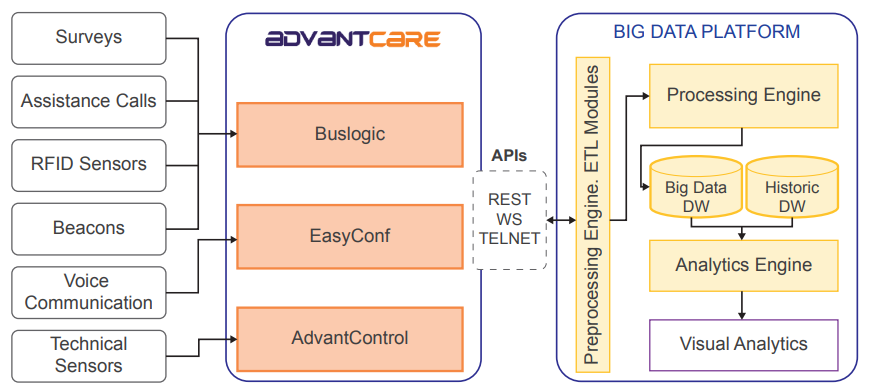
File:Fig1 BaldominosIntJOfIMAI2018 4-7.png ...retrieved and aggregated by AdvantCare software (second column). The last column shows the big data platform, which contains engines for the data processing(870 × 392 (70 KB)) - 23:50, 23 May 2018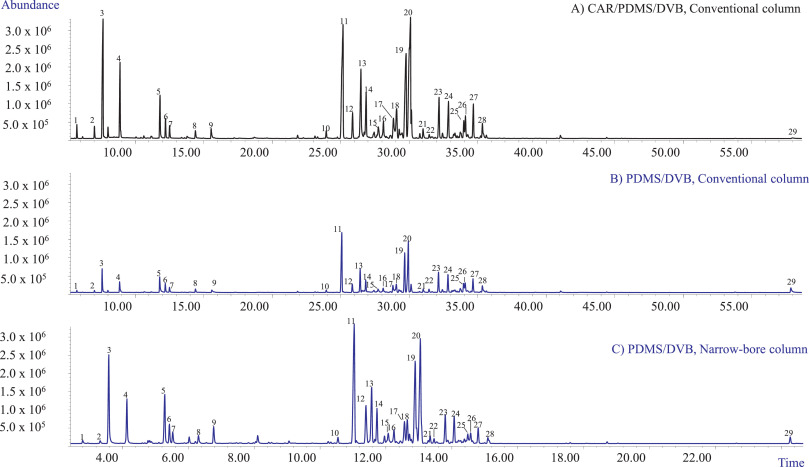
File:Fig1 Capetti AdvSampPrep2022 2.jpg ...ilent 6890 N GC coupled to a 5975 MSD. '''C)''' Polymer coating: PDMS/DVB; Column: narrow-bore MEGA-5; GC-MS instrument: Shimadzu QP2010-PLUS GC–MS system.(809 × 467 (68 KB)) - 22:59, 20 December 2023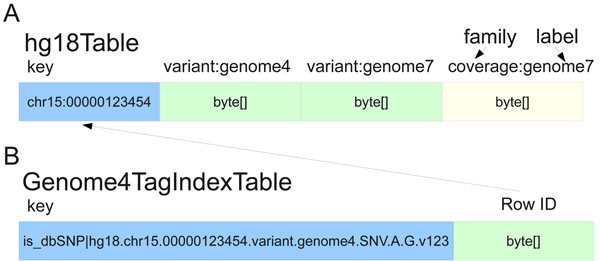
File:Fig1 OConnor BMCInformatics2010 11-12.jpg ...ar reference genome as the key. Each genome is represented by a particular column family label (such as “variant:genome7”). For locations with more than(600 × 261 (49 KB)) - 18:53, 28 December 2015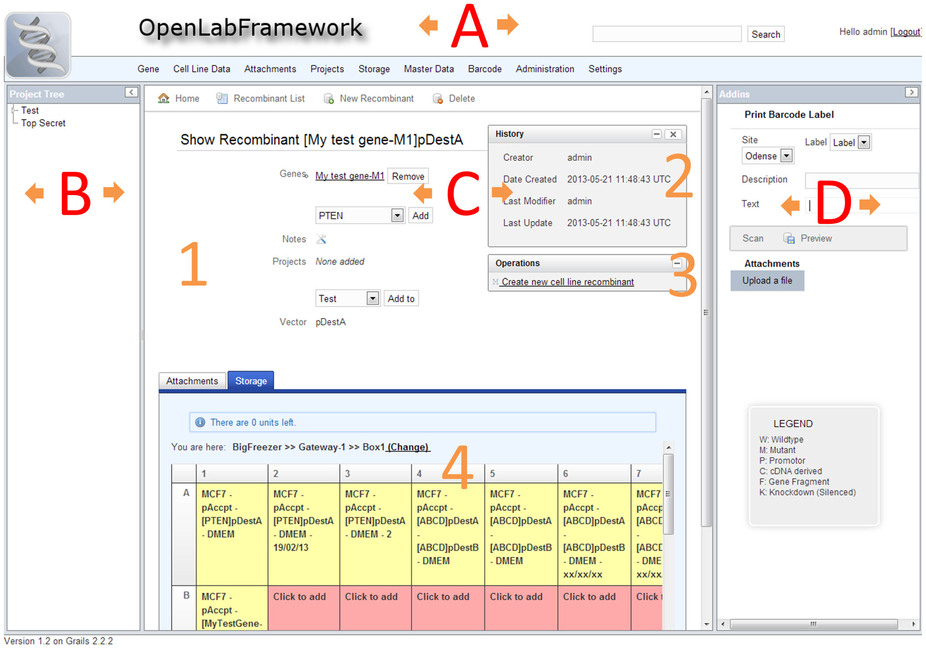
File:Fig1 List ScientificReports2014 4.jpg ...provided through add-ins that can be customized by each user in the right column.(926 × 649 (144 KB)) - 19:54, 21 January 2016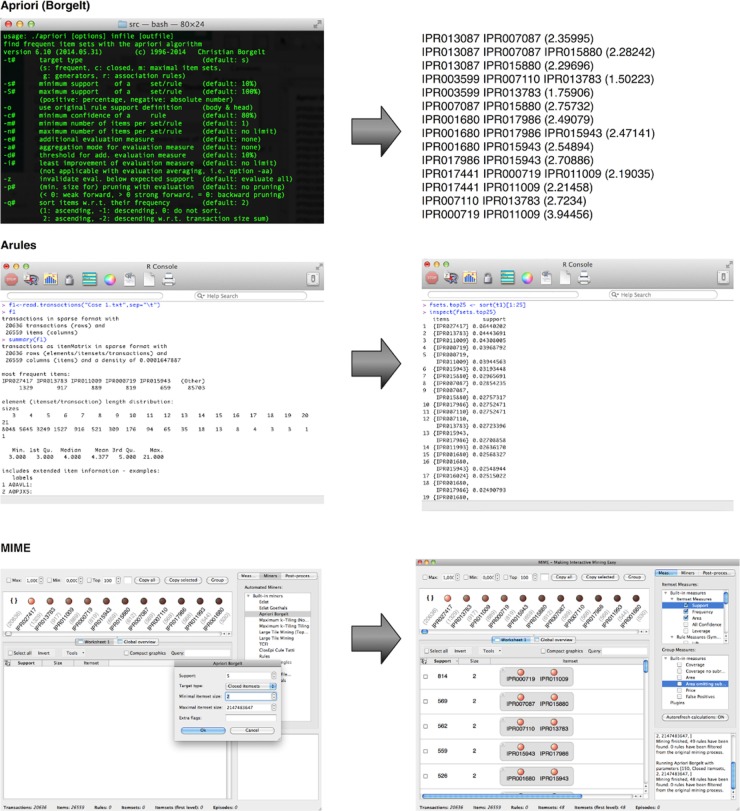
File:Fig2 Naulaerts BioAndBioInsights2016 10.jpg ...e items that make up a pattern in one column and the support in the second column. The bottom of the figure features the input and output of MIME. Note here(740 × 811 (190 KB)) - 15:04, 24 August 2016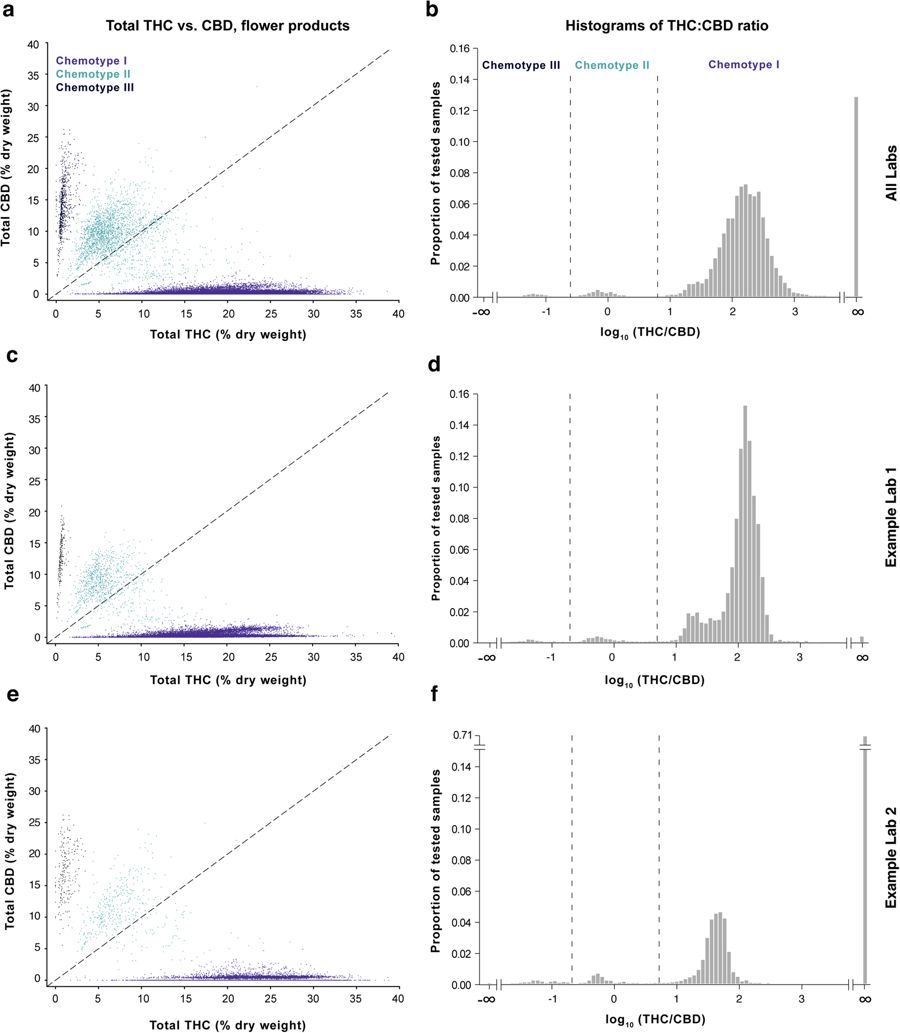
File:Fig1 Jikomes SciReports2018 8.jpg ...Scatterplots of total THC vs. total CBD levels for cannabis flower. Right column: Histograms showing the THC:CBD ratio on a log scale and indicating the pro(900 × 1,033 (80 KB)) - 22:46, 20 December 2023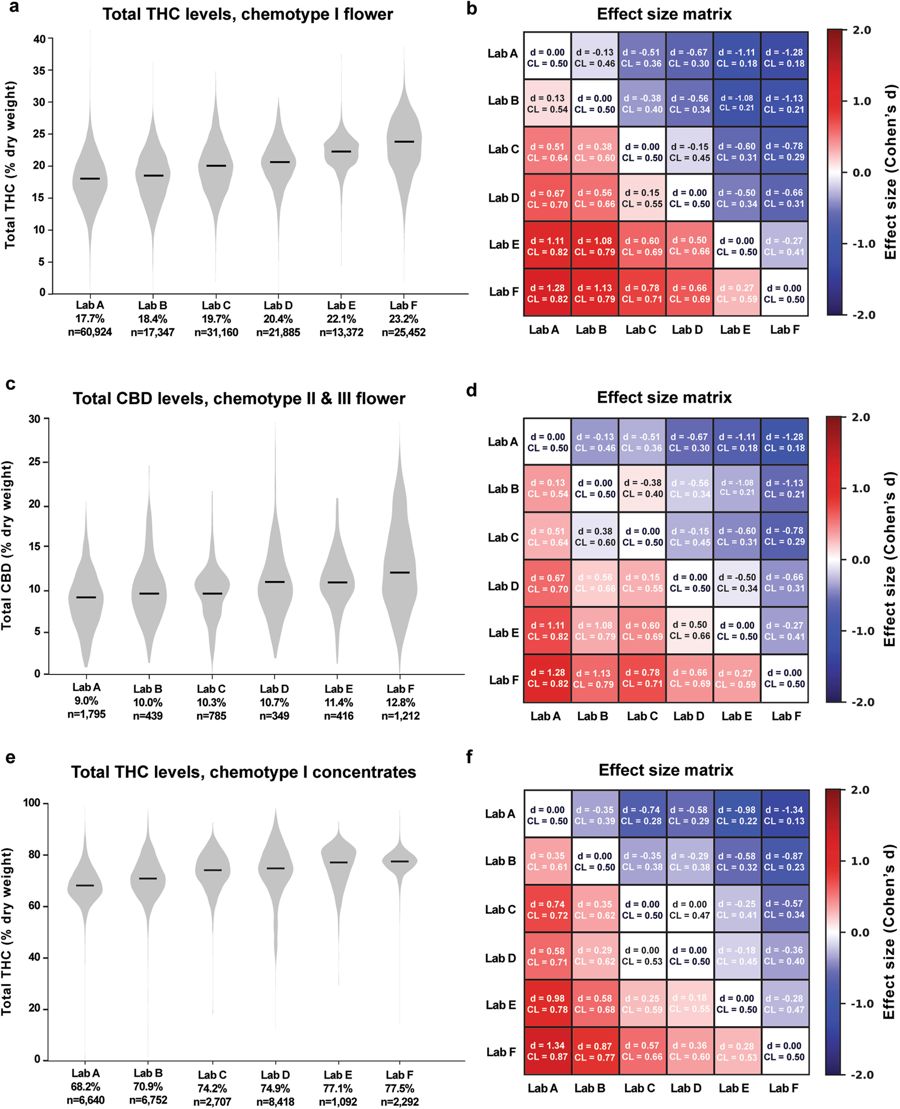
File:Fig2 Jikomes SciReports2018 8.jpg ...note median values, which are printed below the x-axis for each lab. Right column: Effect size matrices displaying the effect size of pairwise differences in(900 × 1,109 (146 KB)) - 22:47, 20 December 2023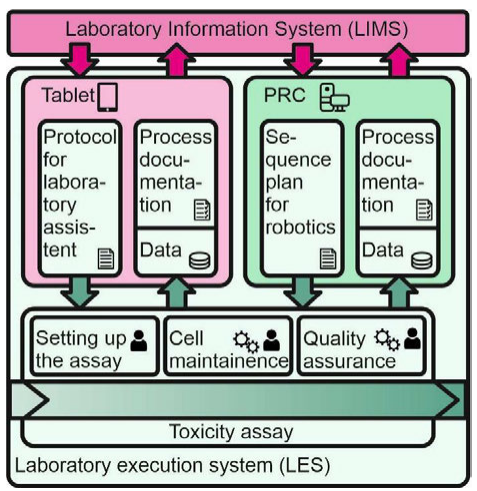
File:Fig2 Schmieder CurrentDirBioEng2019 5-1.png ...mated processes are controlled by the portal robotics control (PRC) (right column).(477 × 491 (234 KB)) - 00:04, 11 February 2020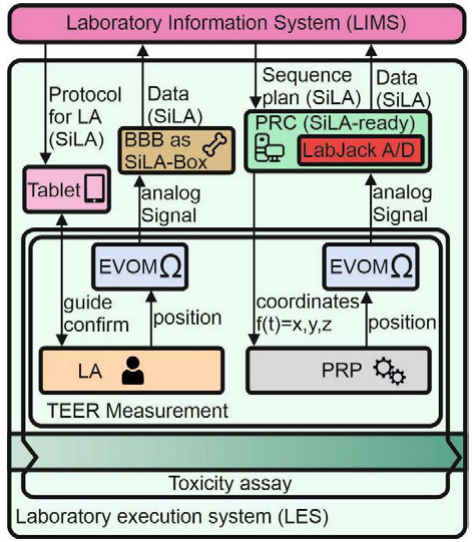
File:Fig3 Schmieder CurrentDirBioEng2019 5-1.png ...ne black (BBB) that acts as a SiLA-Box. Data of automated processes (right column) are converted to SiLA by portal robotics control (PRC).(473 × 542 (231 KB)) - 00:11, 11 February 2020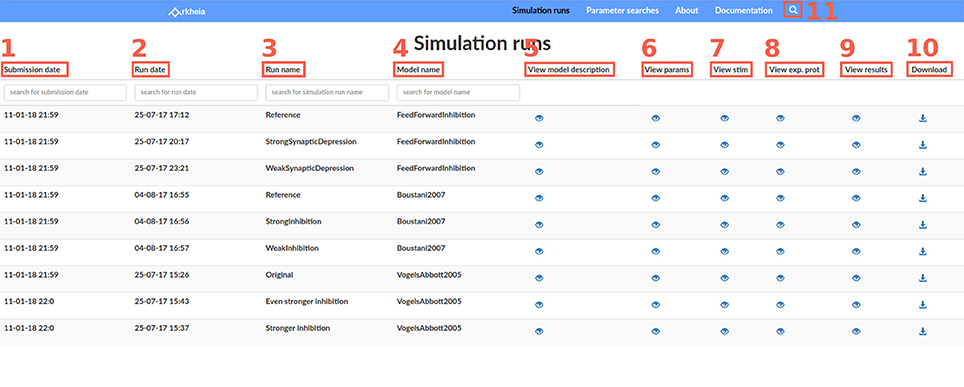
File:Fig3 Antolik FrontInNeuro2018 12.jpg ...onds to one simulation run which was added to the Arkheia repository. Each column corresponds to a different property of the simulation run. From left to rig(964 × 387 (203 KB)) - 18:22, 3 April 2018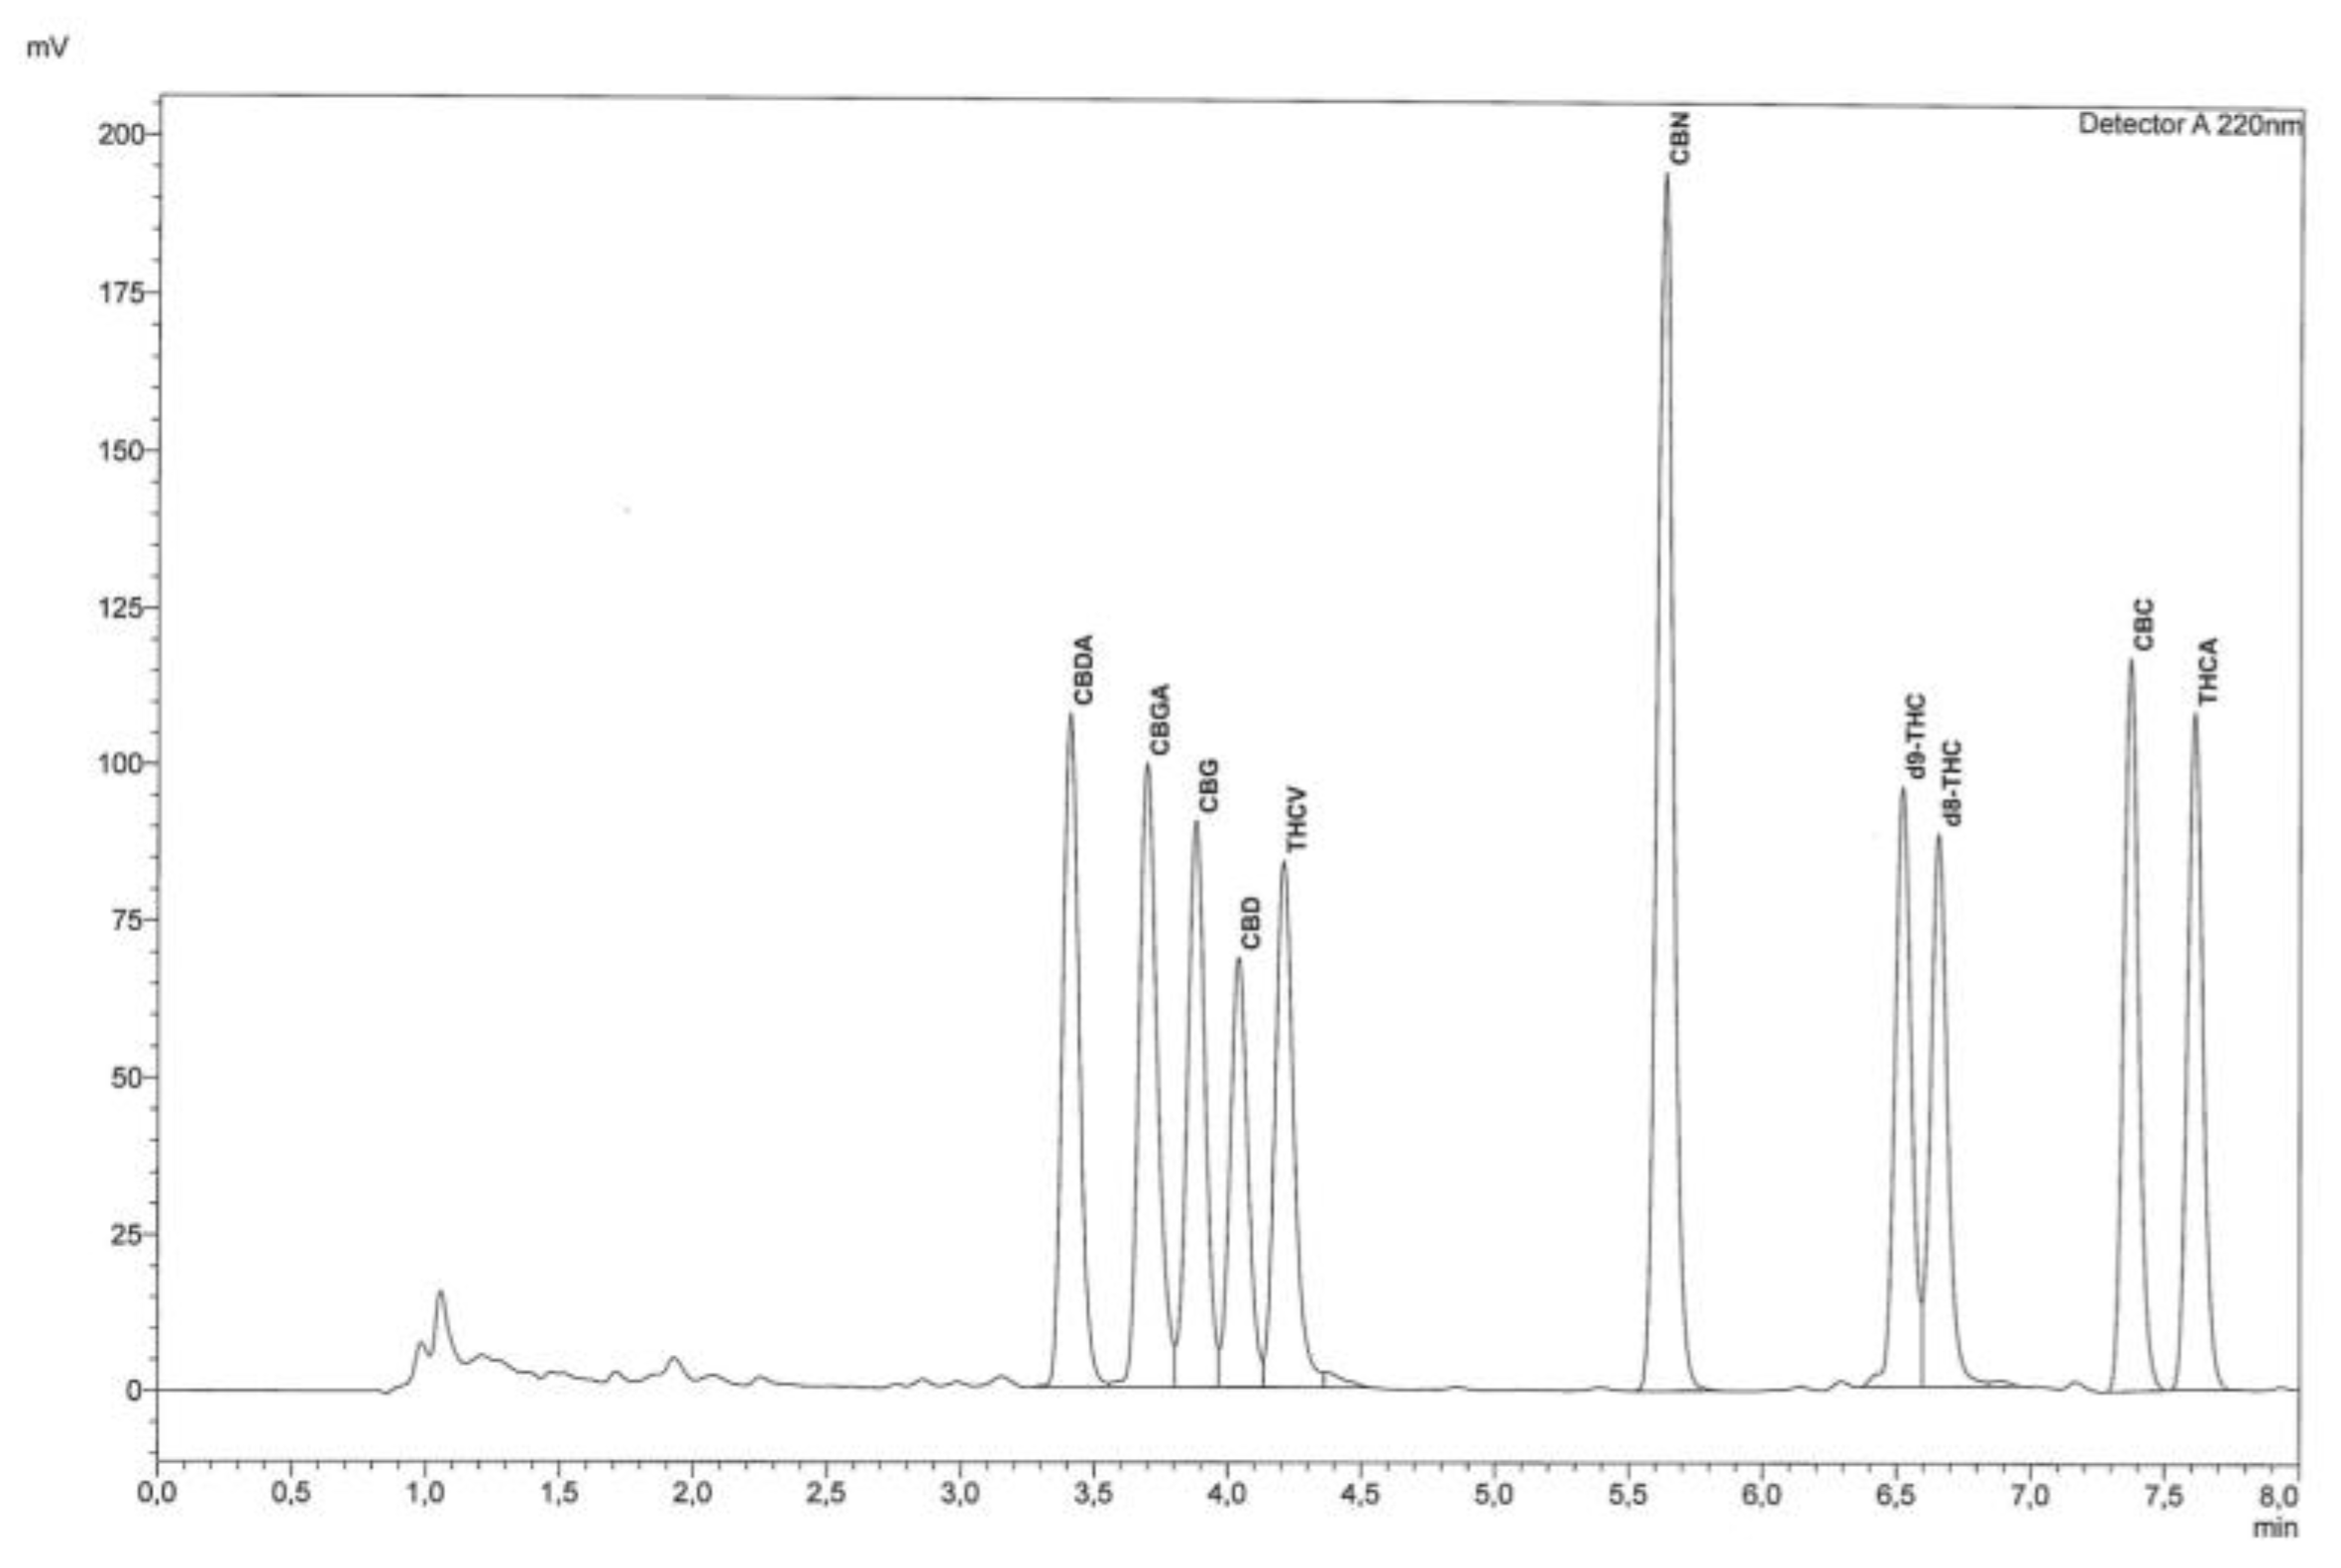
File:Fig1 Mandrioli Molecules2019 24-11.png ...cannabinoid mixture analyzed by RP-HPLC-UV equipped with reverse phase C18 column(2,362 × 1,582 (238 KB)) - 23:13, 2 December 2019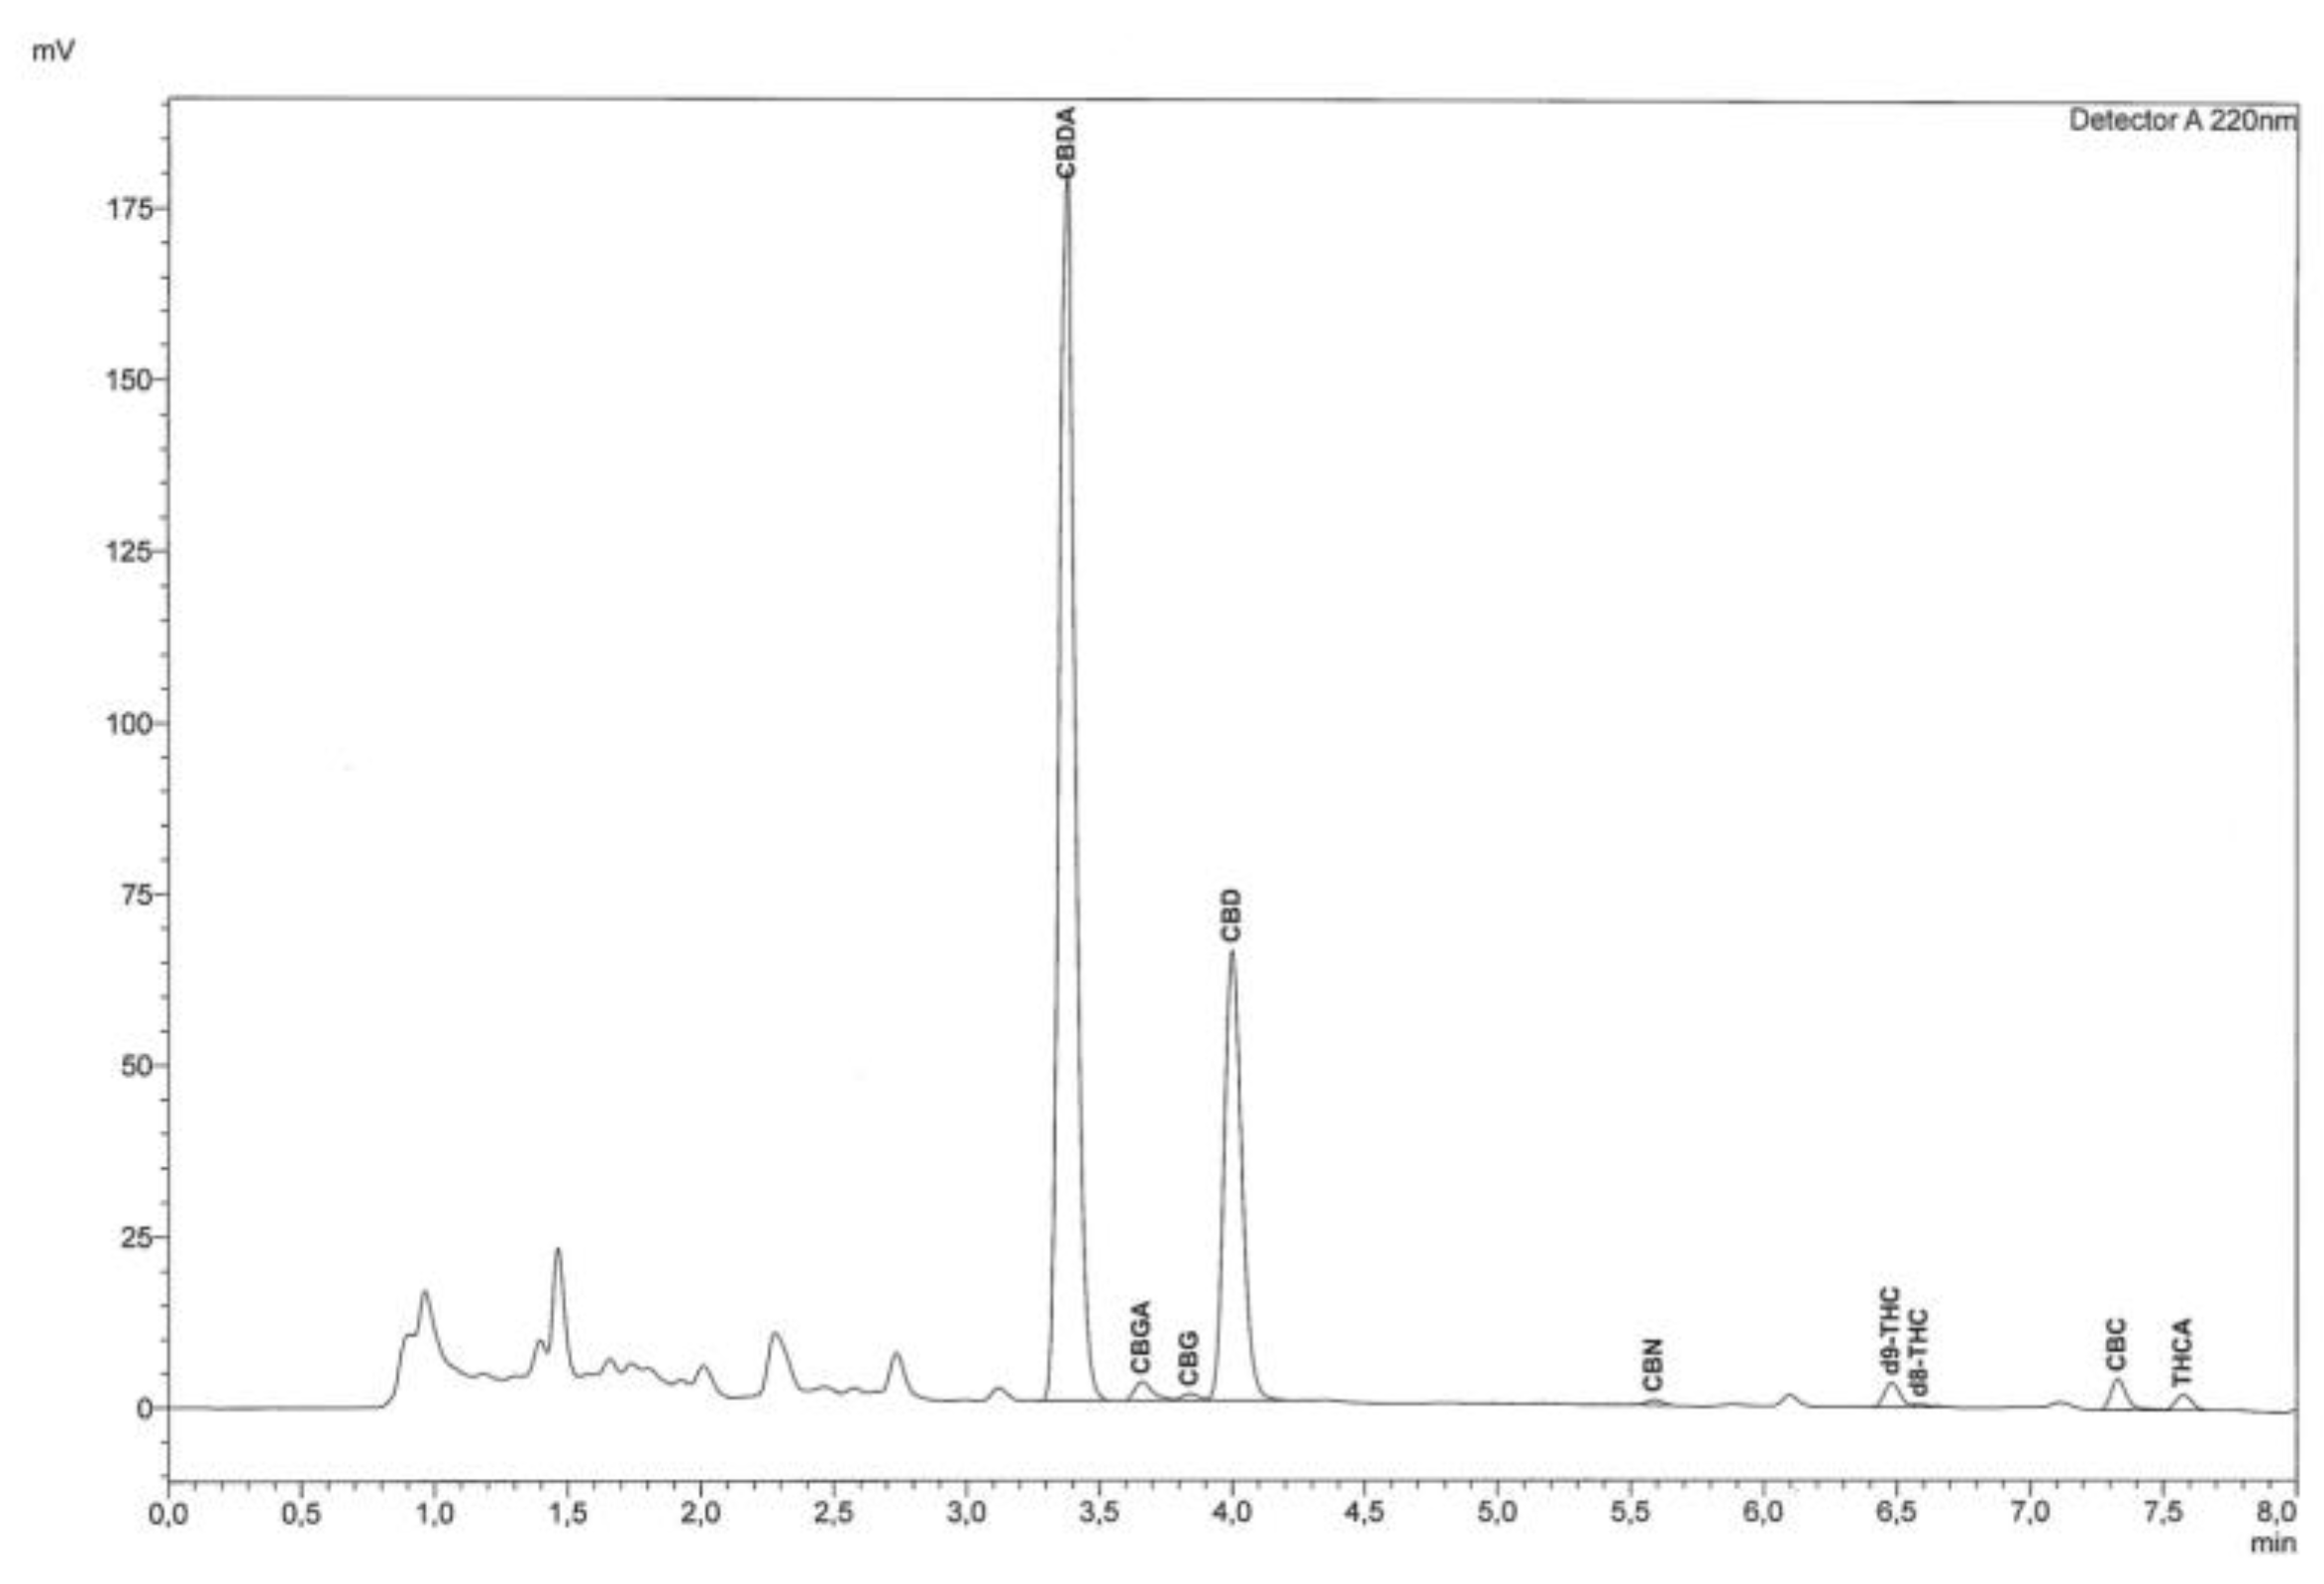
File:Fig2 Mandrioli Molecules2019 24-11.png ...orescence extract analyzed by RP-HPLC-UV equipped with a reverse phase C18 column(2,346 × 1,599 (184 KB)) - 23:15, 2 December 2019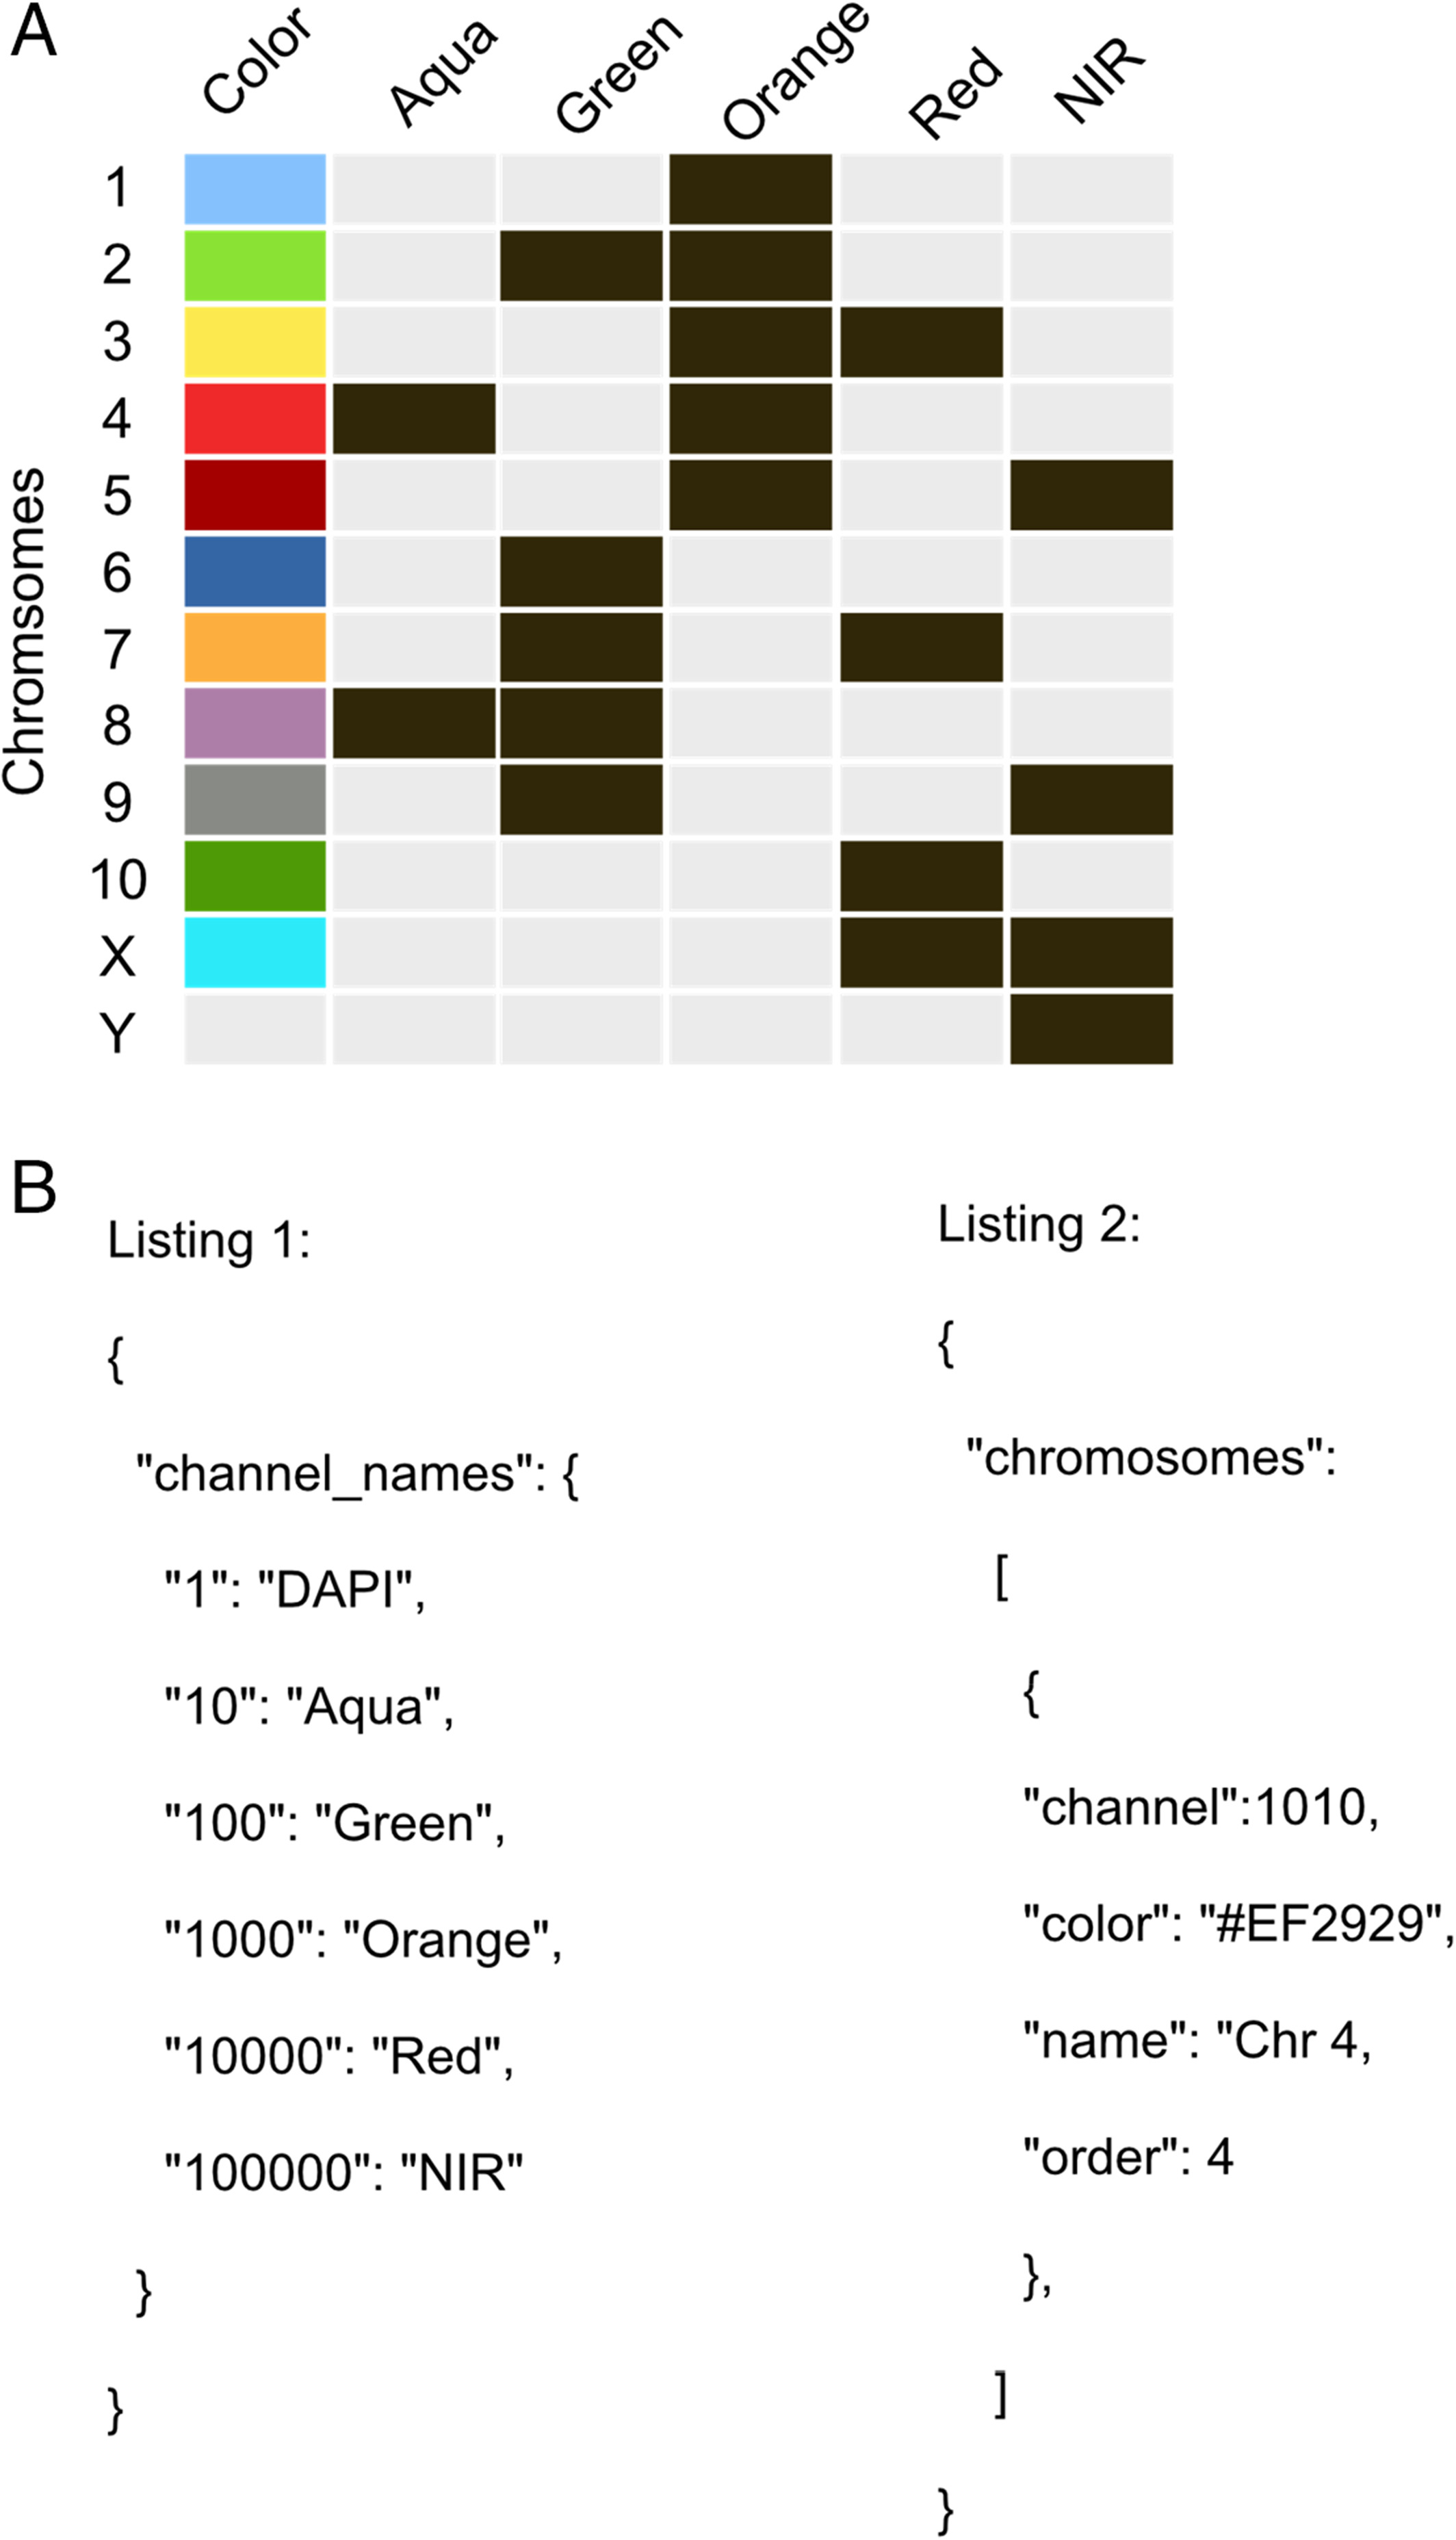
File:Fig2 Auer CytometryPartA2018 93-7.jpg ...1–10 autosomes and X‐Y sex chromosomes) for the Chinese hamster. The first column represents the assigned false color, while all other columns show the label(2,128 × 3,712 (337 KB)) - 18:42, 30 December 2019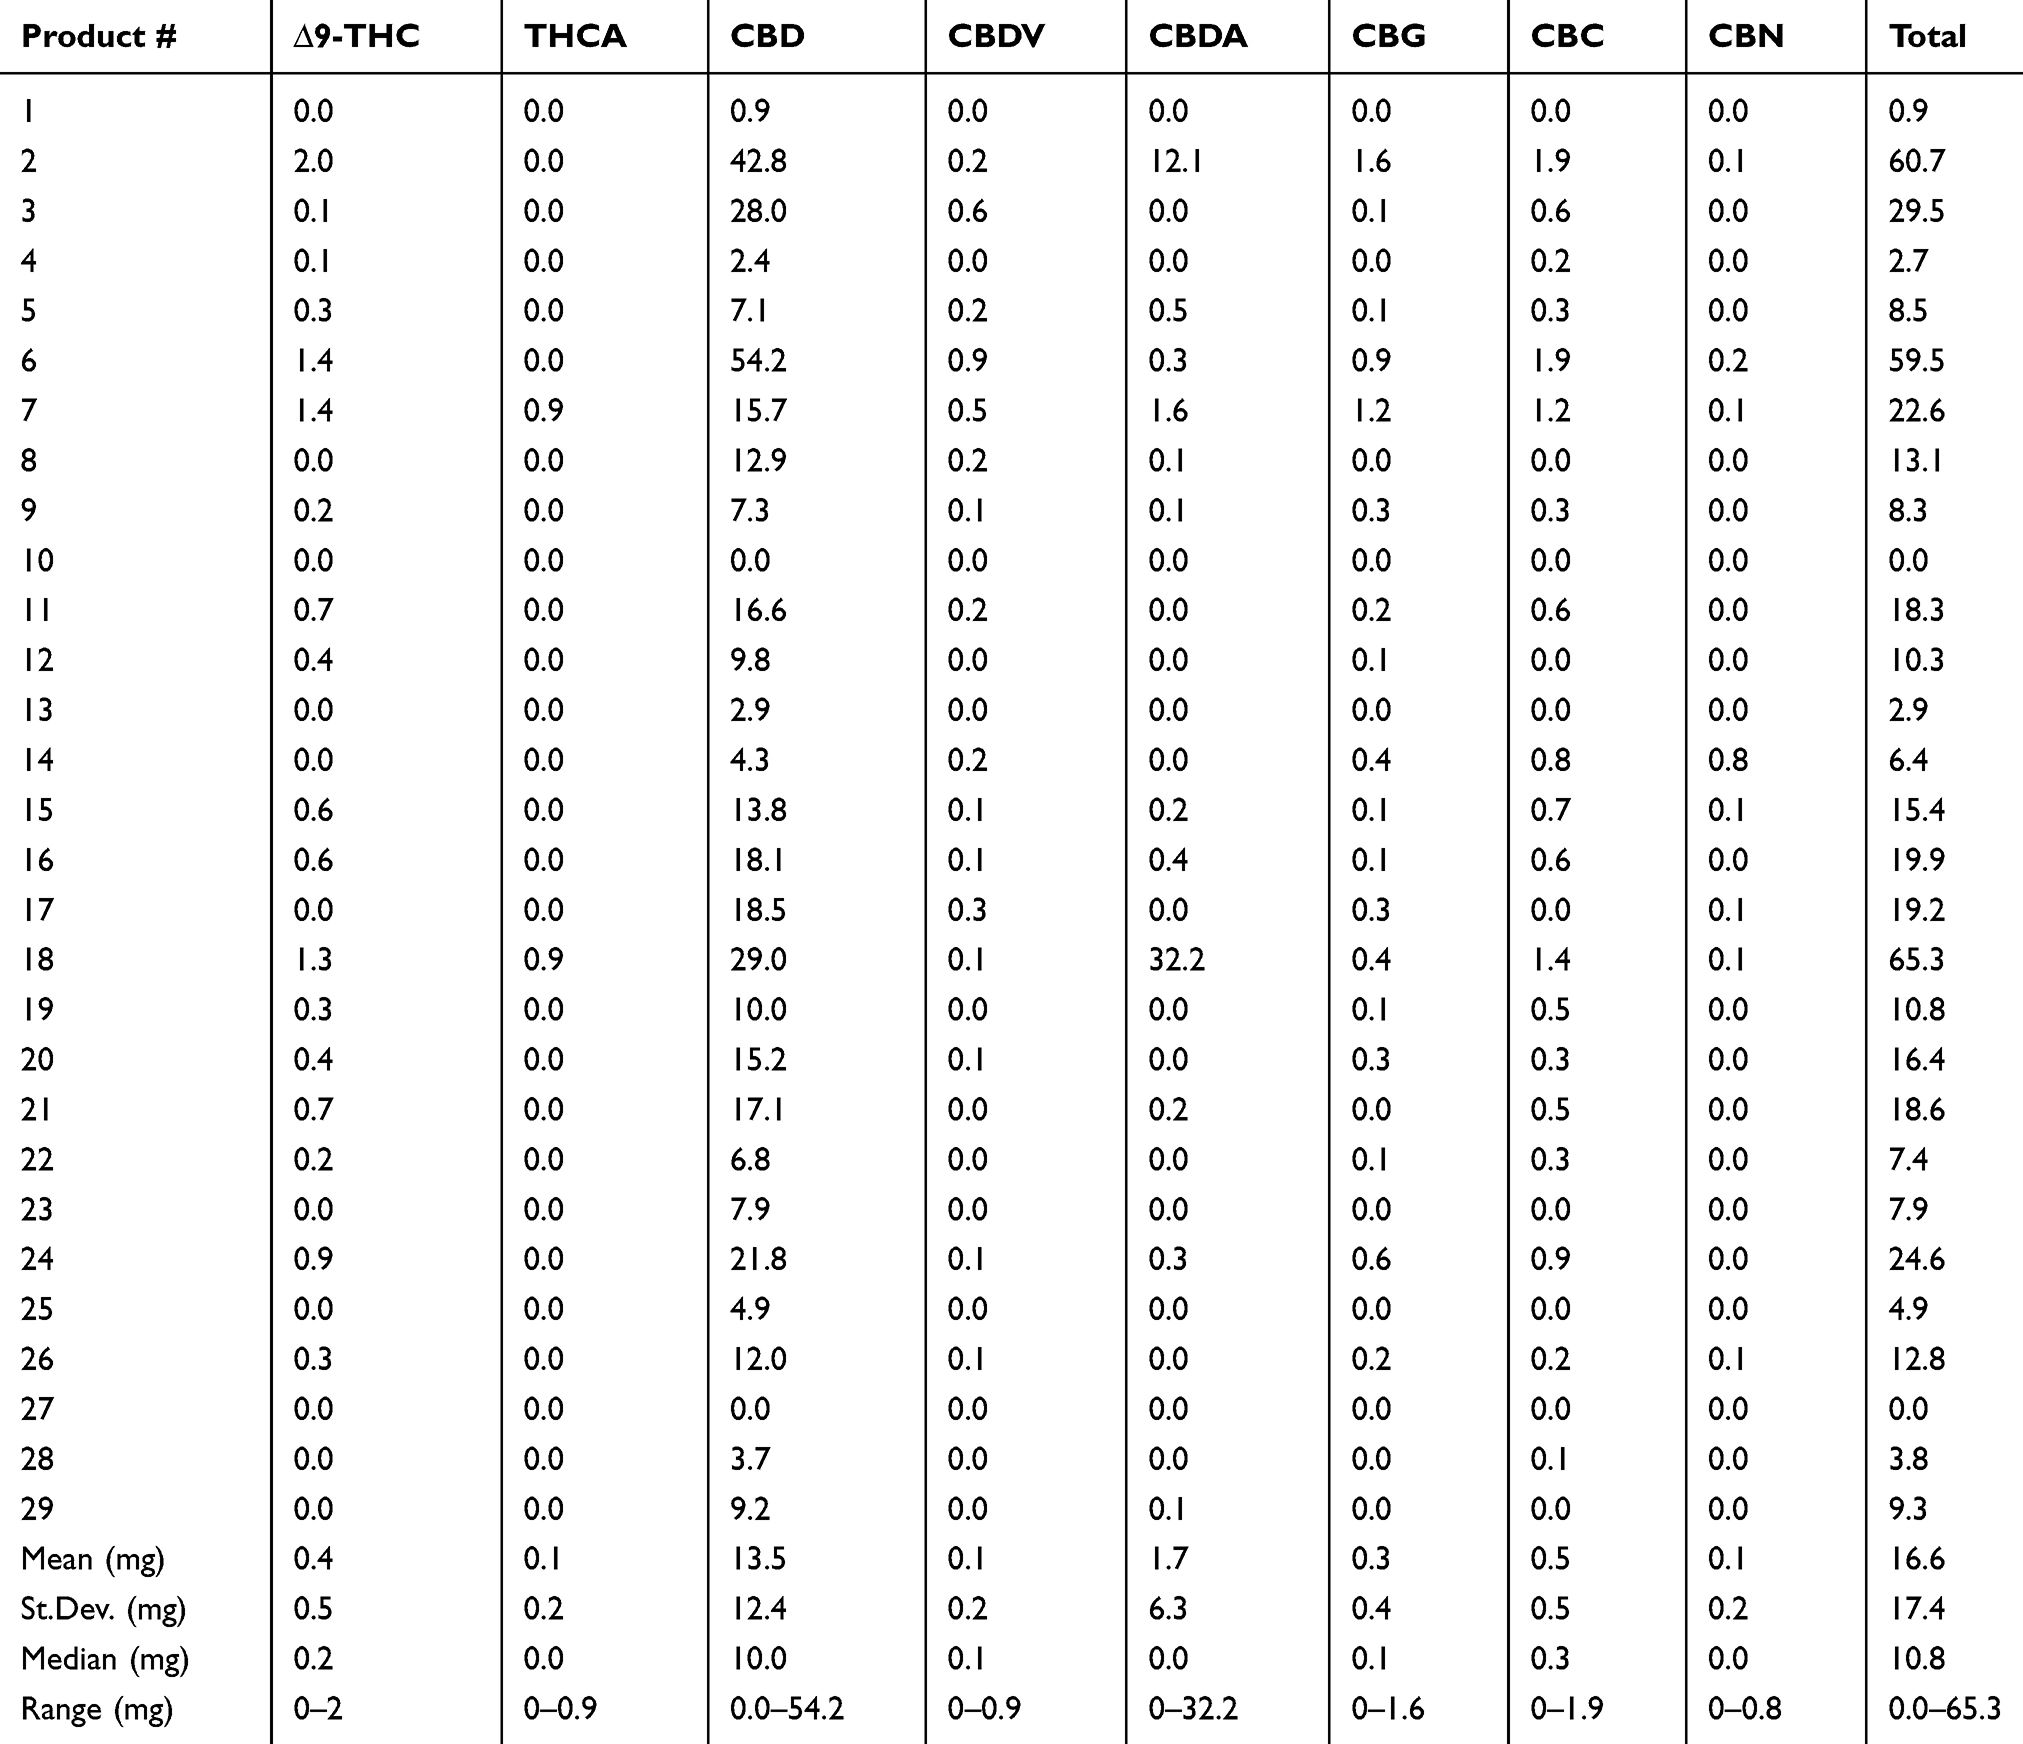
File:Tab2 Wakshlag VetMedResRep2020 11.jpg ...ts represented. Total cannabinoids detected for each product in right hand column.(2,023 × 1,744 (761 KB)) - 22:48, 20 December 2023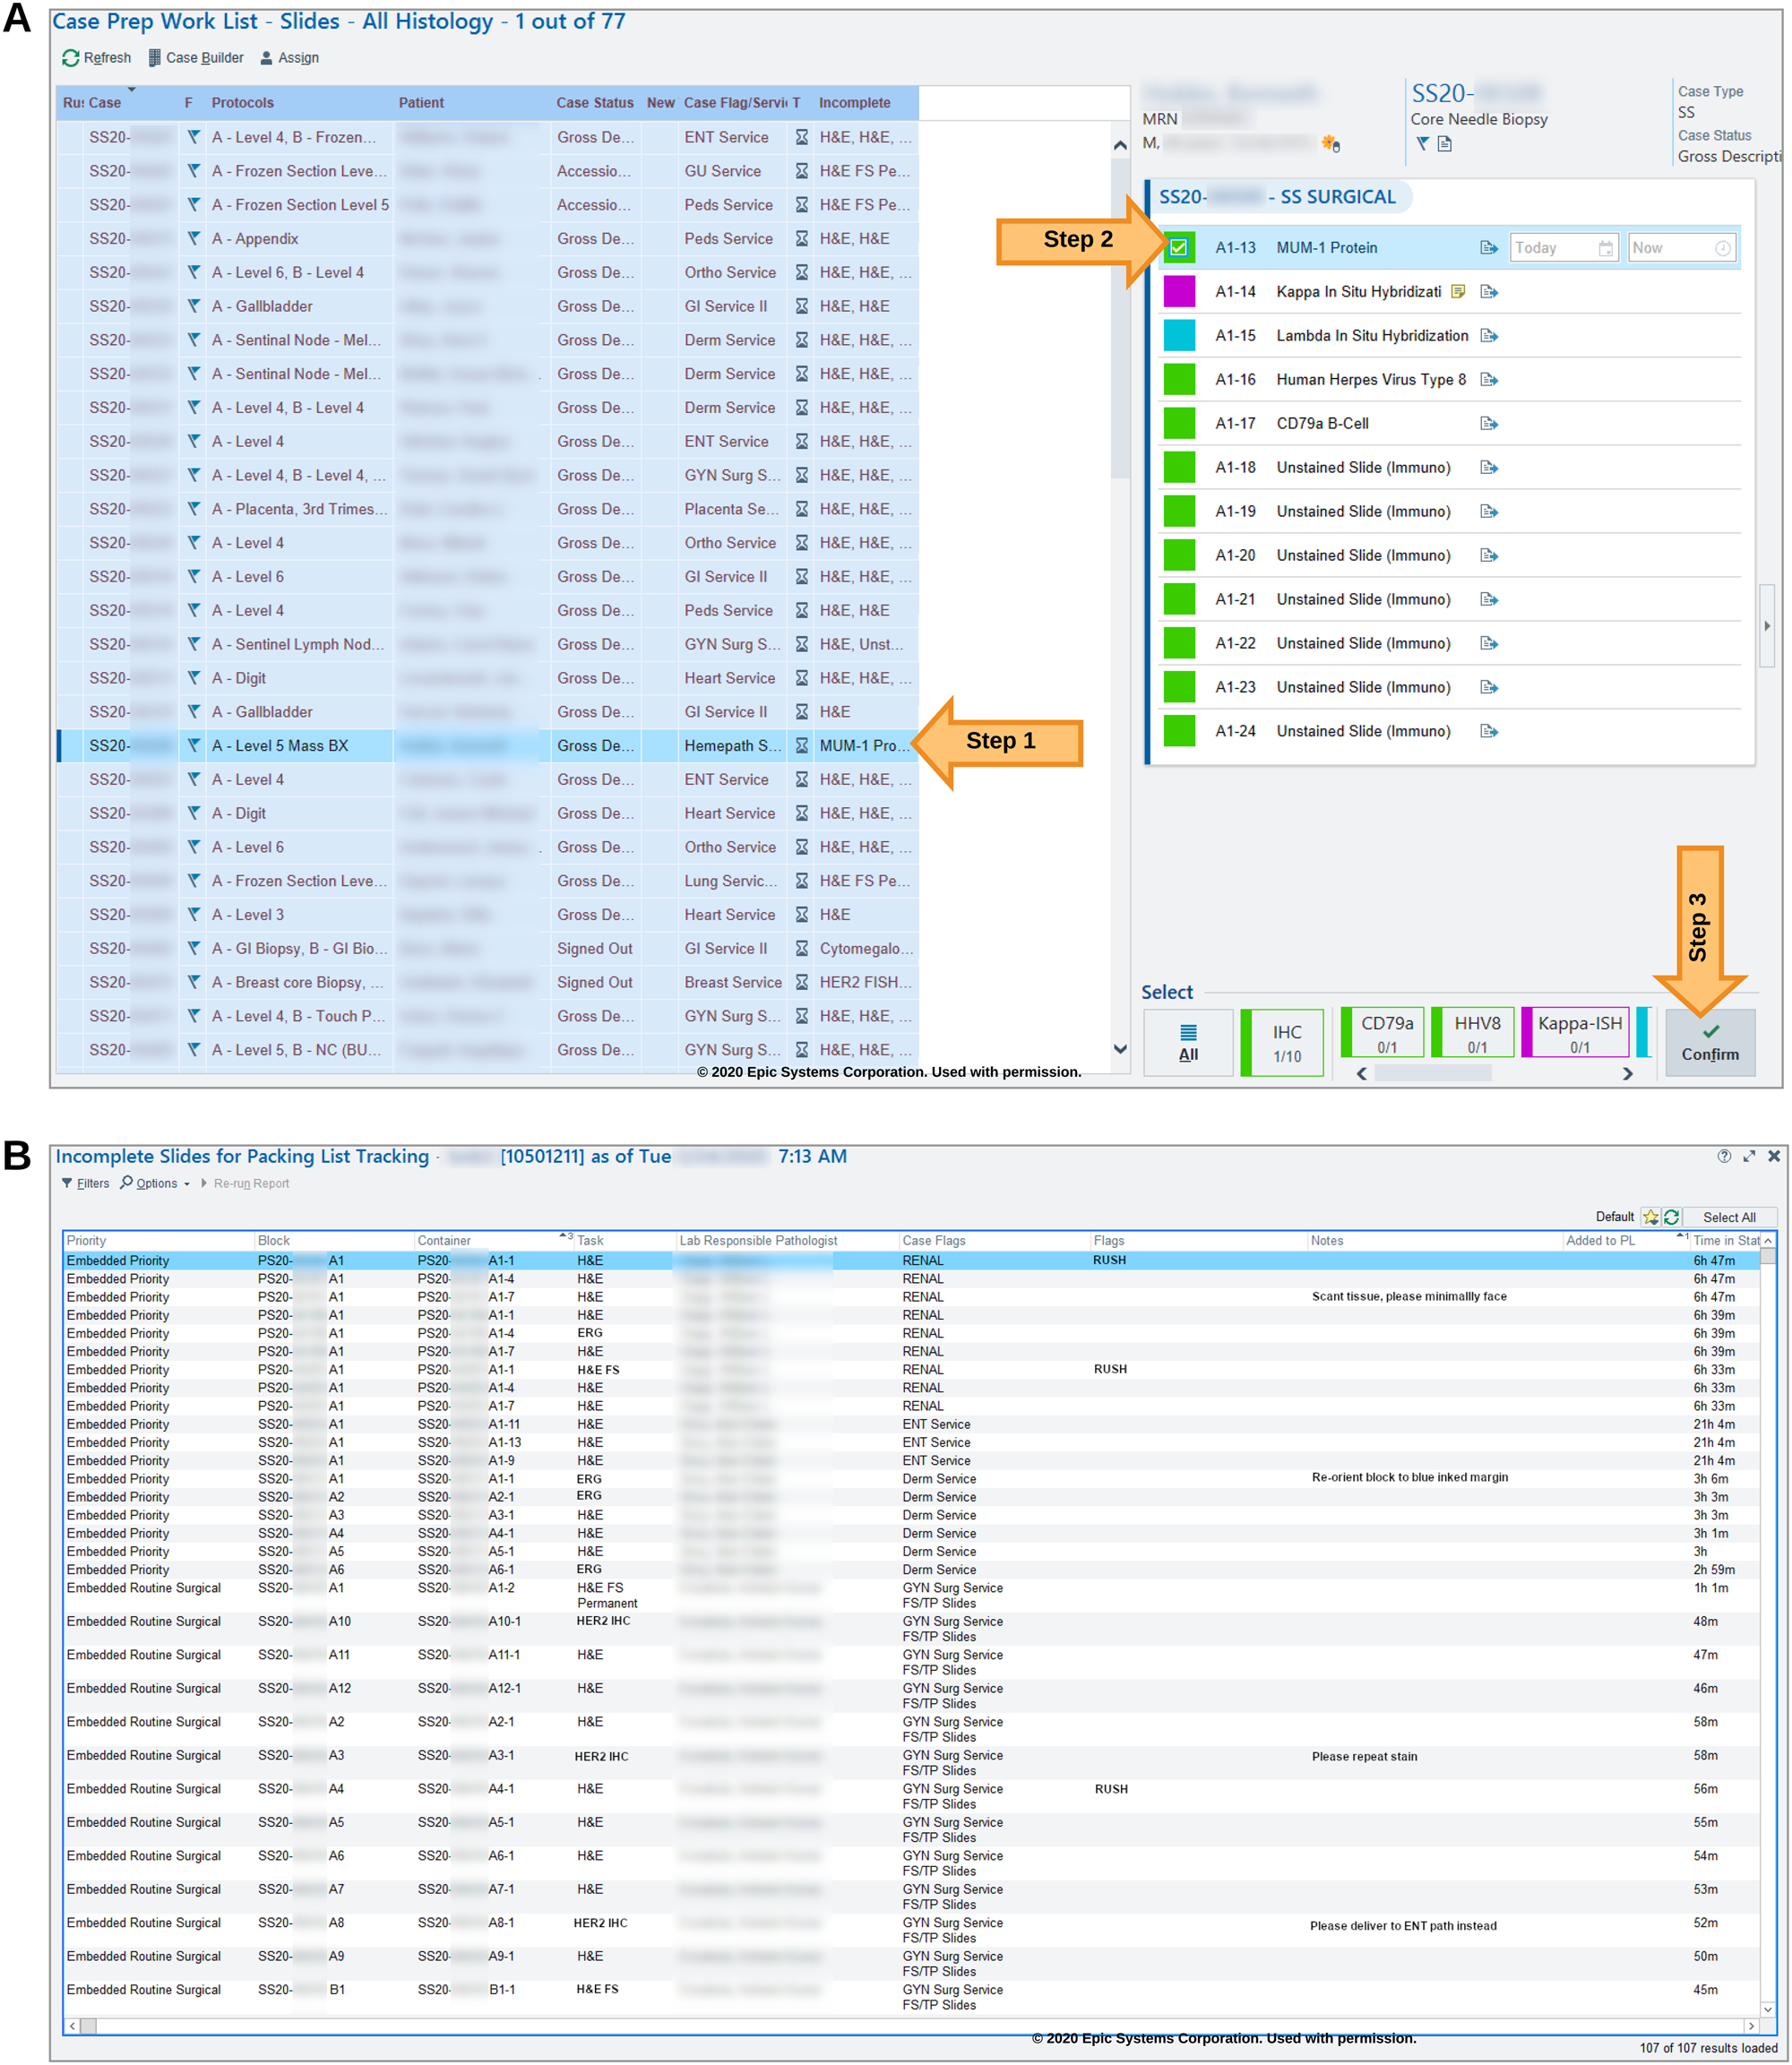
File:Fig1 Seifert JAMIAOpen20 3.png ...es pending histology tasks by case with a truncated list, the “Incomplete” column, to show the actual pending task types. Specific tasks are “confirmed”(2,000 × 2,305 (1.77 MB)) - 22:45, 2 May 2021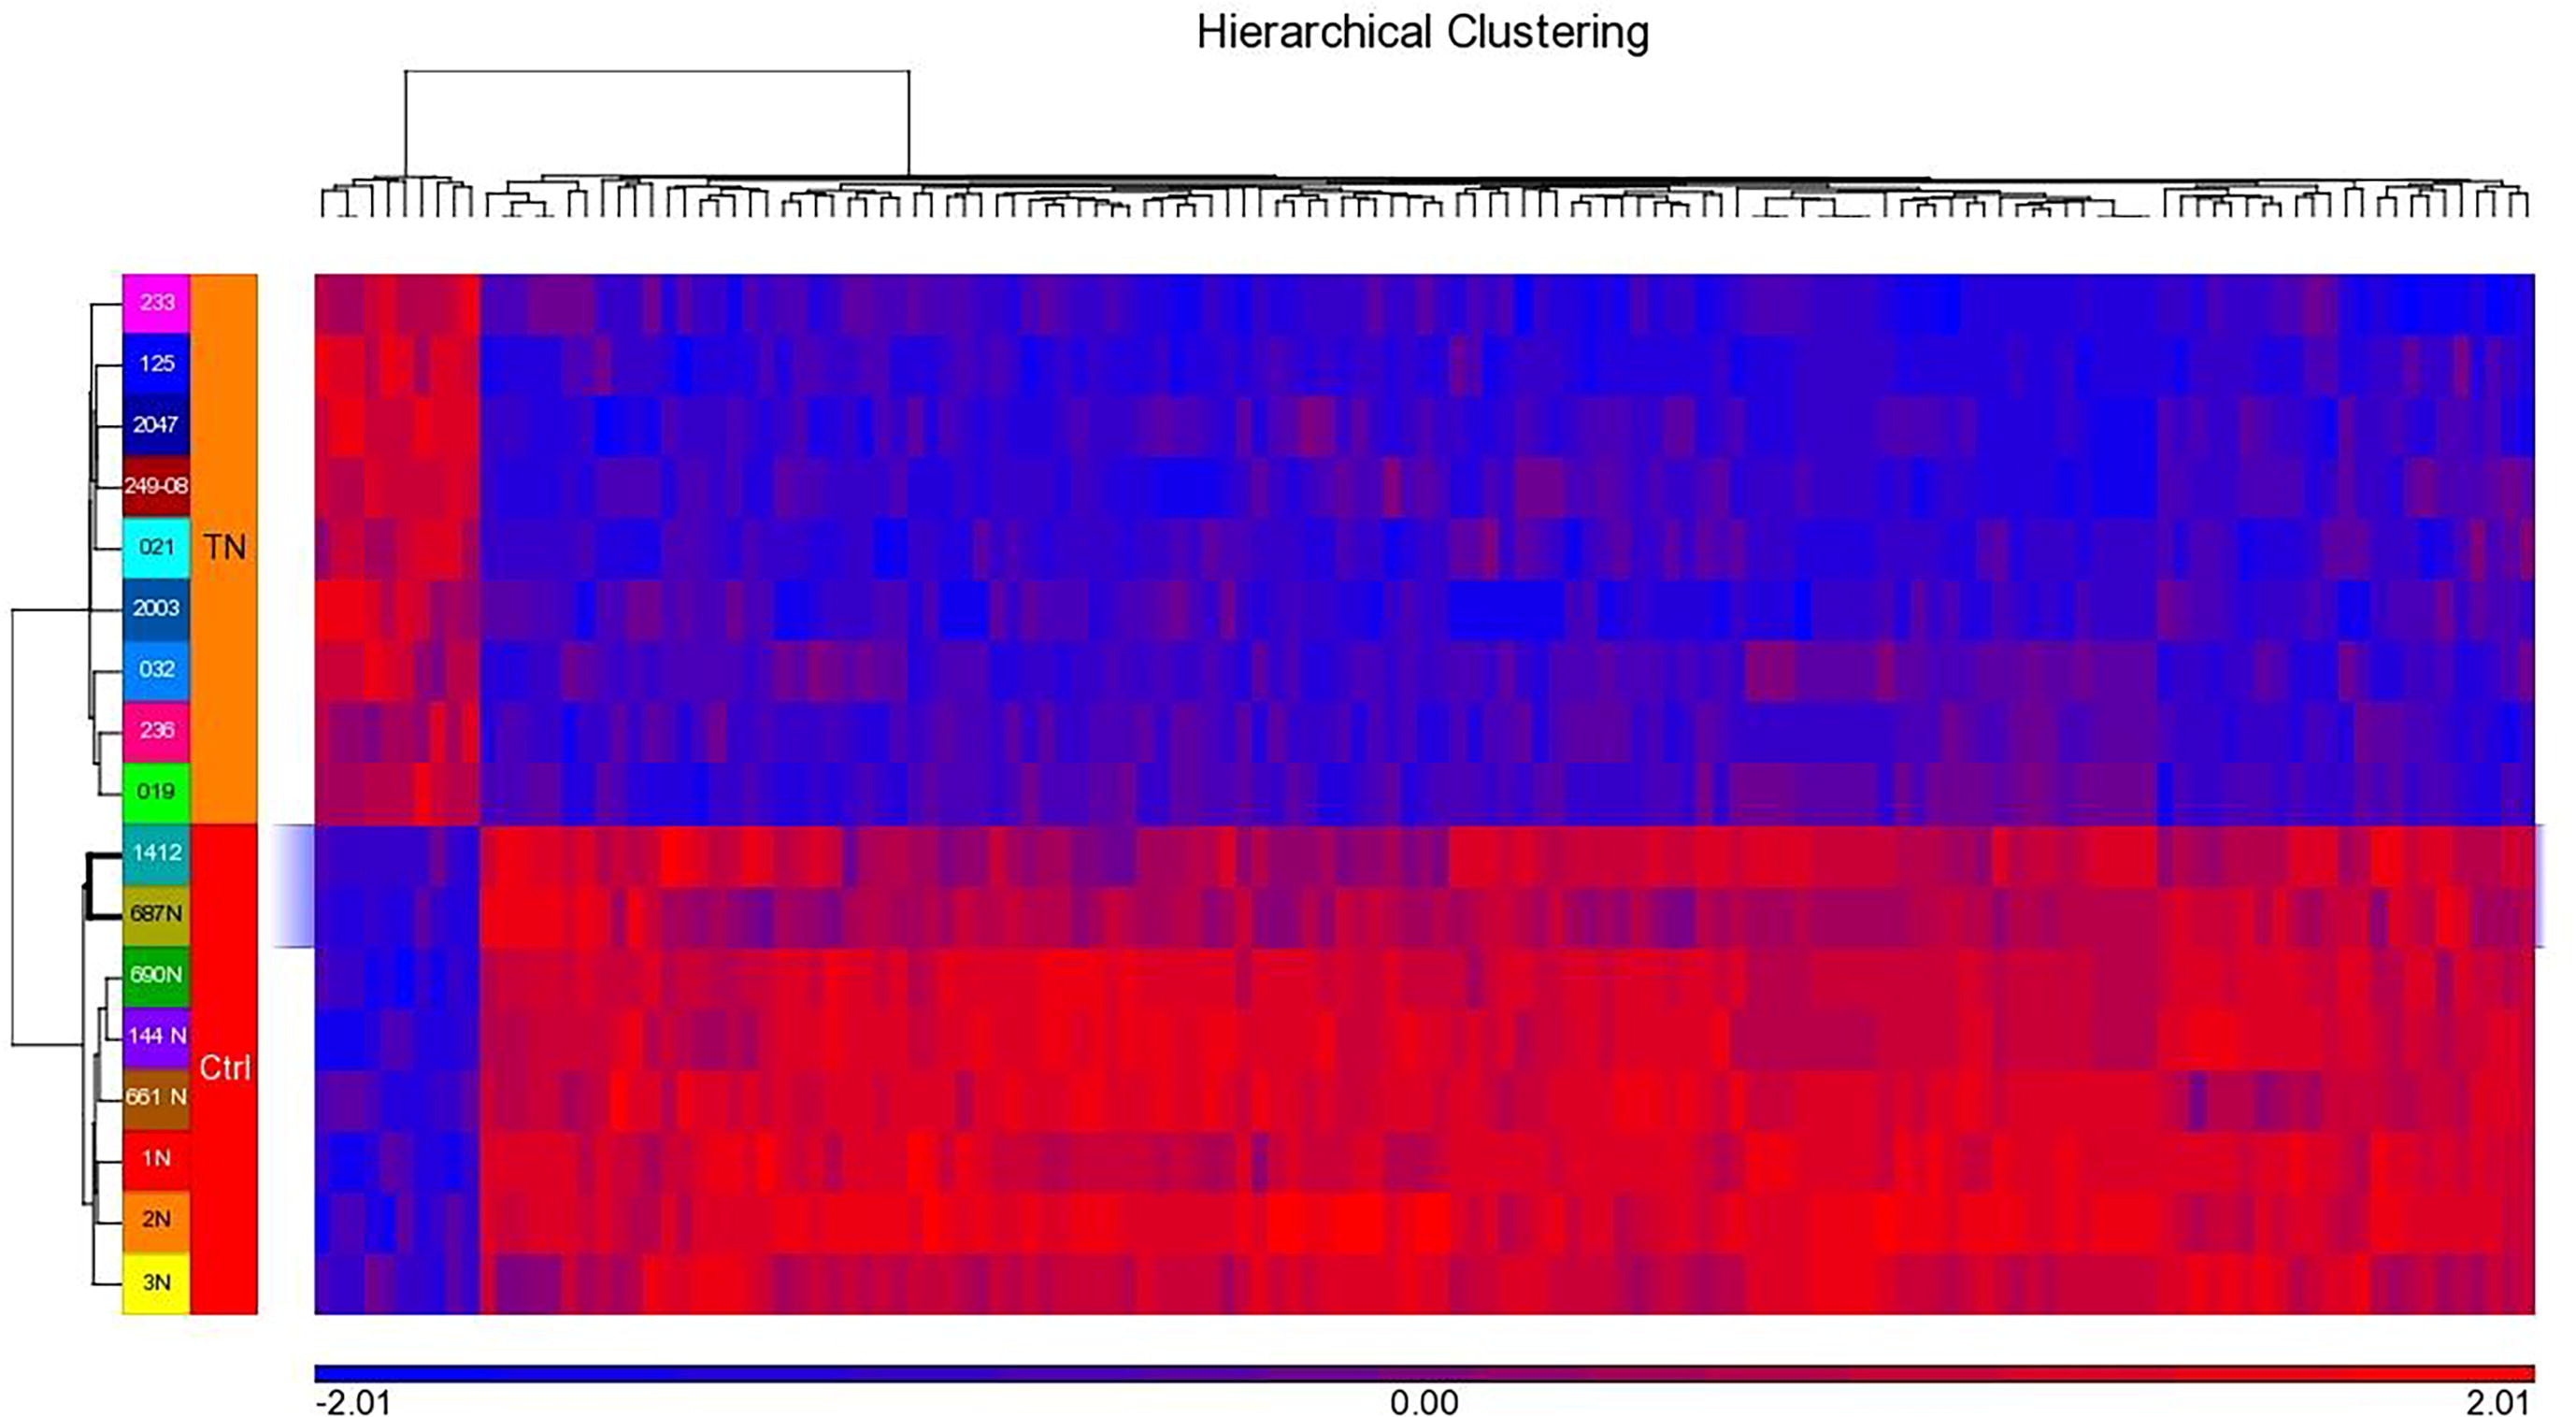
File:Fig6 Karim JofKSUScience2022 34-2.jpg ...ystem. Blue and red colors indicating down- and upregulated genes. Row and Column represents samples and DEGs, respectively.(2,756 × 1,516 (364 KB)) - 22:01, 4 July 2022
File:Pharma iQ-205.jpg Add as needed for sponsor column(205 × 100 (25 KB)) - 19:38, 19 January 2016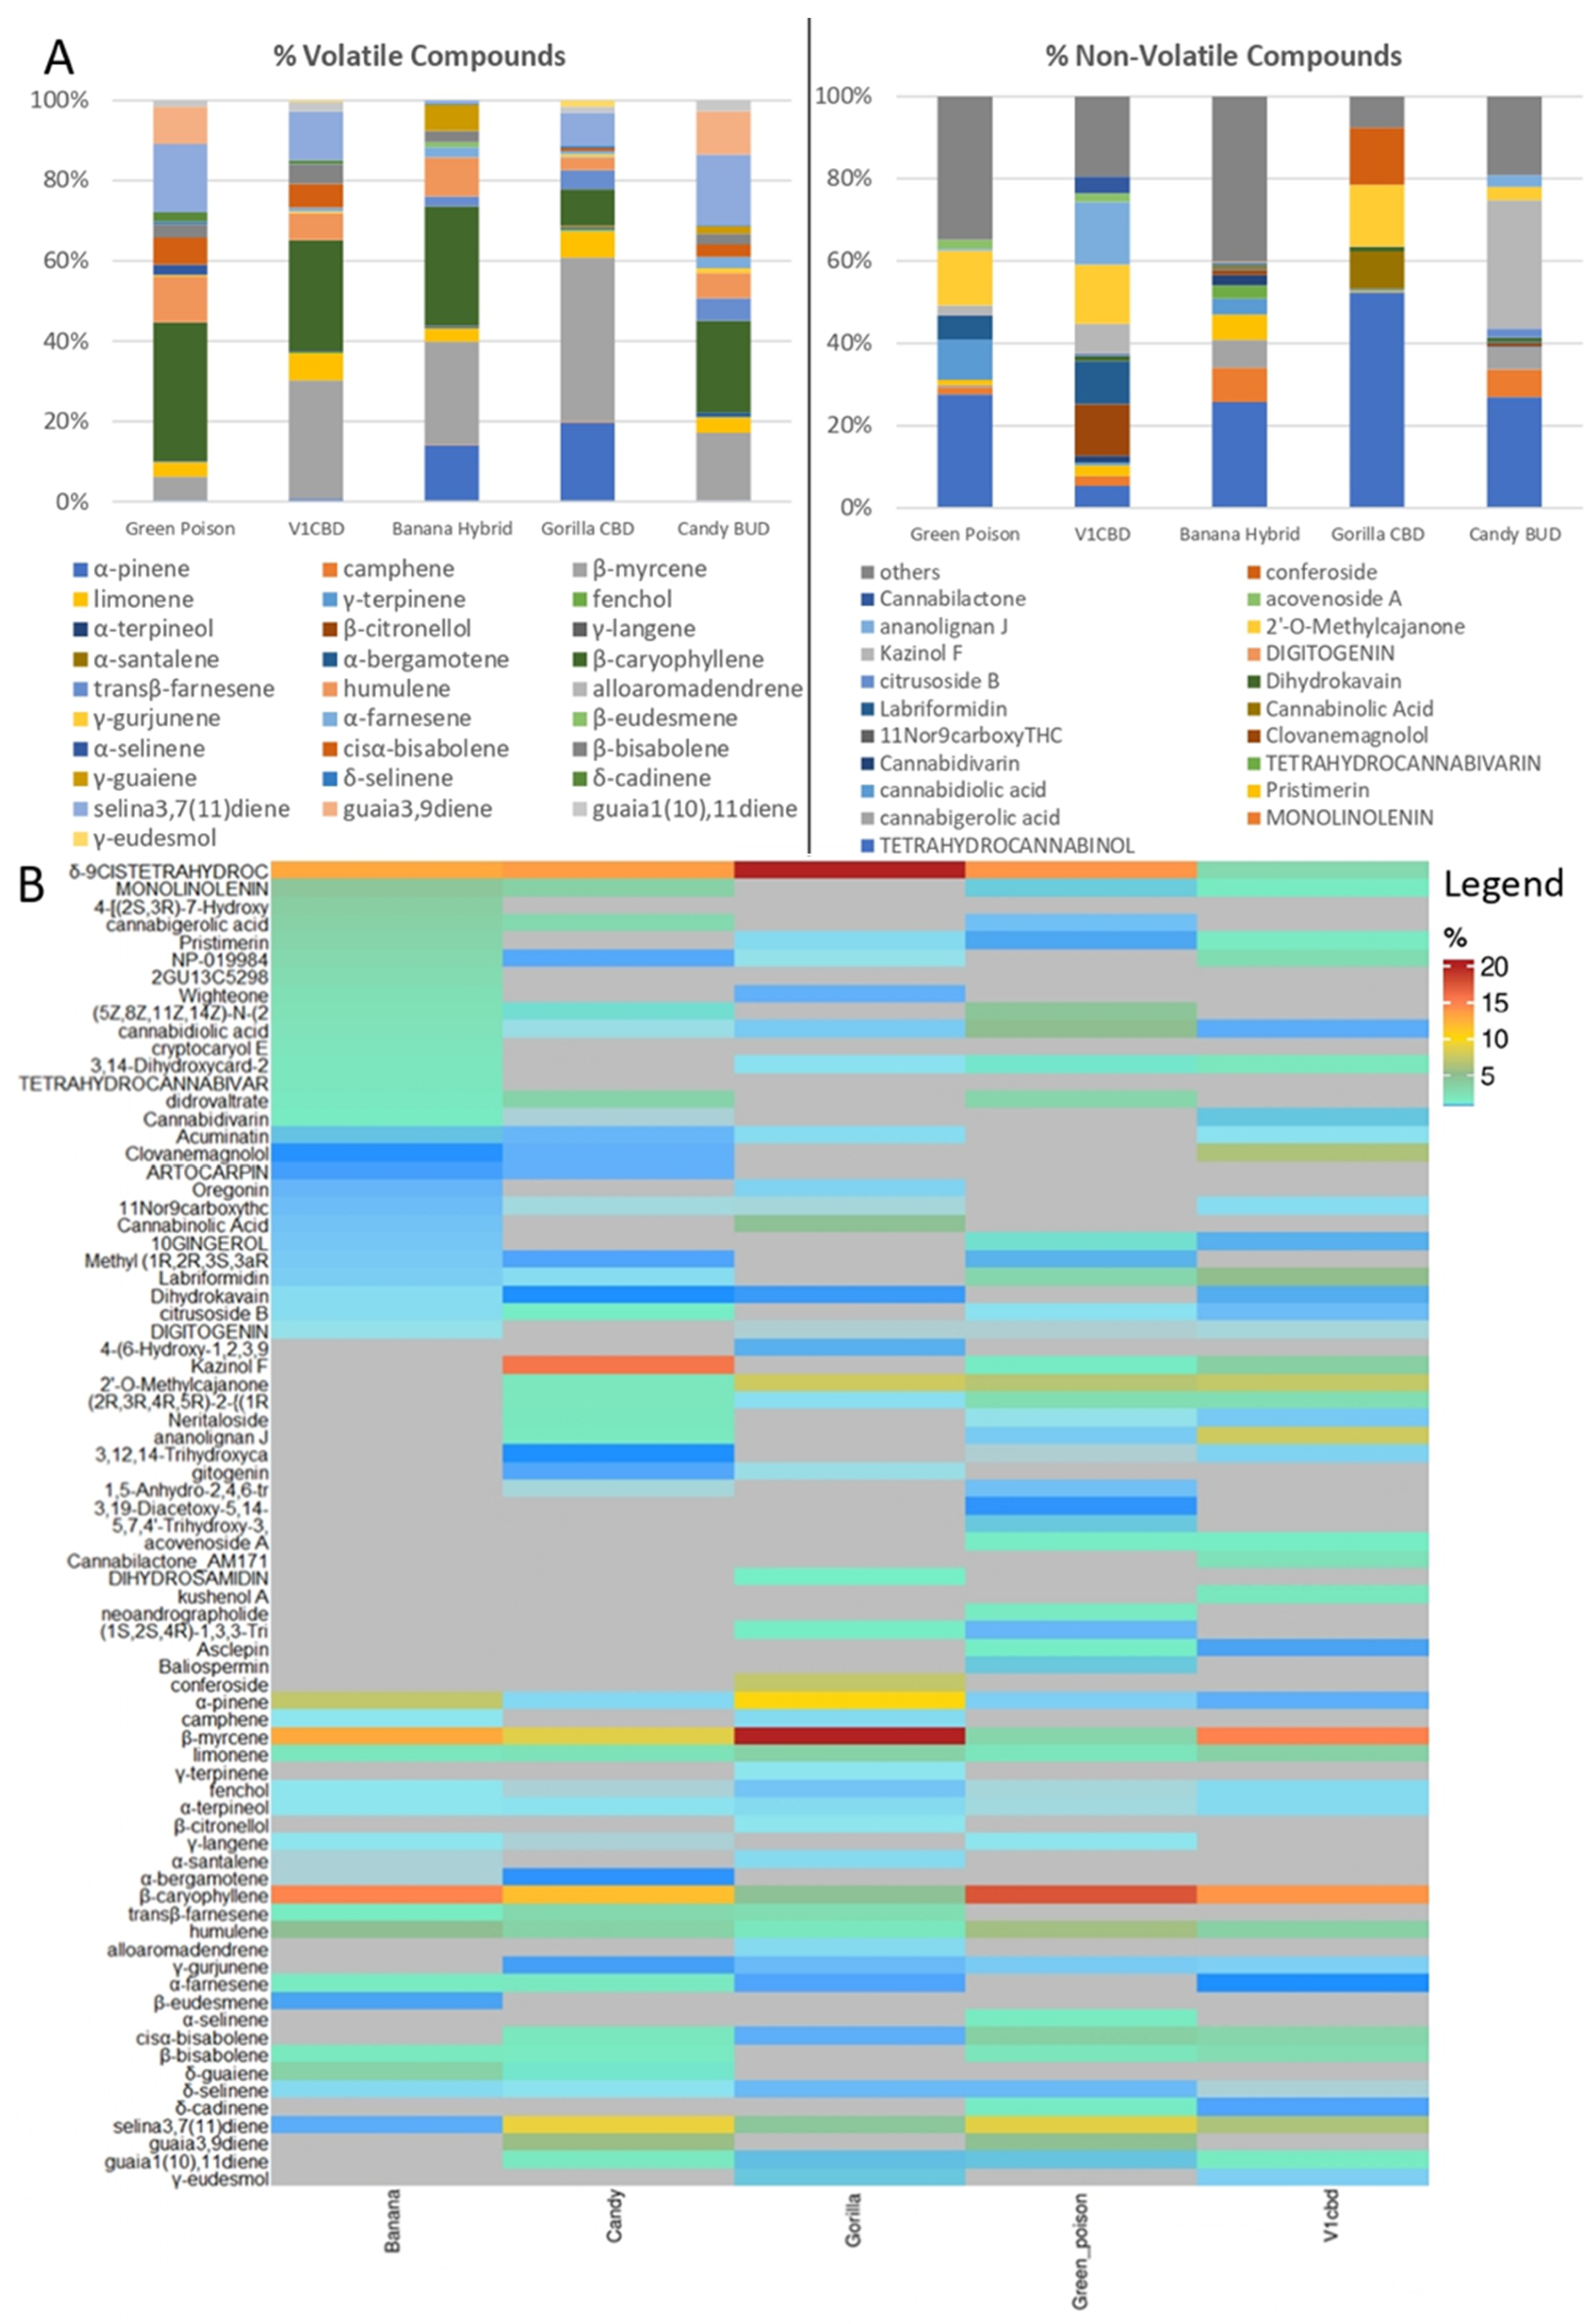
File:Fig2 Cicaloni Separ22 9-4.png ...ge in five cultivars of ''C. sativa'' L. Each cultivar is indicated in the column, every row indicates a compound. Red indicates high abundance, whereas comp(3,384 × 4,934 (2.77 MB)) - 21:34, 26 December 2023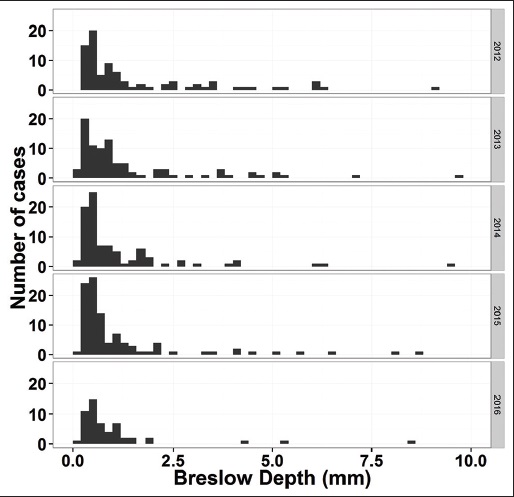
File:Fig5 Ye JofPathInformatics2016 7.jpg ...of melanoma of skin grouped by year. This graph is made using data in the column named "BreslowDepth (mm)," and the data are grouped by the year when the su(514 × 497 (51 KB)) - 22:49, 16 November 2016


