Search results
From LIMSWiki
Jump to navigationJump to search
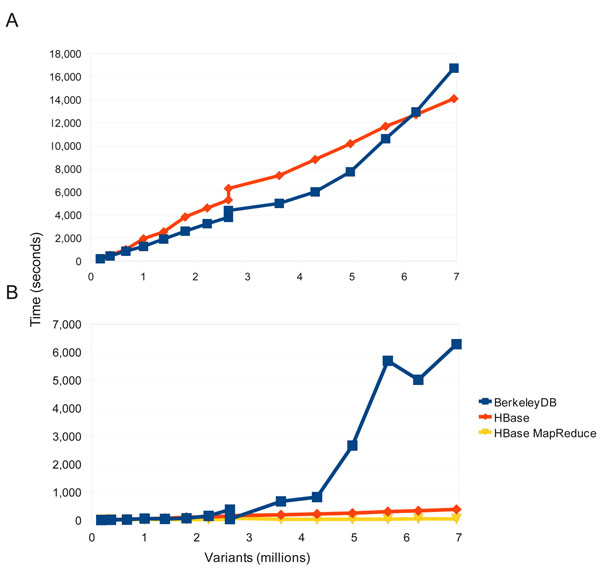
File:Fig2 OConnor BMCInformatics2010 11-12.jpg |Description='''Figure 2. Load and query performance.''' Comparisons of load and query times between the HBase and BerkeleyDB backend. (a) Load(600 × 570 (59 KB)) - 19:42, 28 December 2015
File:Fig2 Backman BMCBio2016 17.gif ...ns; (4) enumeration of up- and down-regulated DEGs for user defined sample comparisons; (5) similarity clustering of sample profiles; (6) 2-5-way Venn diagrams fo(567 × 576 (187 KB)) - 22:24, 20 August 2018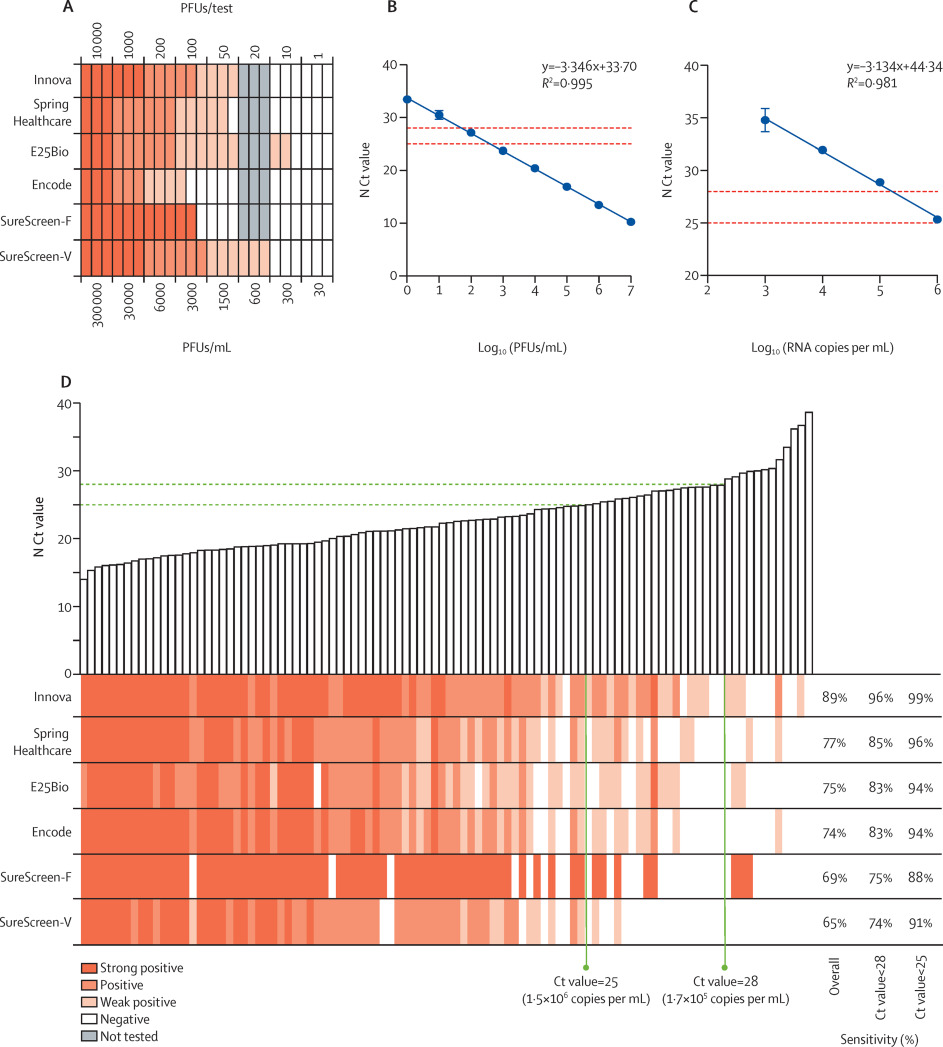
File:Fig1 Pickering LancetMicrobe2021 2-9.jpg ...r sensitivity determinations. (''D'') Tests were evaluated in head-to-head comparisons on a panel of 100 SARS-CoV-2-positive nasopharyngeal swabs. Bars denote the(943 × 1,047 (196 KB)) - 16:48, 22 September 2021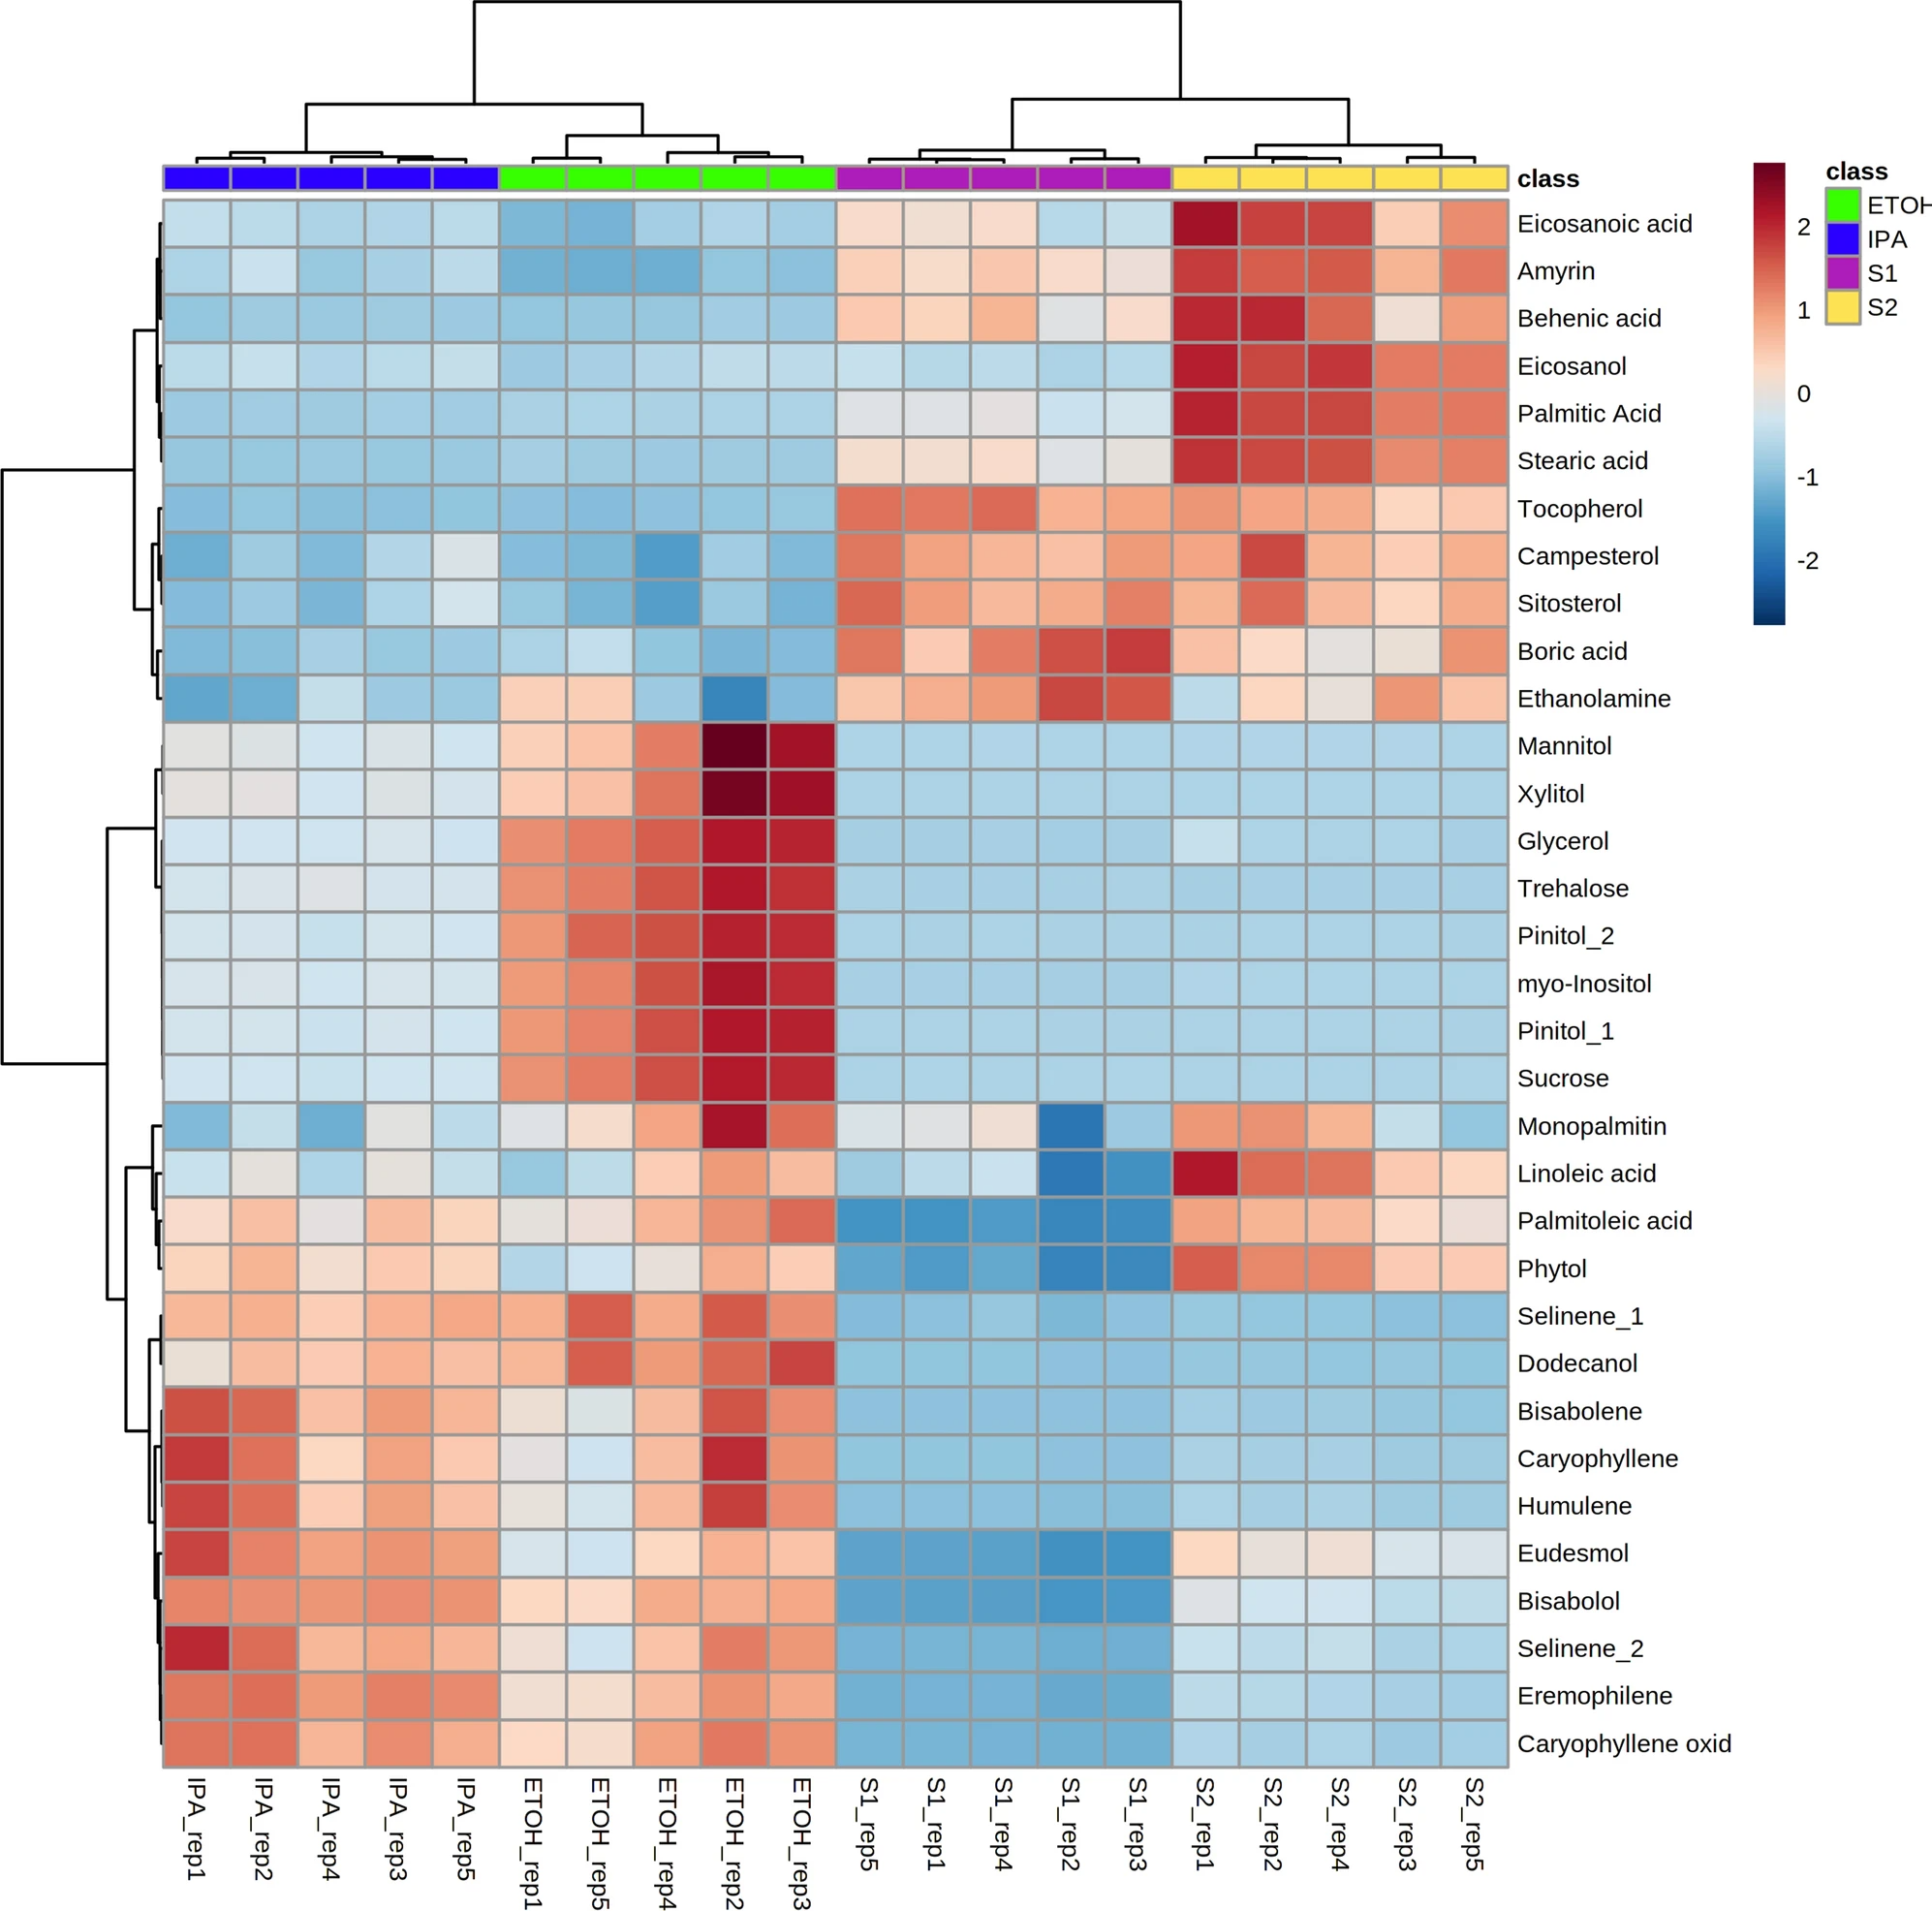
File:Fig2 Bowen ScientificReports21 11.png ...four extracts (''p'' < 0.05 after Tukey ''post-hoc'' testing for multiple comparisons). Green = ethanol extract; Blue = isopropanol extract; Purple and Y(1,994 × 1,972 (1.27 MB)) - 21:32, 26 December 2023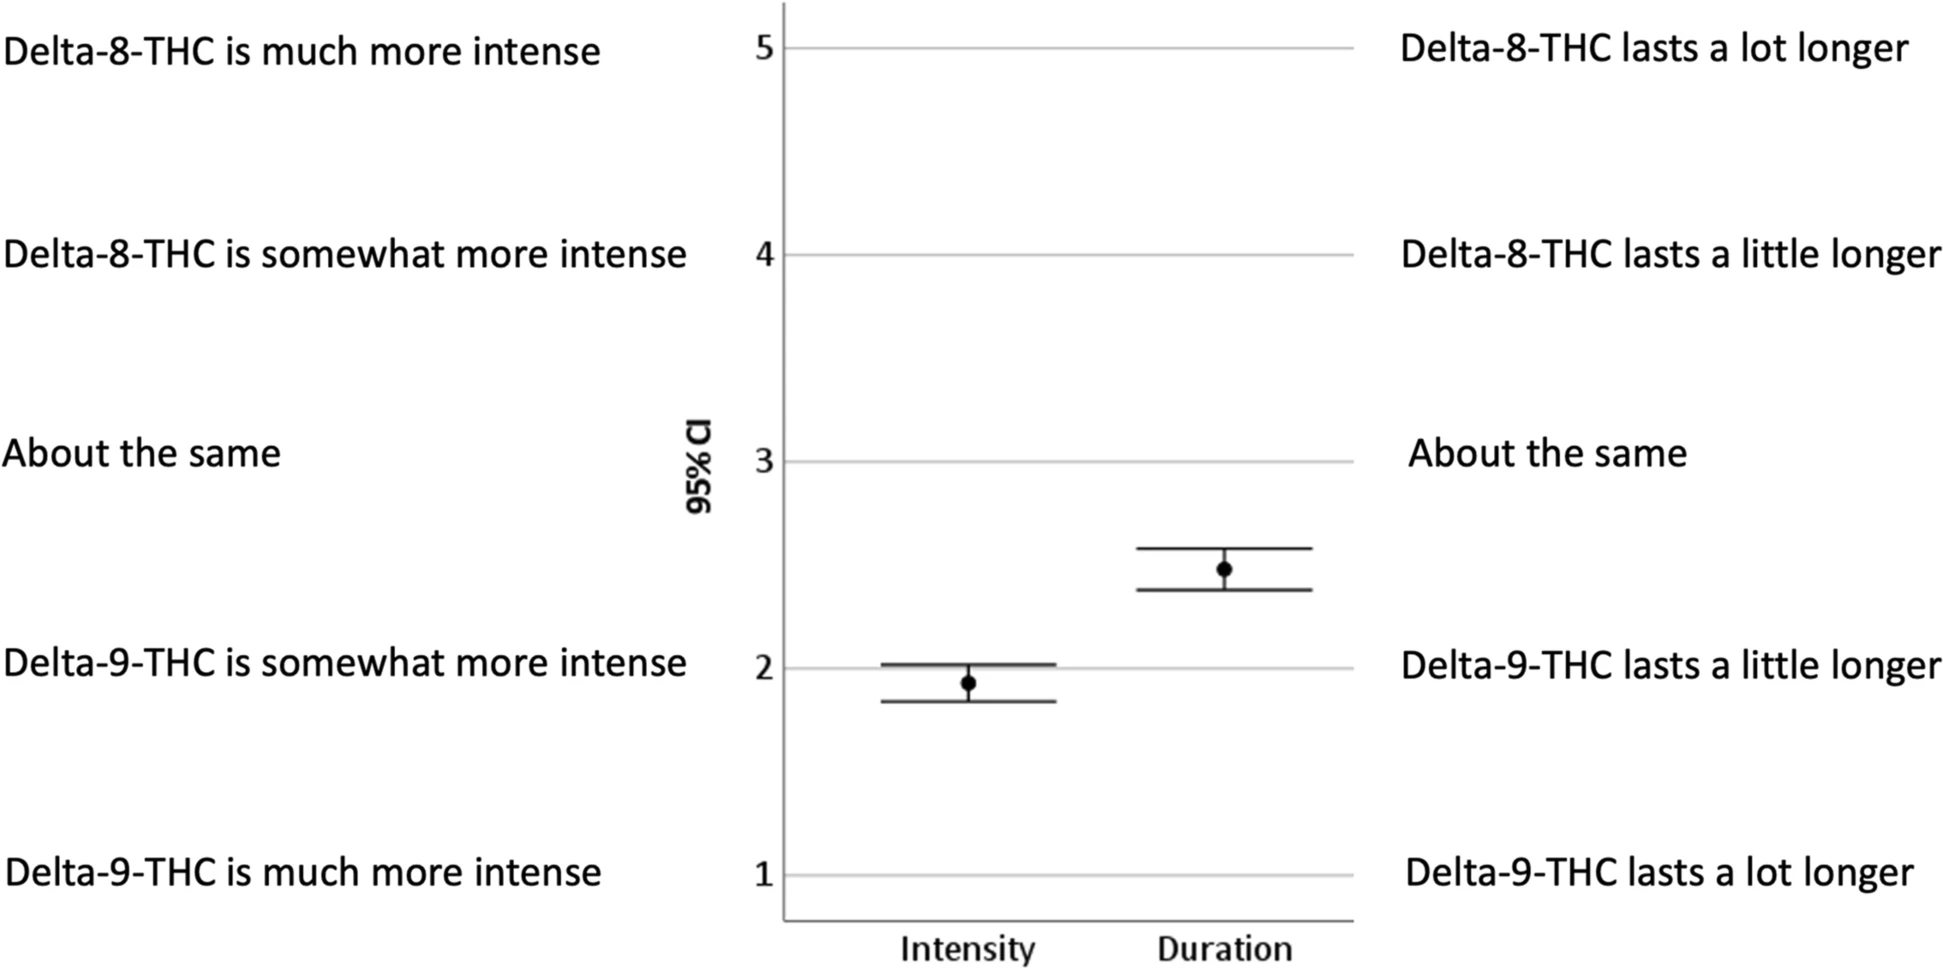
File:Fig2 Kruger JofCannRes22 4.png |Description='''Fig. 2''' Participant comparisons of Δ<sup>8</sup>-THC and Δ<sup>9</sup>-THC experiences. Values are means(1,943 × 970 (237 KB)) - 21:48, 26 December 2023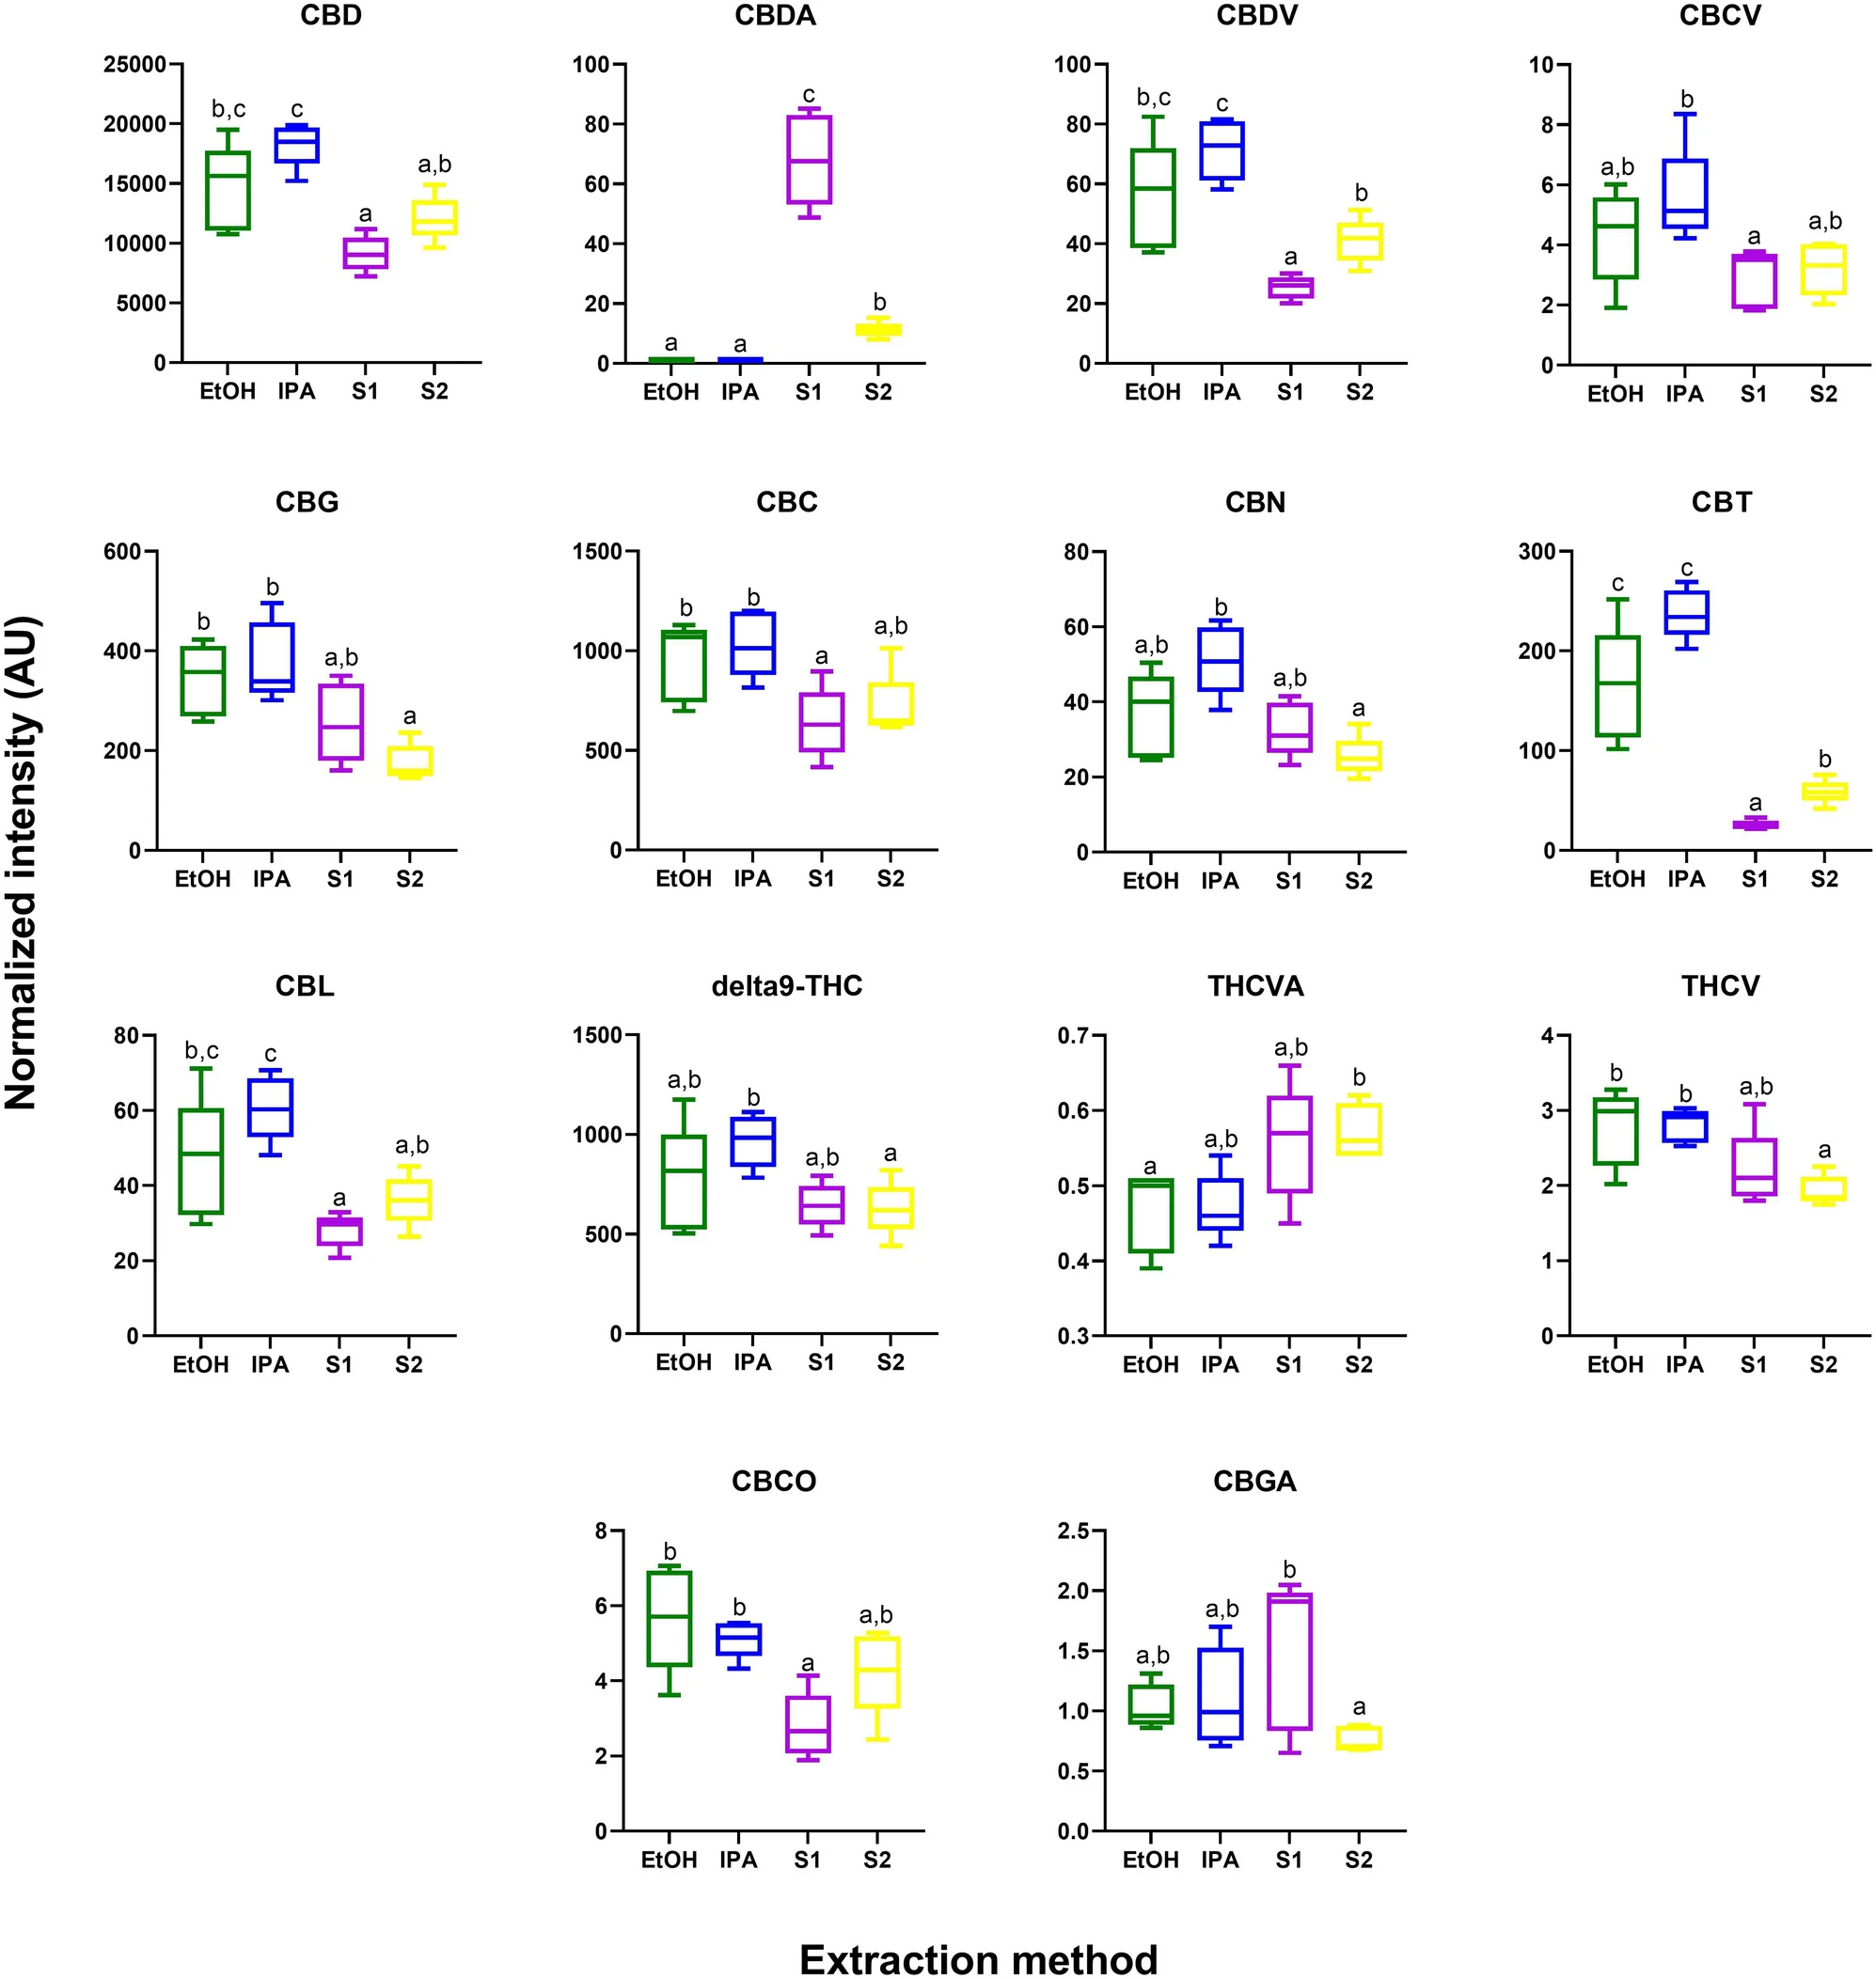
File:Fig3 Bowen ScientificReports21 11.png ...raction method (''p'' < 0.05 after Tukey ''post-hoc'' testing for multiple comparisons). Box plots indicate relative abundance of each compound between extraction(1,995 × 2,105 (834 KB)) - 21:59, 26 December 2023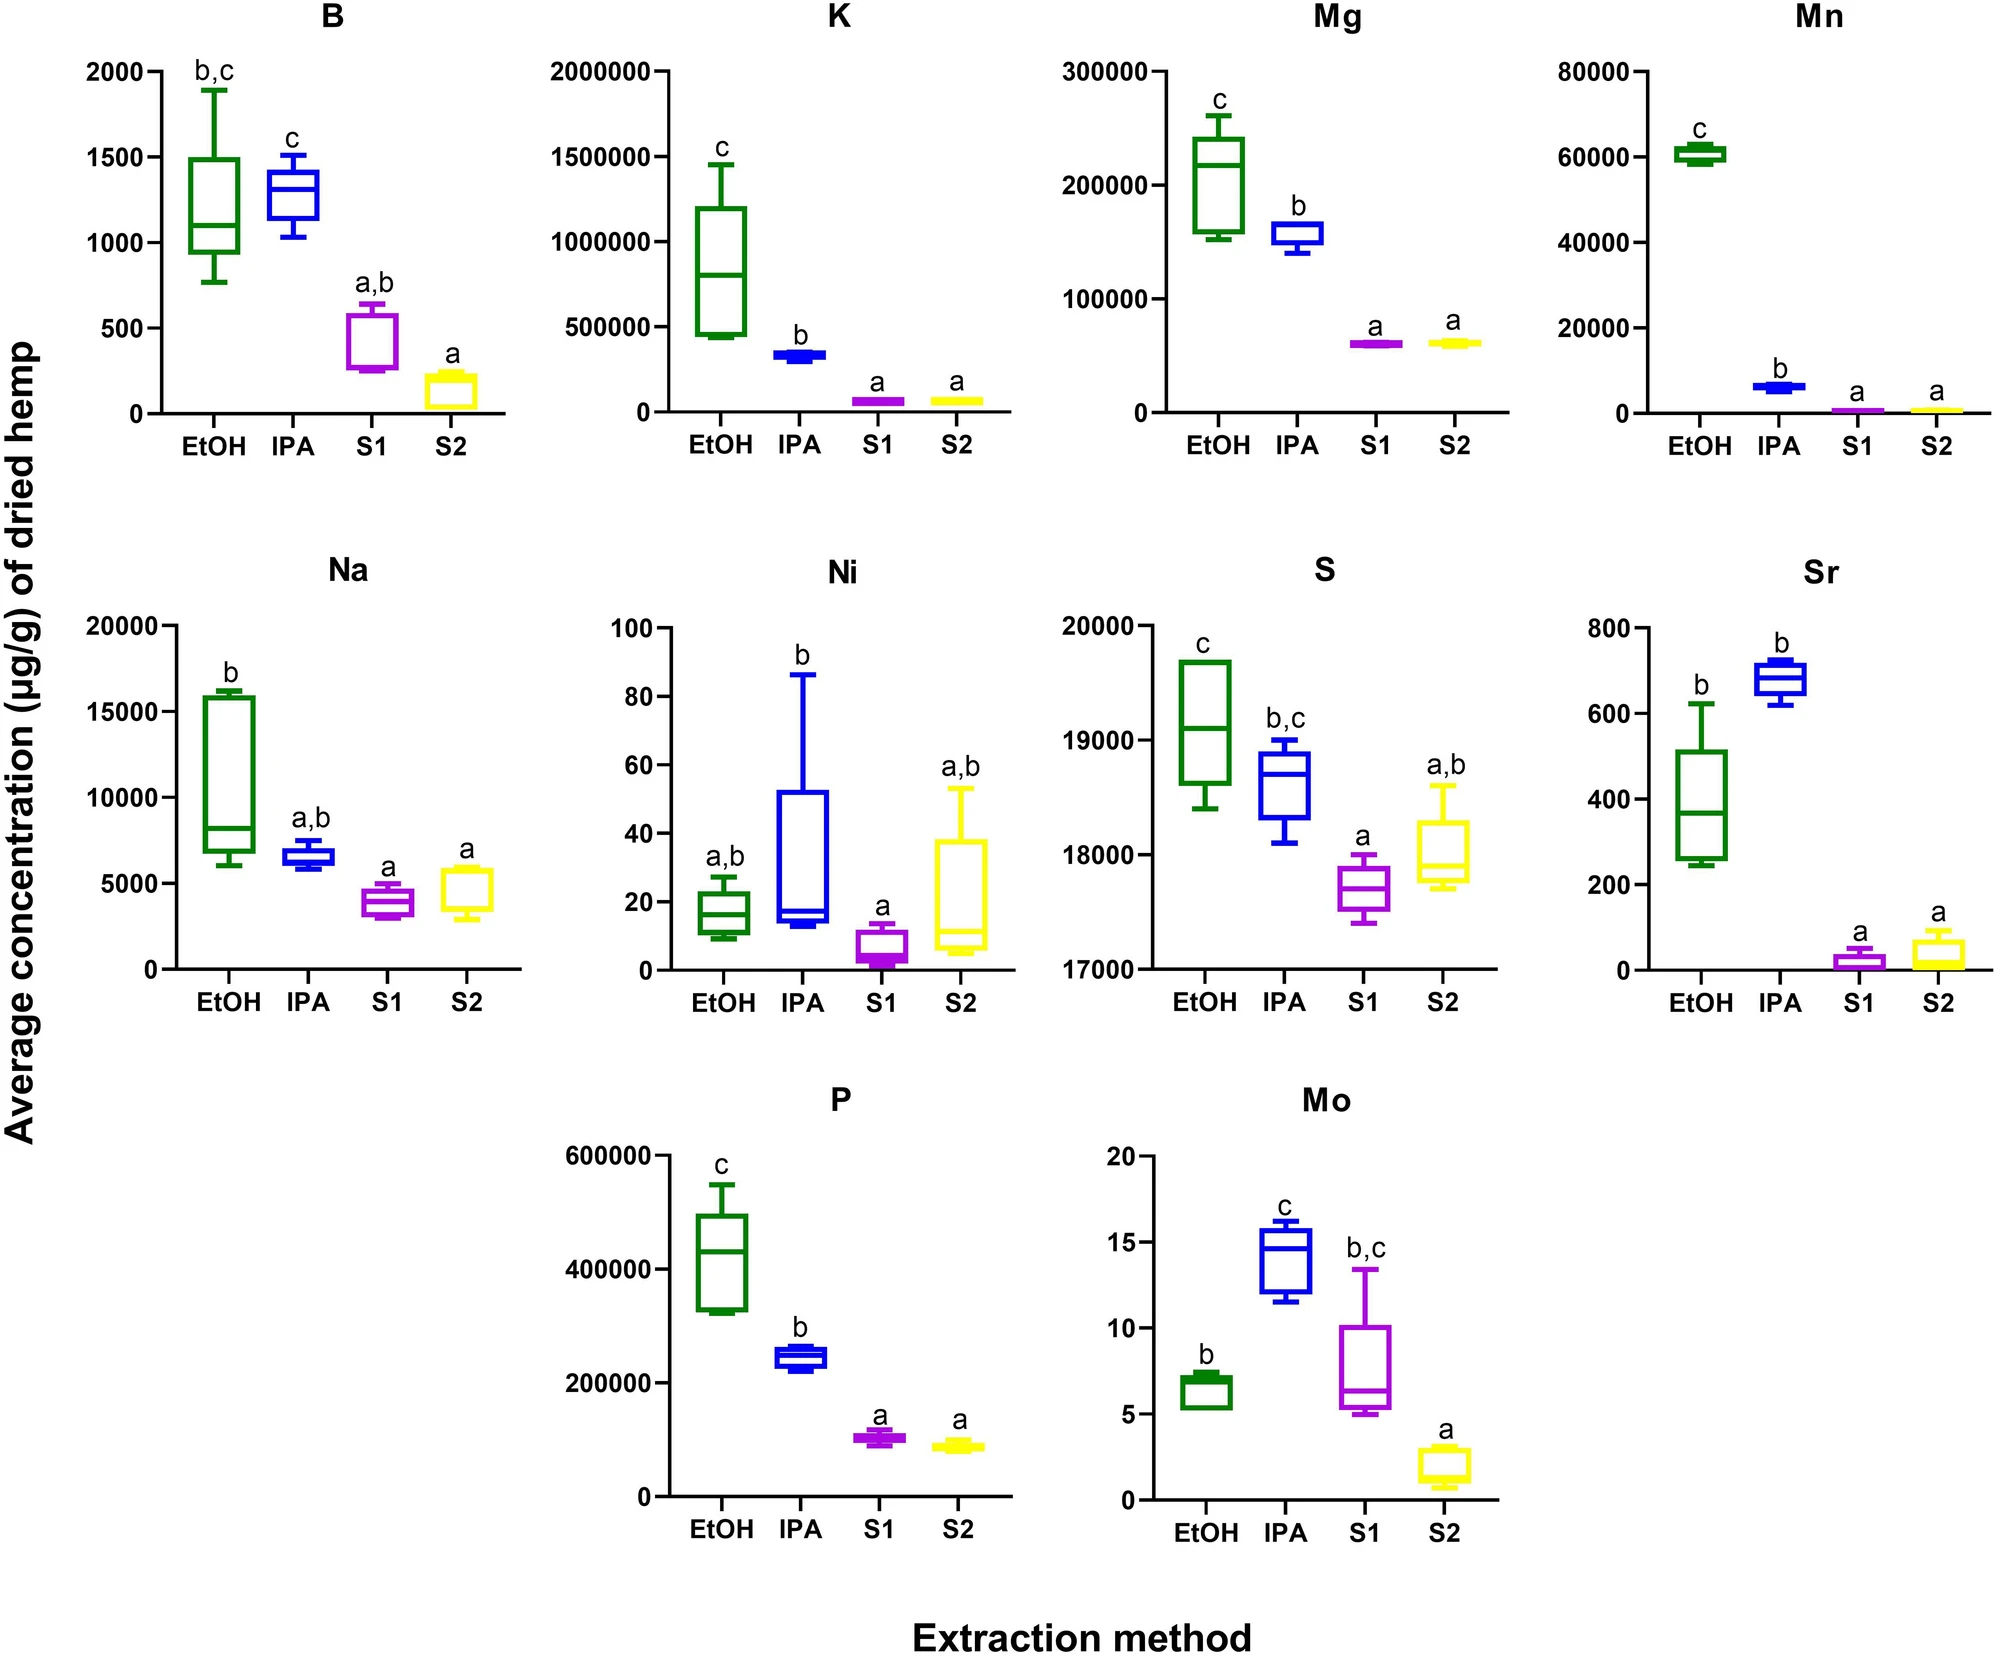
File:Fig4 Bowen ScientificReports21 11.png ...raction method (''p'' < 0.05 after Tukey ''post-hoc'' testing for multiple comparisons). Green = ethanol extract; Blue = isopropanol extract; Purple and Y(1,995 × 1,657 (606 KB)) - 22:41, 26 December 2023


