Search results
From LIMSWiki
Jump to navigationJump to search
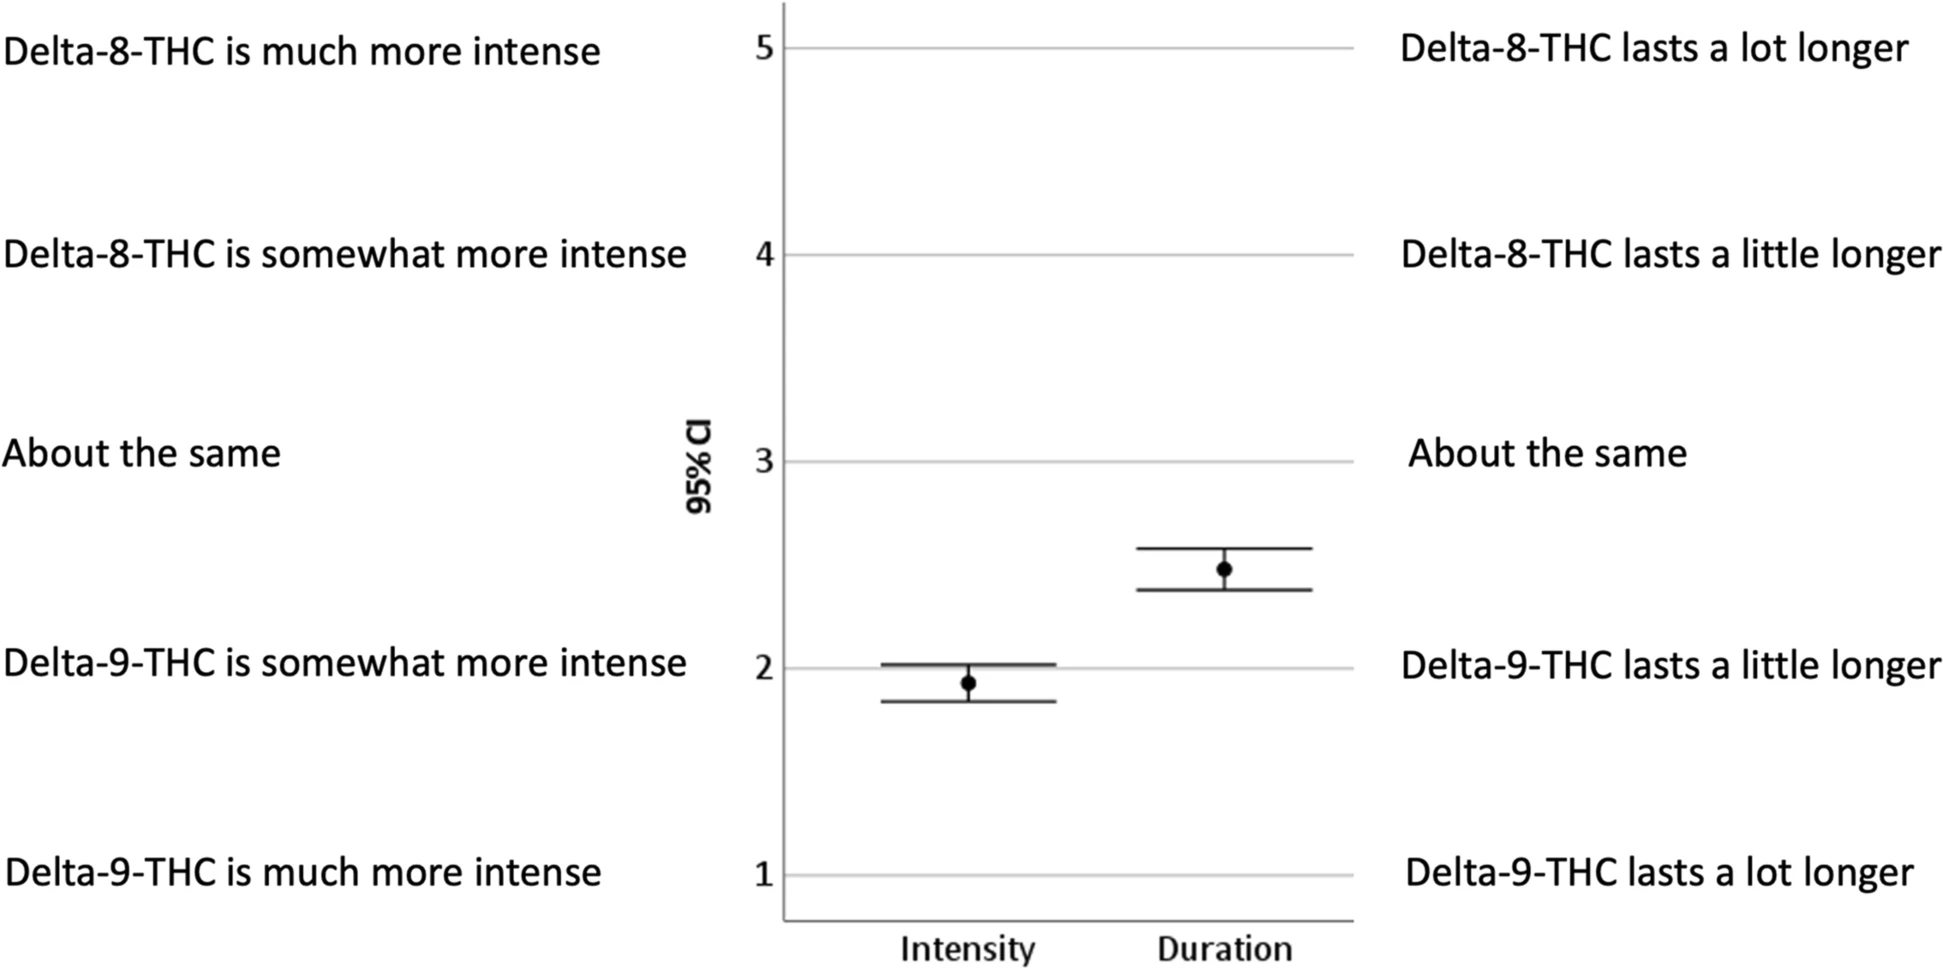
File:Fig2 Kruger JofCannRes22 4.png ...he same, 4 = Delta-8-THC is somewhat more intense, 5 = Delta-8-THC is much more intense. Duration was coded as: 1 = Delta-9-THC lasts a lot longer, 2 = Del(1,943 × 970 (237 KB)) - 21:48, 26 December 2023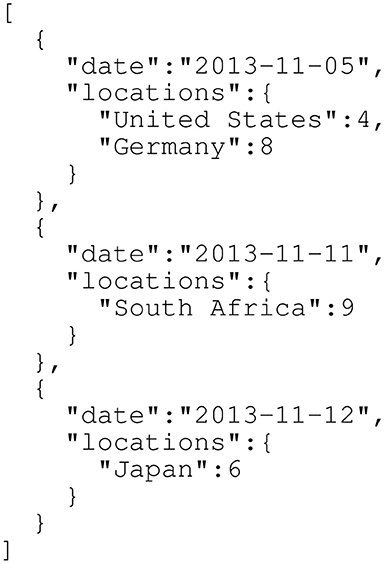
File:Fig4 Fairchild FrontPubHealth2018 6.jpg ...d to CSV (demonstrated in Figure 3), JSON contains more structure that can more rigorously specify data relationships (including hierarchical relationships |Source={{cite journal |title=Epidemiological data challenges: Planning for a more robust future through data standards |journal=Frontiers in Public Health |a(384 × 564 (88 KB)) - 20:18, 27 April 2020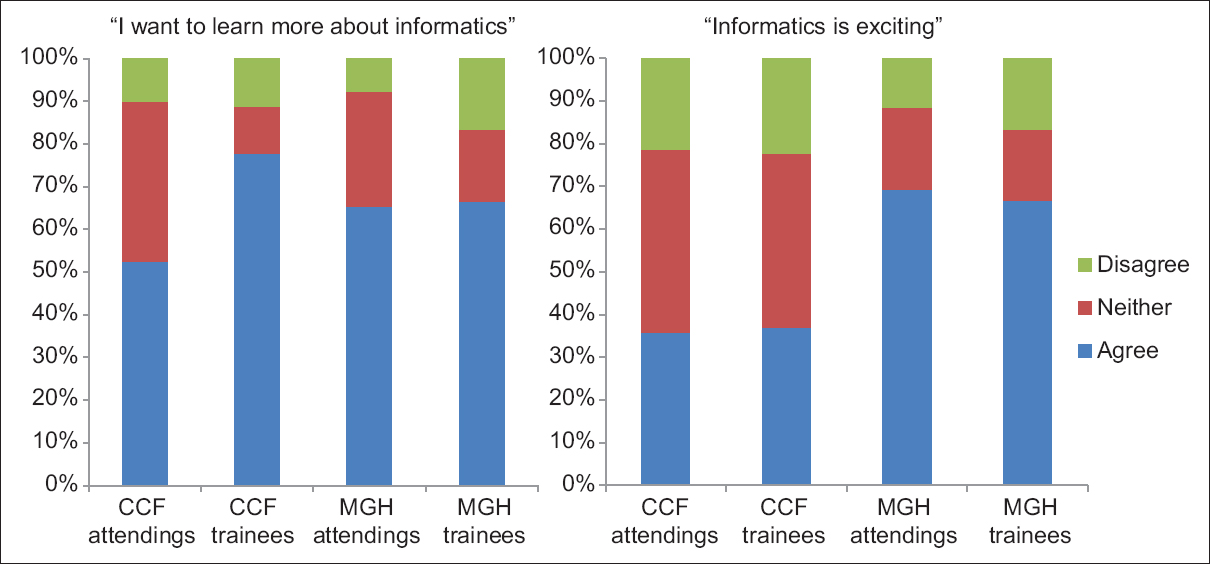
File:Fig2 Walker JofPathInformatics2016 7.jpg ...exciting." However, over half of respondents in all groups wanted to learn more about pathology informatics.(1,210 × 564 (206 KB)) - 17:46, 13 April 2016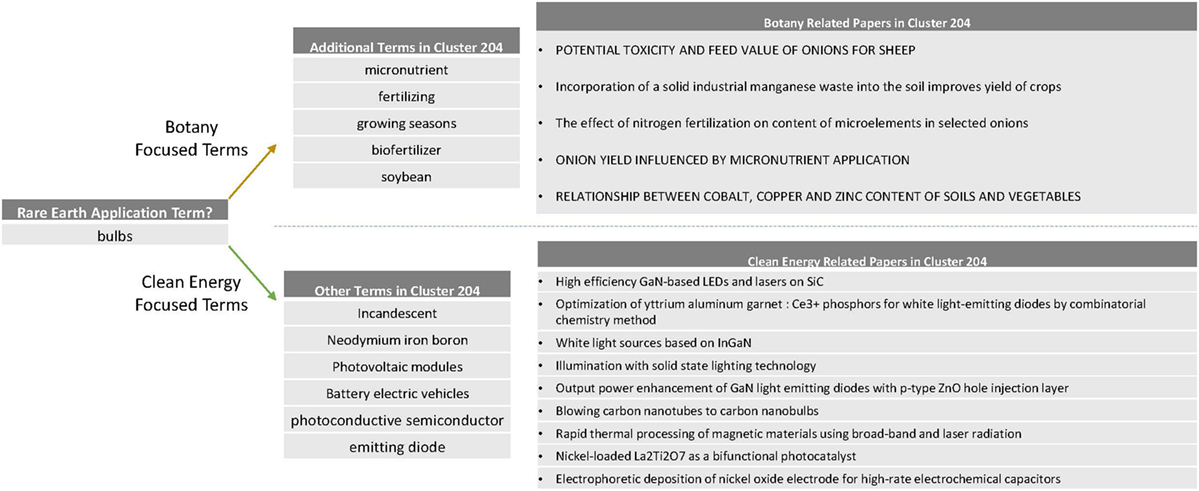
File:Fig5 Kalathil FrontInResMetAnal2018 2.jpg ...s produced two new clusters, as shown above. The new smaller clusters were more focused than the larger cluster.(1,199 × 491 (245 KB)) - 18:23, 22 May 2018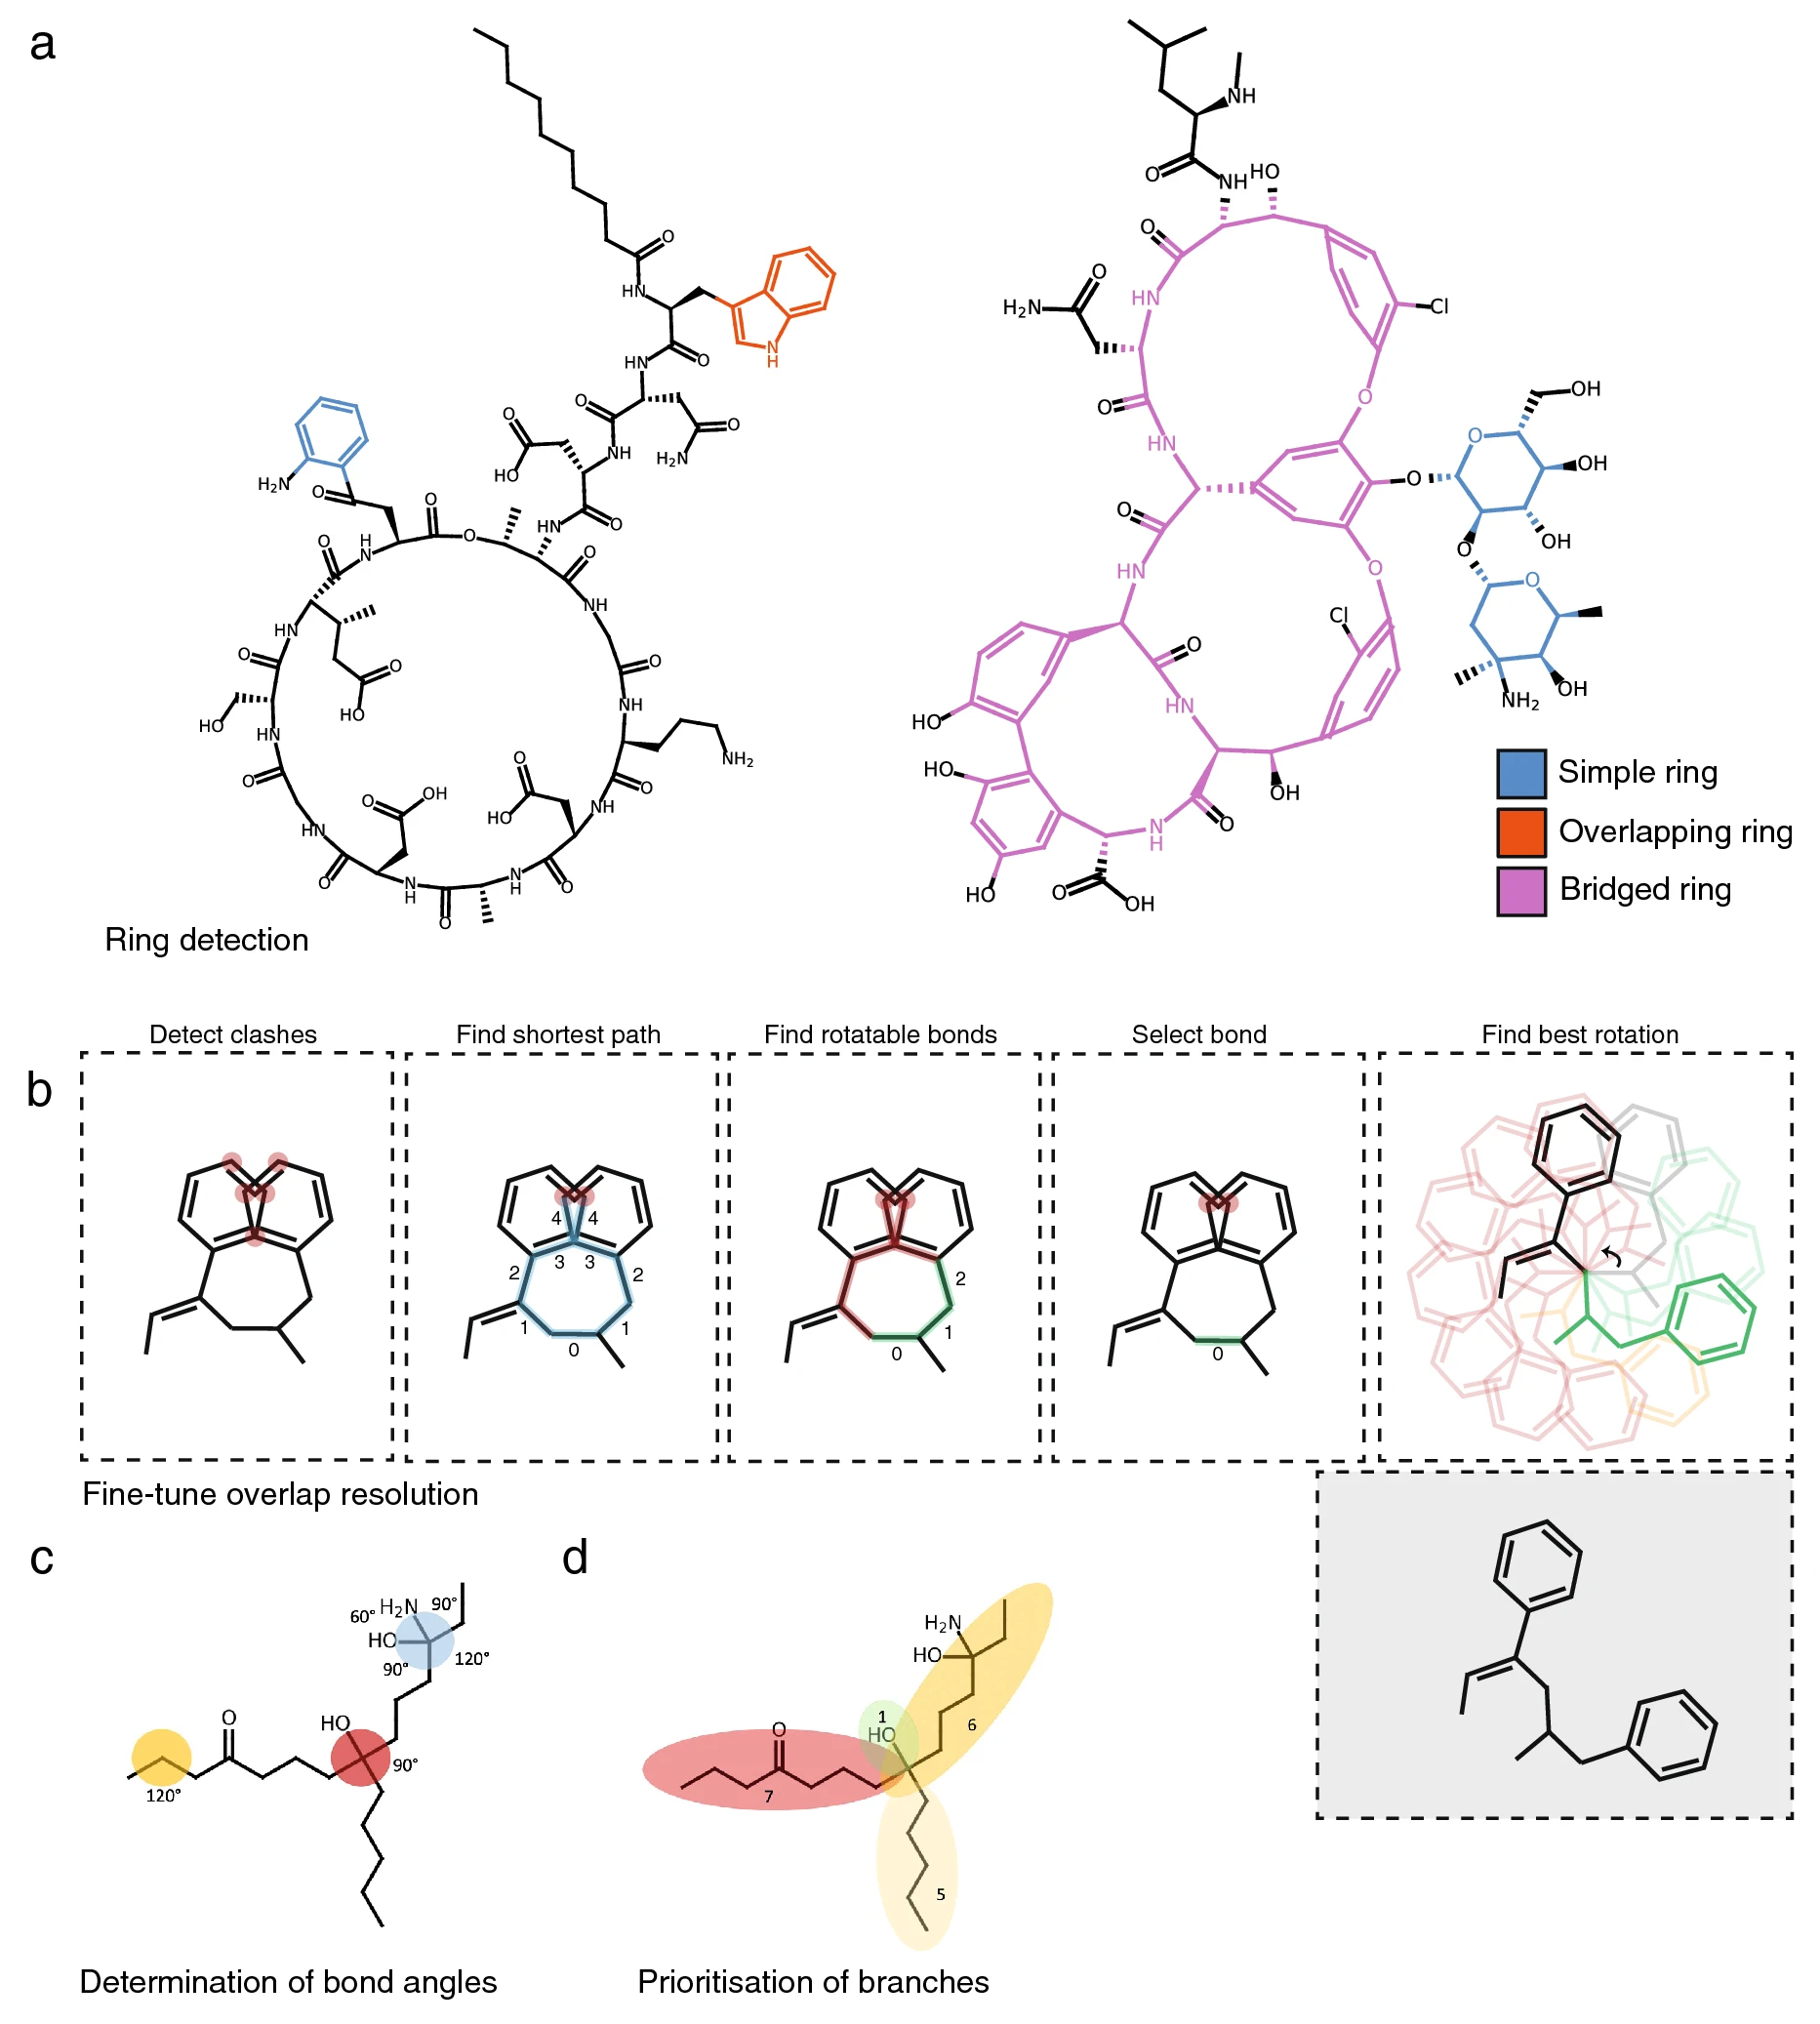
File:Fig2 Terlouw JofCheminfo22 14.png ...hbors, angles default to 90° if three or more of the branches have a depth more than one, or three or four branches have a depth of exactly one (red). If h(1,865 × 2,074 (953 KB)) - 17:07, 23 August 2022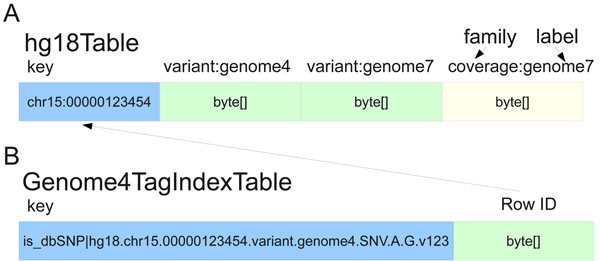
File:Fig1 OConnor BMCInformatics2010 11-12.jpg ...icular column family label (such as “variant:genome7”). For locations with more than one called variant the HBase timestamp is used to distinguish each. (b(600 × 261 (49 KB)) - 18:53, 28 December 2015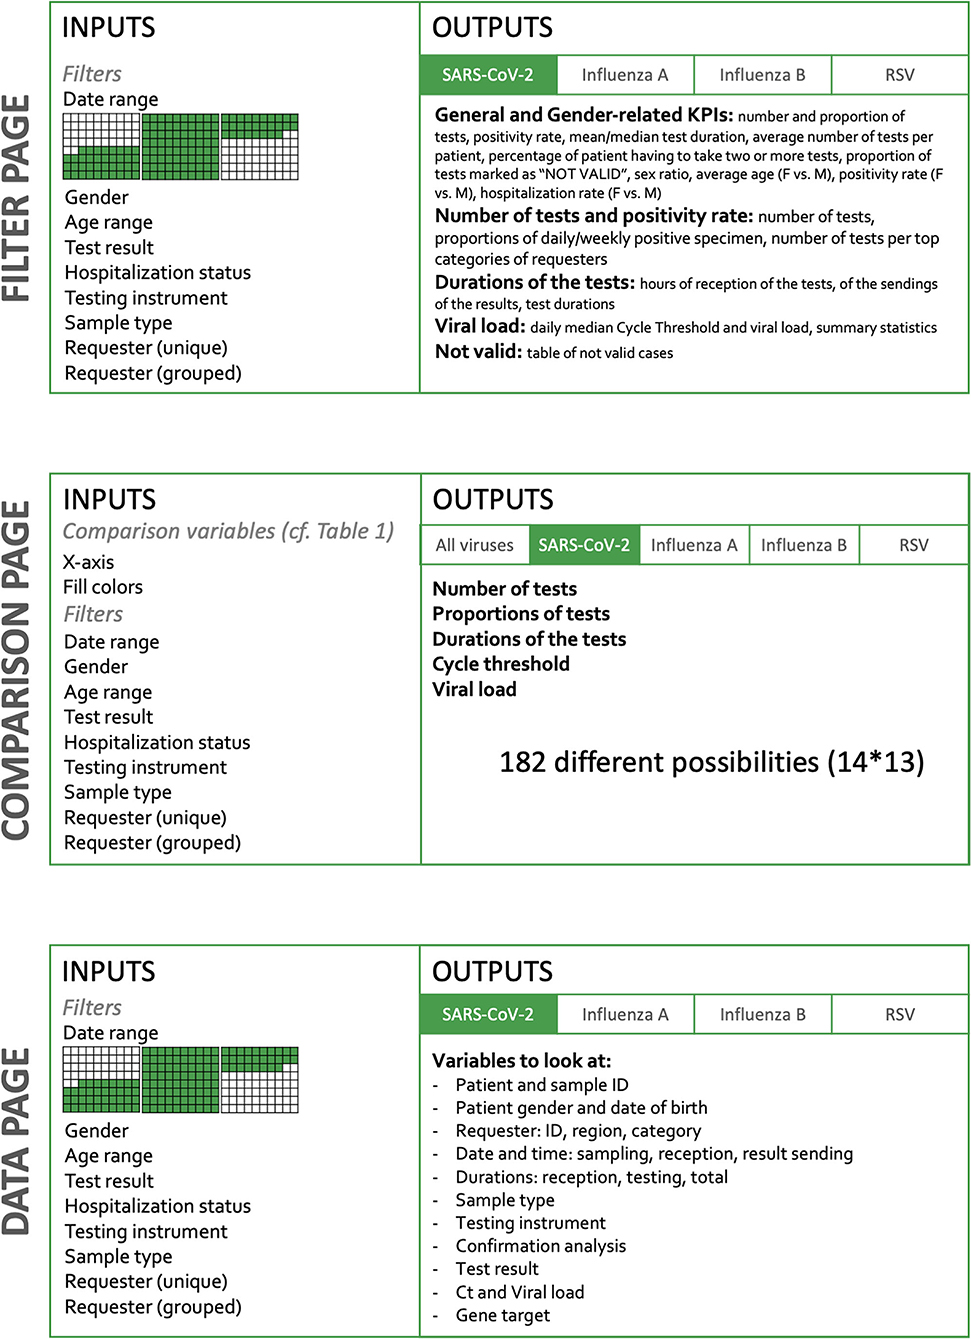
File:Fig1 Maury FrontDigHlth2021 3.jpg ...y the analysis performed for a given requester. The Comparison page offers more than 182 combinations of the KPI. The Data page gives access to the raw dat(971 × 1,339 (555 KB)) - 19:14, 17 February 2022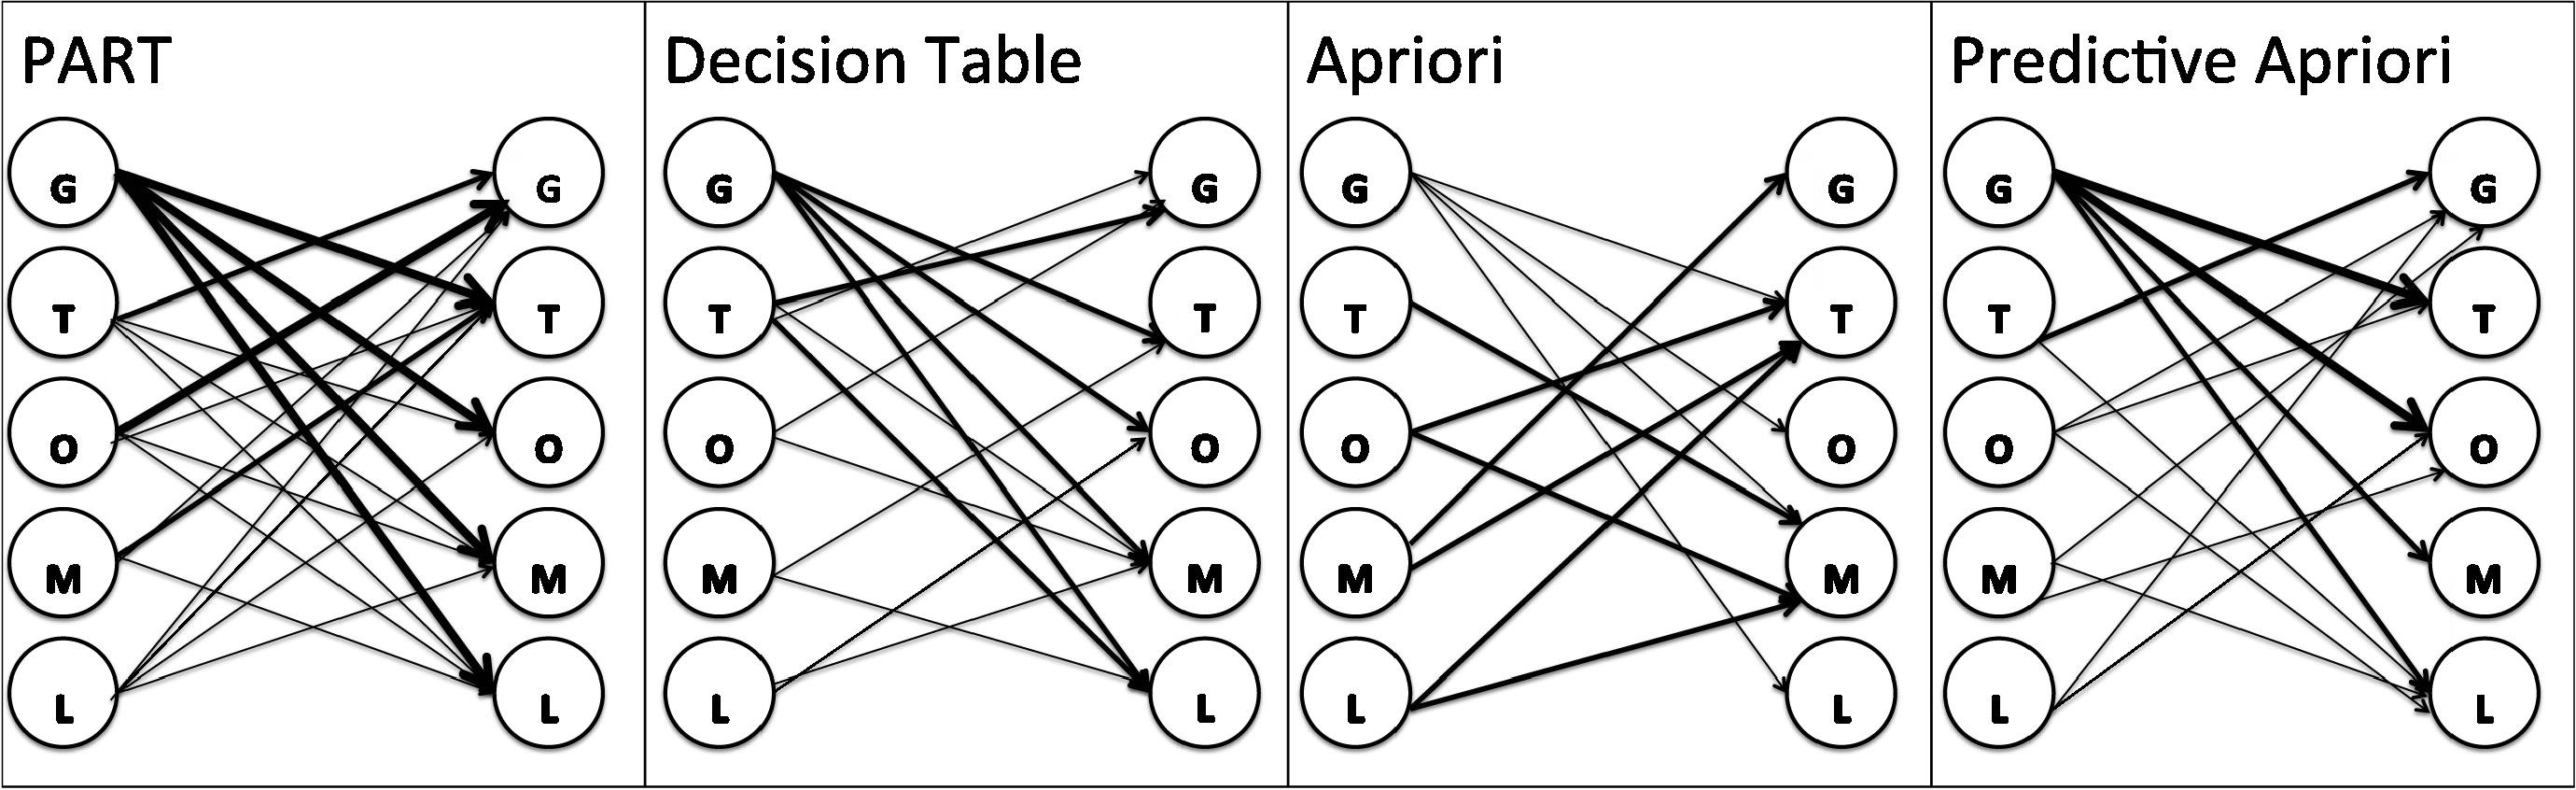
File:Fig5 Panahiazar JofBiomedInformatics2017 72-8.jpg ...rules generated by all algorithms. This association shows which element is more predictable based on other elements. It also reveals the power of each elem(2,760 × 846 (386 KB)) - 15:40, 23 August 2017
File:Fig5 Fairchild FrontPubHealth2018 6.jpg |Source={{cite journal |title=Epidemiological data challenges: Planning for a more robust future through data standards |journal=Frontiers in Public Health |a(963 × 268 (325 KB)) - 21:33, 27 April 2020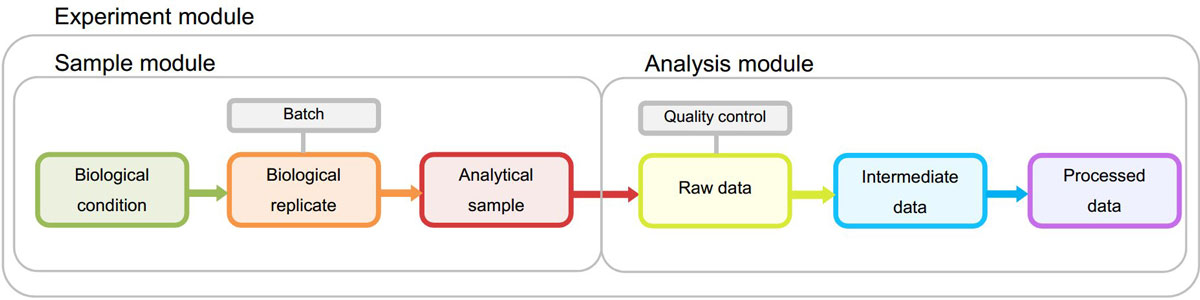
File:Fig2 Hernandez BMCSystemsBiology2014 8-Suppl2.jpg ...raw to processed data. Both samples and analyses are associated to one or more experiments within the Experiment module.(1,200 × 300 (48 KB)) - 23:30, 14 March 2016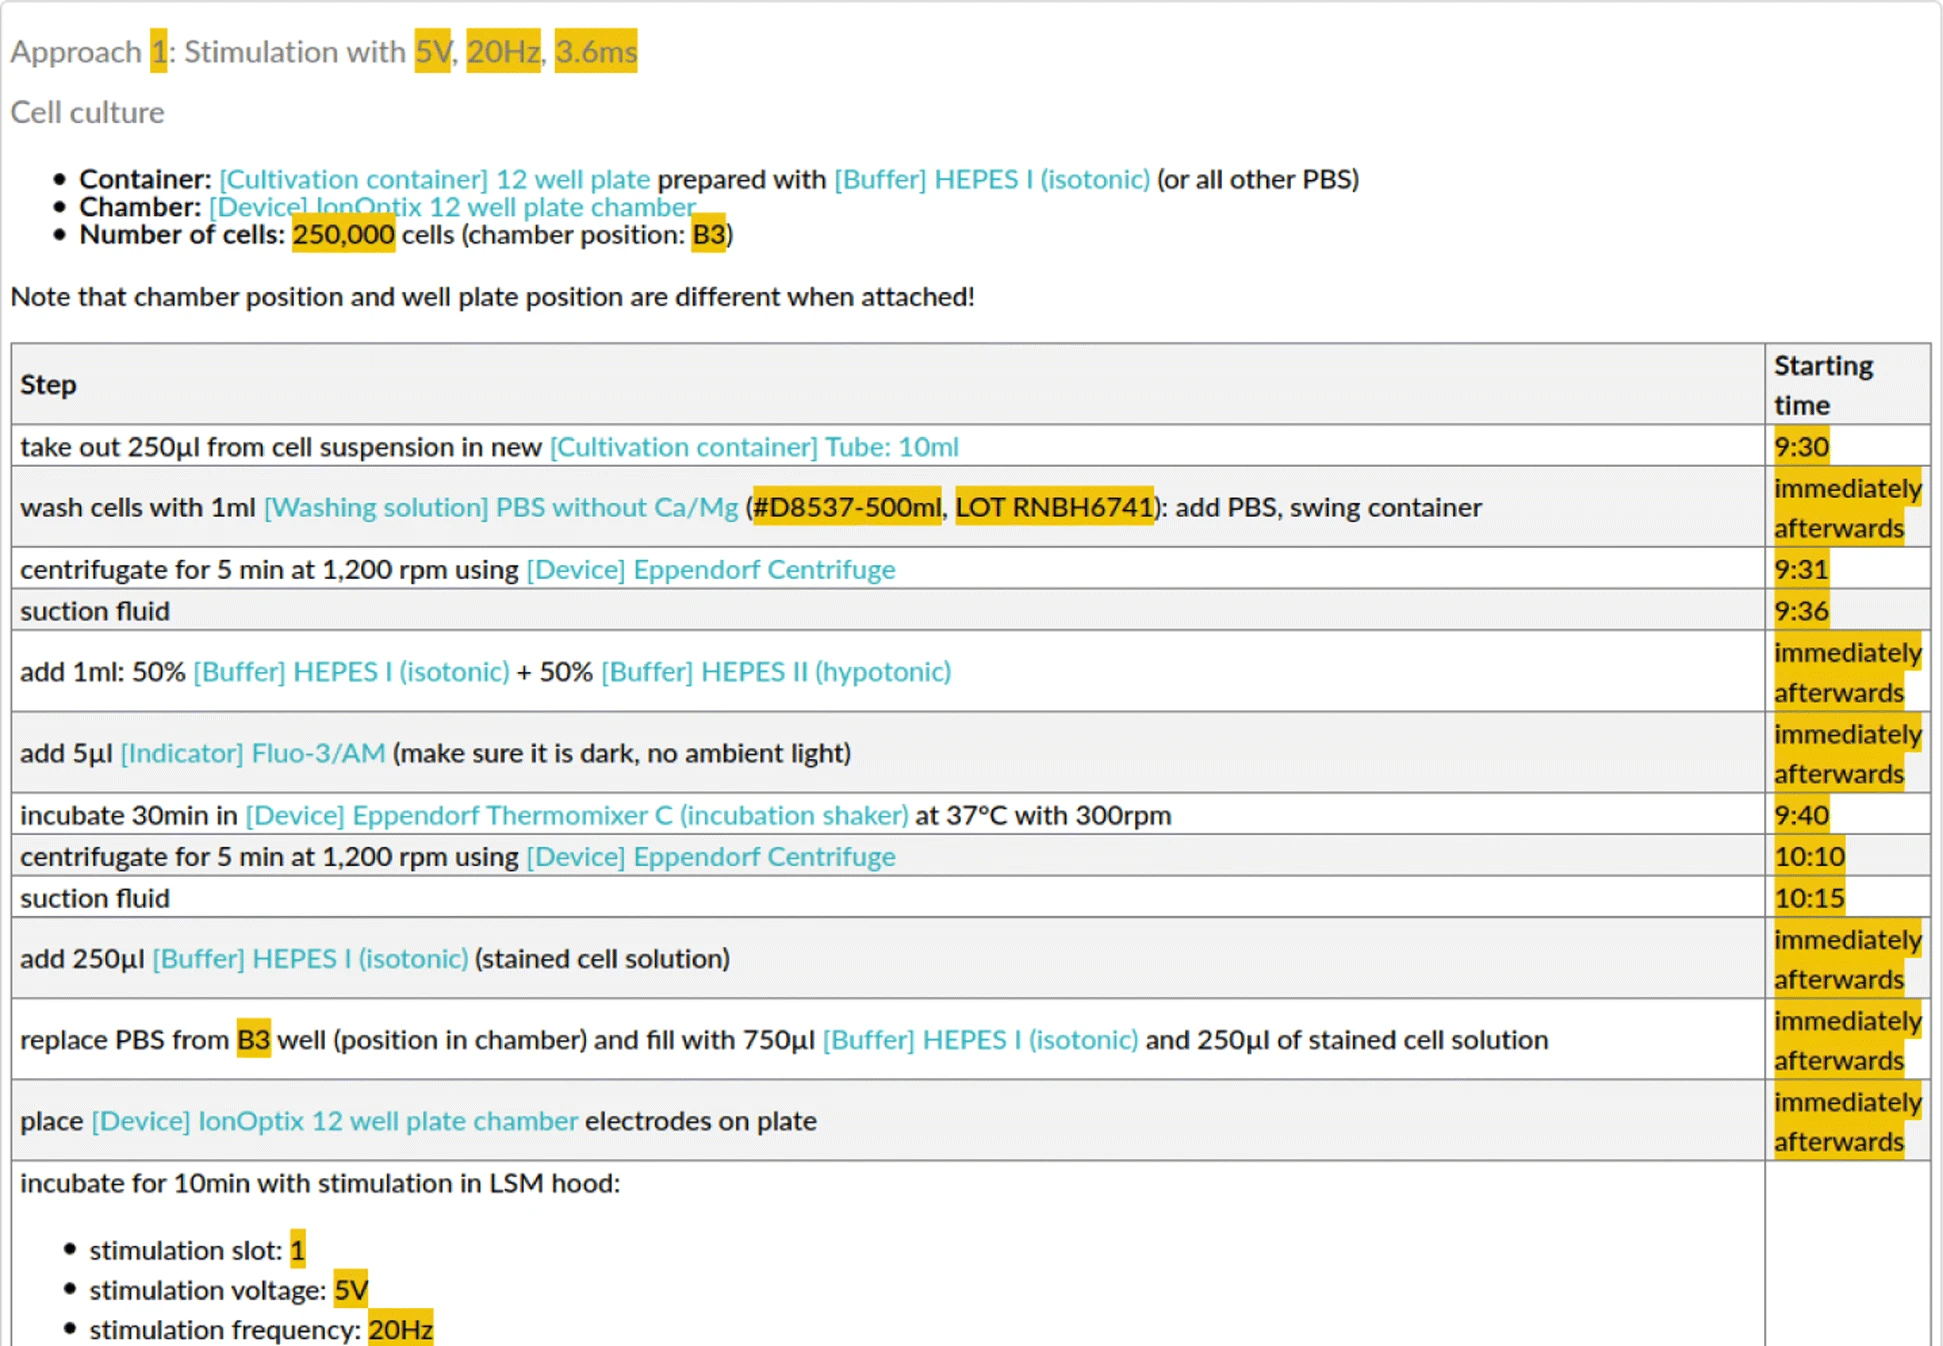
File:Fig4 Schröder JofBioSem22 13.png ...chers during their documentation, but the semantic translation approach is more general.(1,943 × 1,346 (1.64 MB)) - 23:45, 30 March 2022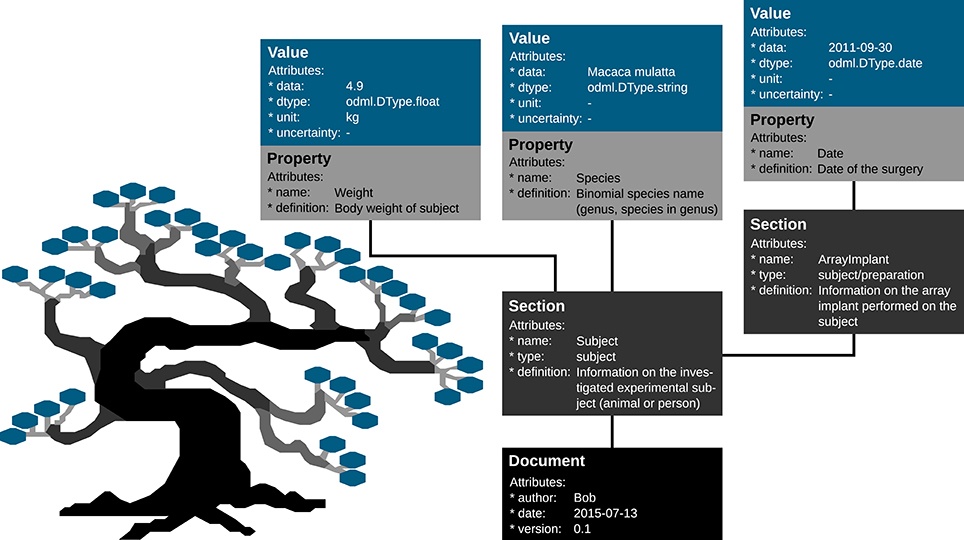
File:Fig5 Zehl FrontInNeuro2016 10.jpg ...given a “name” and a “definition.” If a sub-context needs to be defined in more detail, Sections can also group other Sections together containing the corr(964 × 540 (261 KB)) - 20:26, 21 December 2017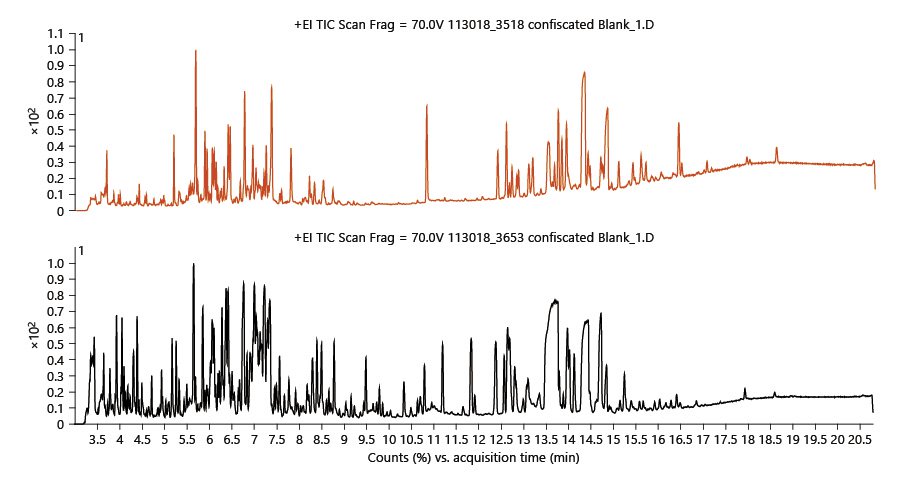
File:Fig1 Wylie MedCannCannab2020 3-1.jpg |Source={{cite journal |title=Screening for more than 1,000 pesticides and environmental contaminants in cannabis by GC/Q-TO(900 × 485 (57 KB)) - 22:46, 20 December 2023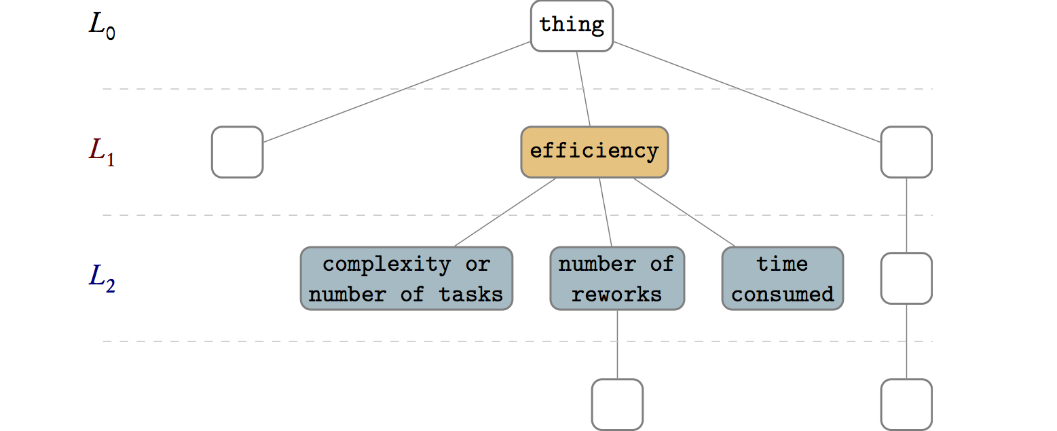
File:Fig3 Eivazzadeh JMIRMedInformatics2016 4-2.png |Description='''Fig. 3''' More details can be evaluated by looking at deeper nodes in the ontology structu(1,057 × 431 (45 KB)) - 21:29, 20 June 2016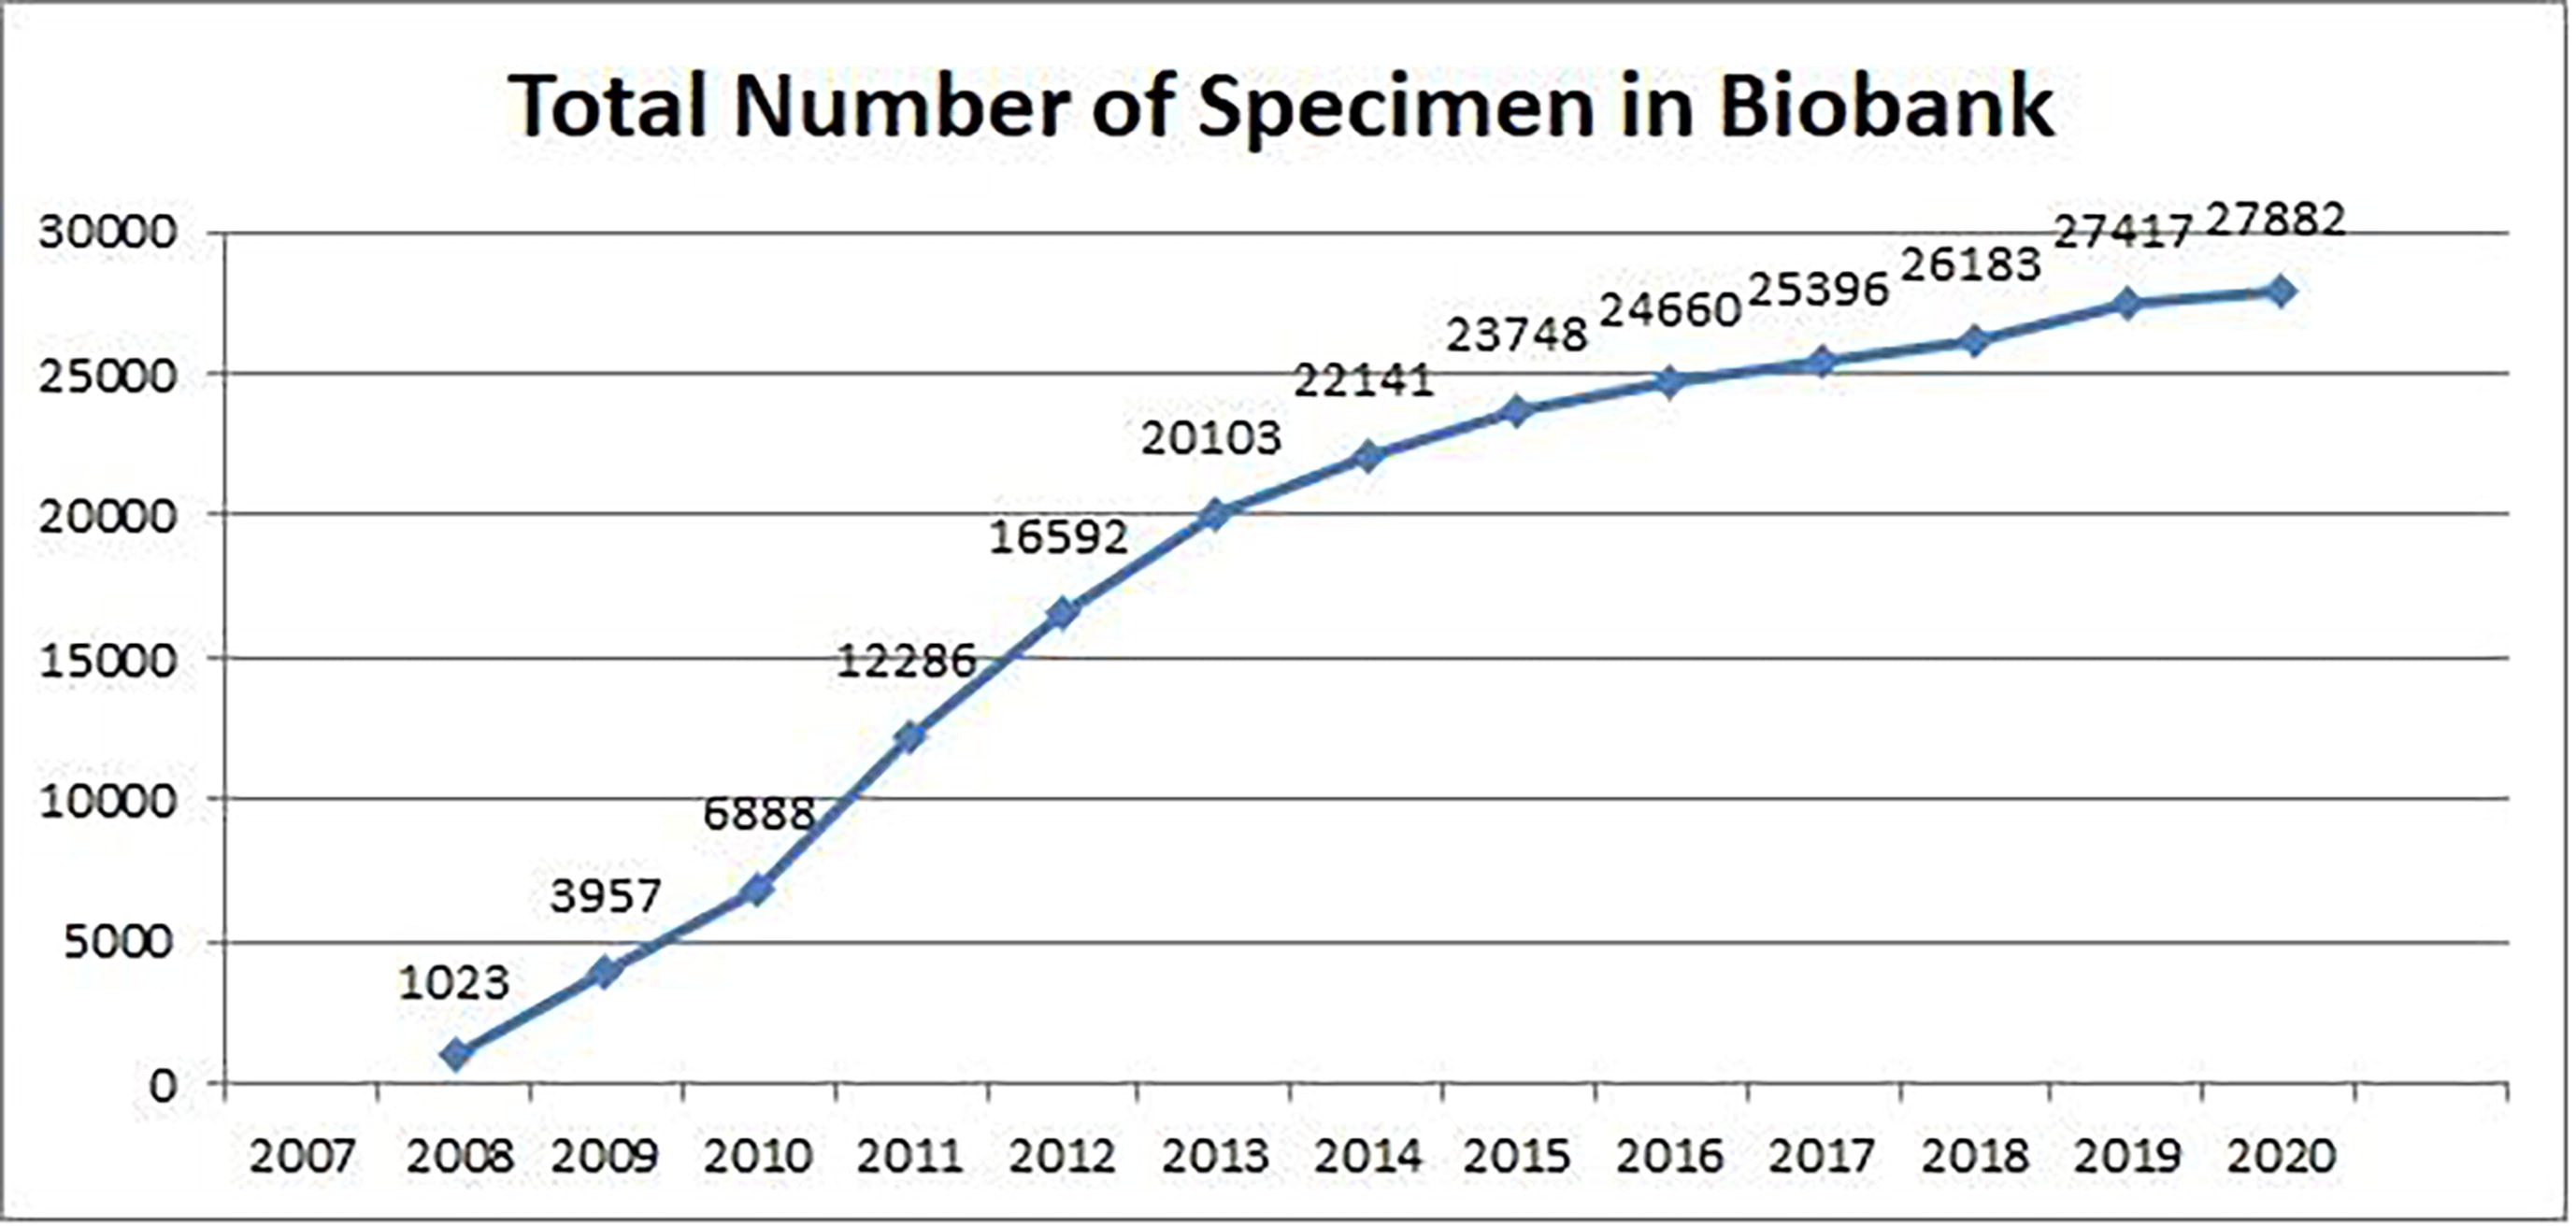
File:Fig1 Karim JofKSUScience2022 34-2.jpg ...ph showing progressive growth of specimen/derivatives from zero in 2007 to more than 27,000 by 2020.(2,756 × 1,312 (235 KB)) - 20:07, 4 July 2022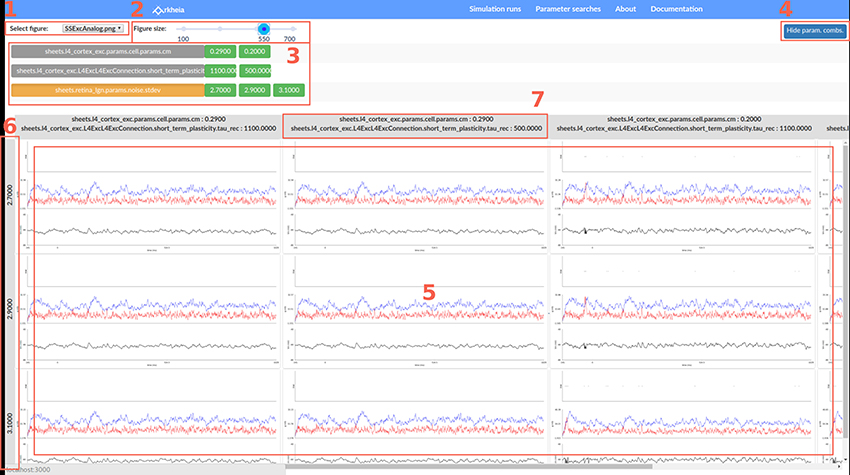
File:Fig6 Antolik FrontInNeuro2018 12.jpg ...re only partial views of the data. The panel '''3''' can be hidden to gain more screen space for the figure grid by clicking button '''(4)'''. The bottom,(850 × 475 (297 KB)) - 19:03, 3 April 2018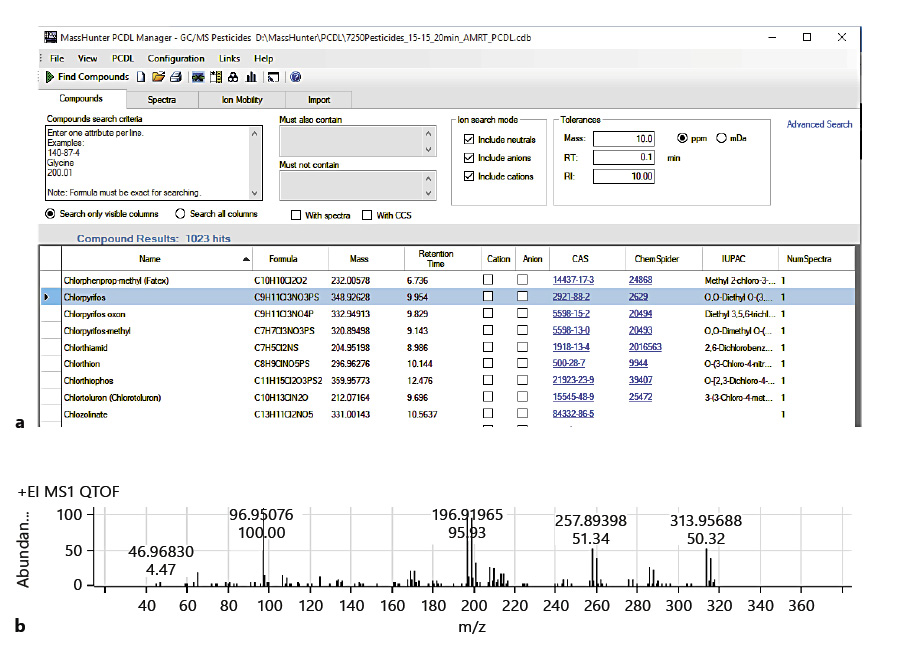
File:Fig2 Wylie MedCannCannab2020 3-1.jpg |Source={{cite journal |title=Screening for more than 1,000 pesticides and environmental contaminants in cannabis by GC/Q-TO(897 × 666 (195 KB)) - 22:47, 20 December 2023
File:Fig4 Hatakeyama BMCBioinformatics2016 17.gif ...nctional Genomics Center Zurich. It has been increasing since 2013 and now more than 5000 jobs are submitted on SUSHI at the Functional Genomics Center Zur(472 × 287 (31 KB)) - 16:48, 6 July 2016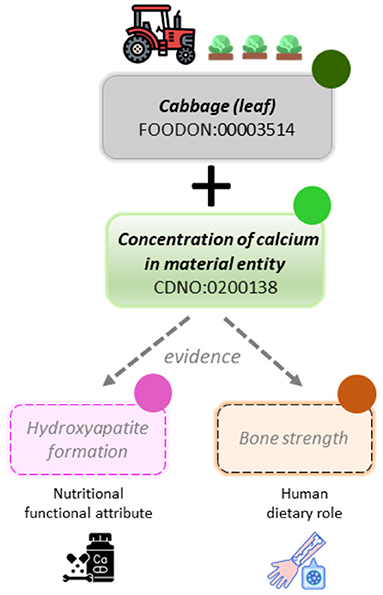
File:Fig2 Andrés-Hernández FrontNut2022 9.jpg ...ircle) will then be available to represent concepts associated with one or more nutritional components, where a domain specialist has identified sufficient(383 × 595 (119 KB)) - 18:34, 17 September 2022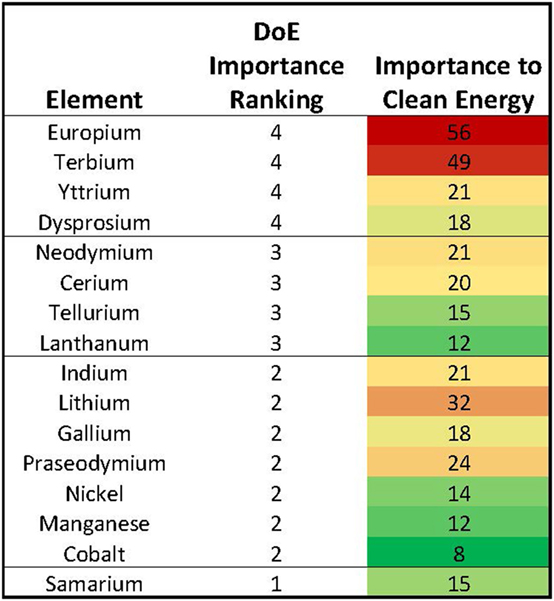
File:Fig8 Kalathil FrontInResMetAnal2018 2.jpg ....''' The importance rankings as determined by SRI methodology. Red denotes more important, while green denotes less important. Results from the clustering(554 × 601 (164 KB)) - 19:11, 22 May 2018


