Search results
From LIMSWiki
Jump to navigationJump to search
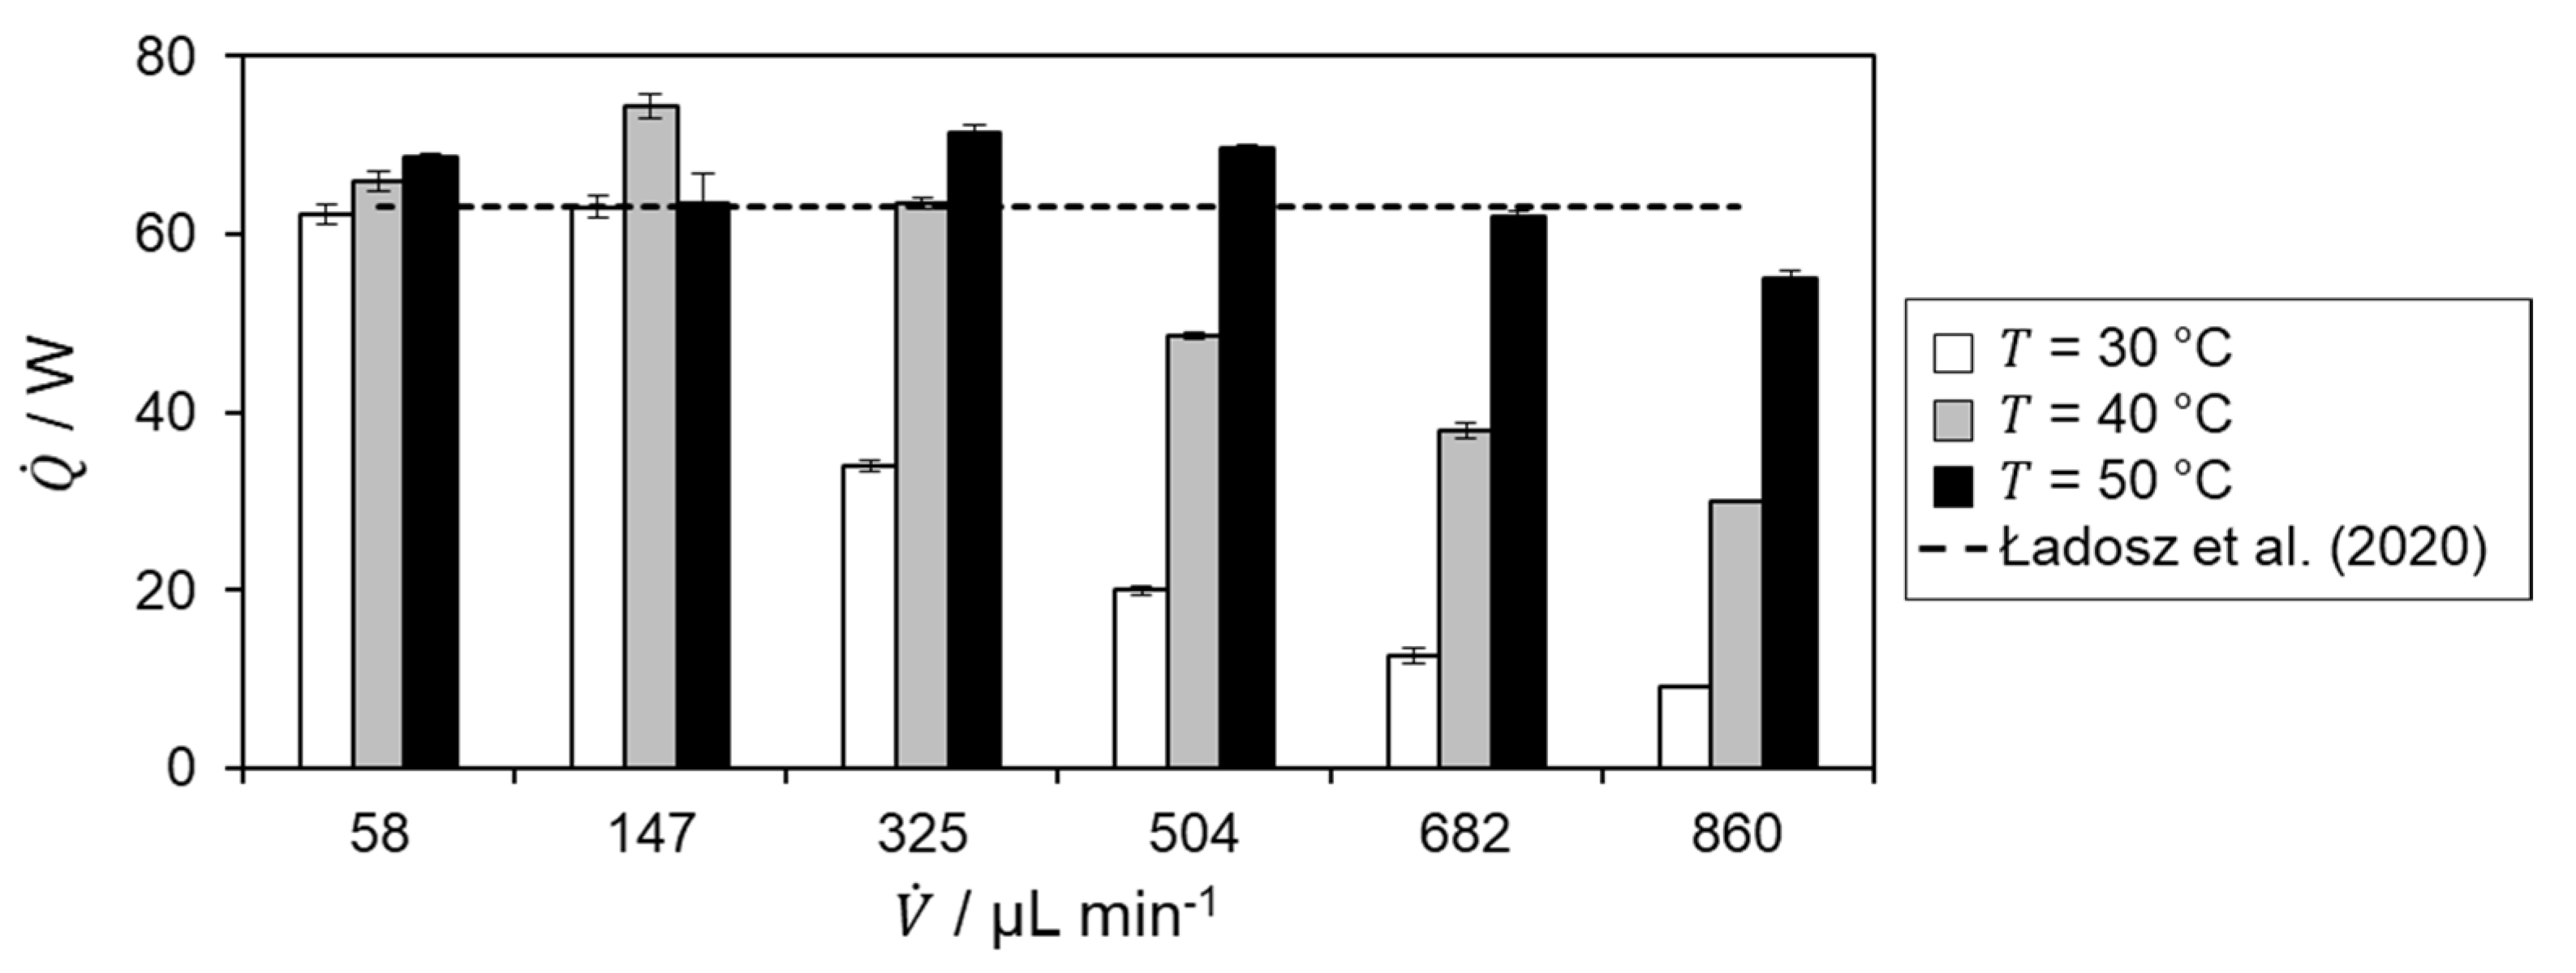
File:Fig8 Frede Processes23 11-1.png ...with literature value by Ładosz ''et al.'', which is indicated by a dashed black line.(3,175 × 1,199 (340 KB)) - 21:15, 19 April 2023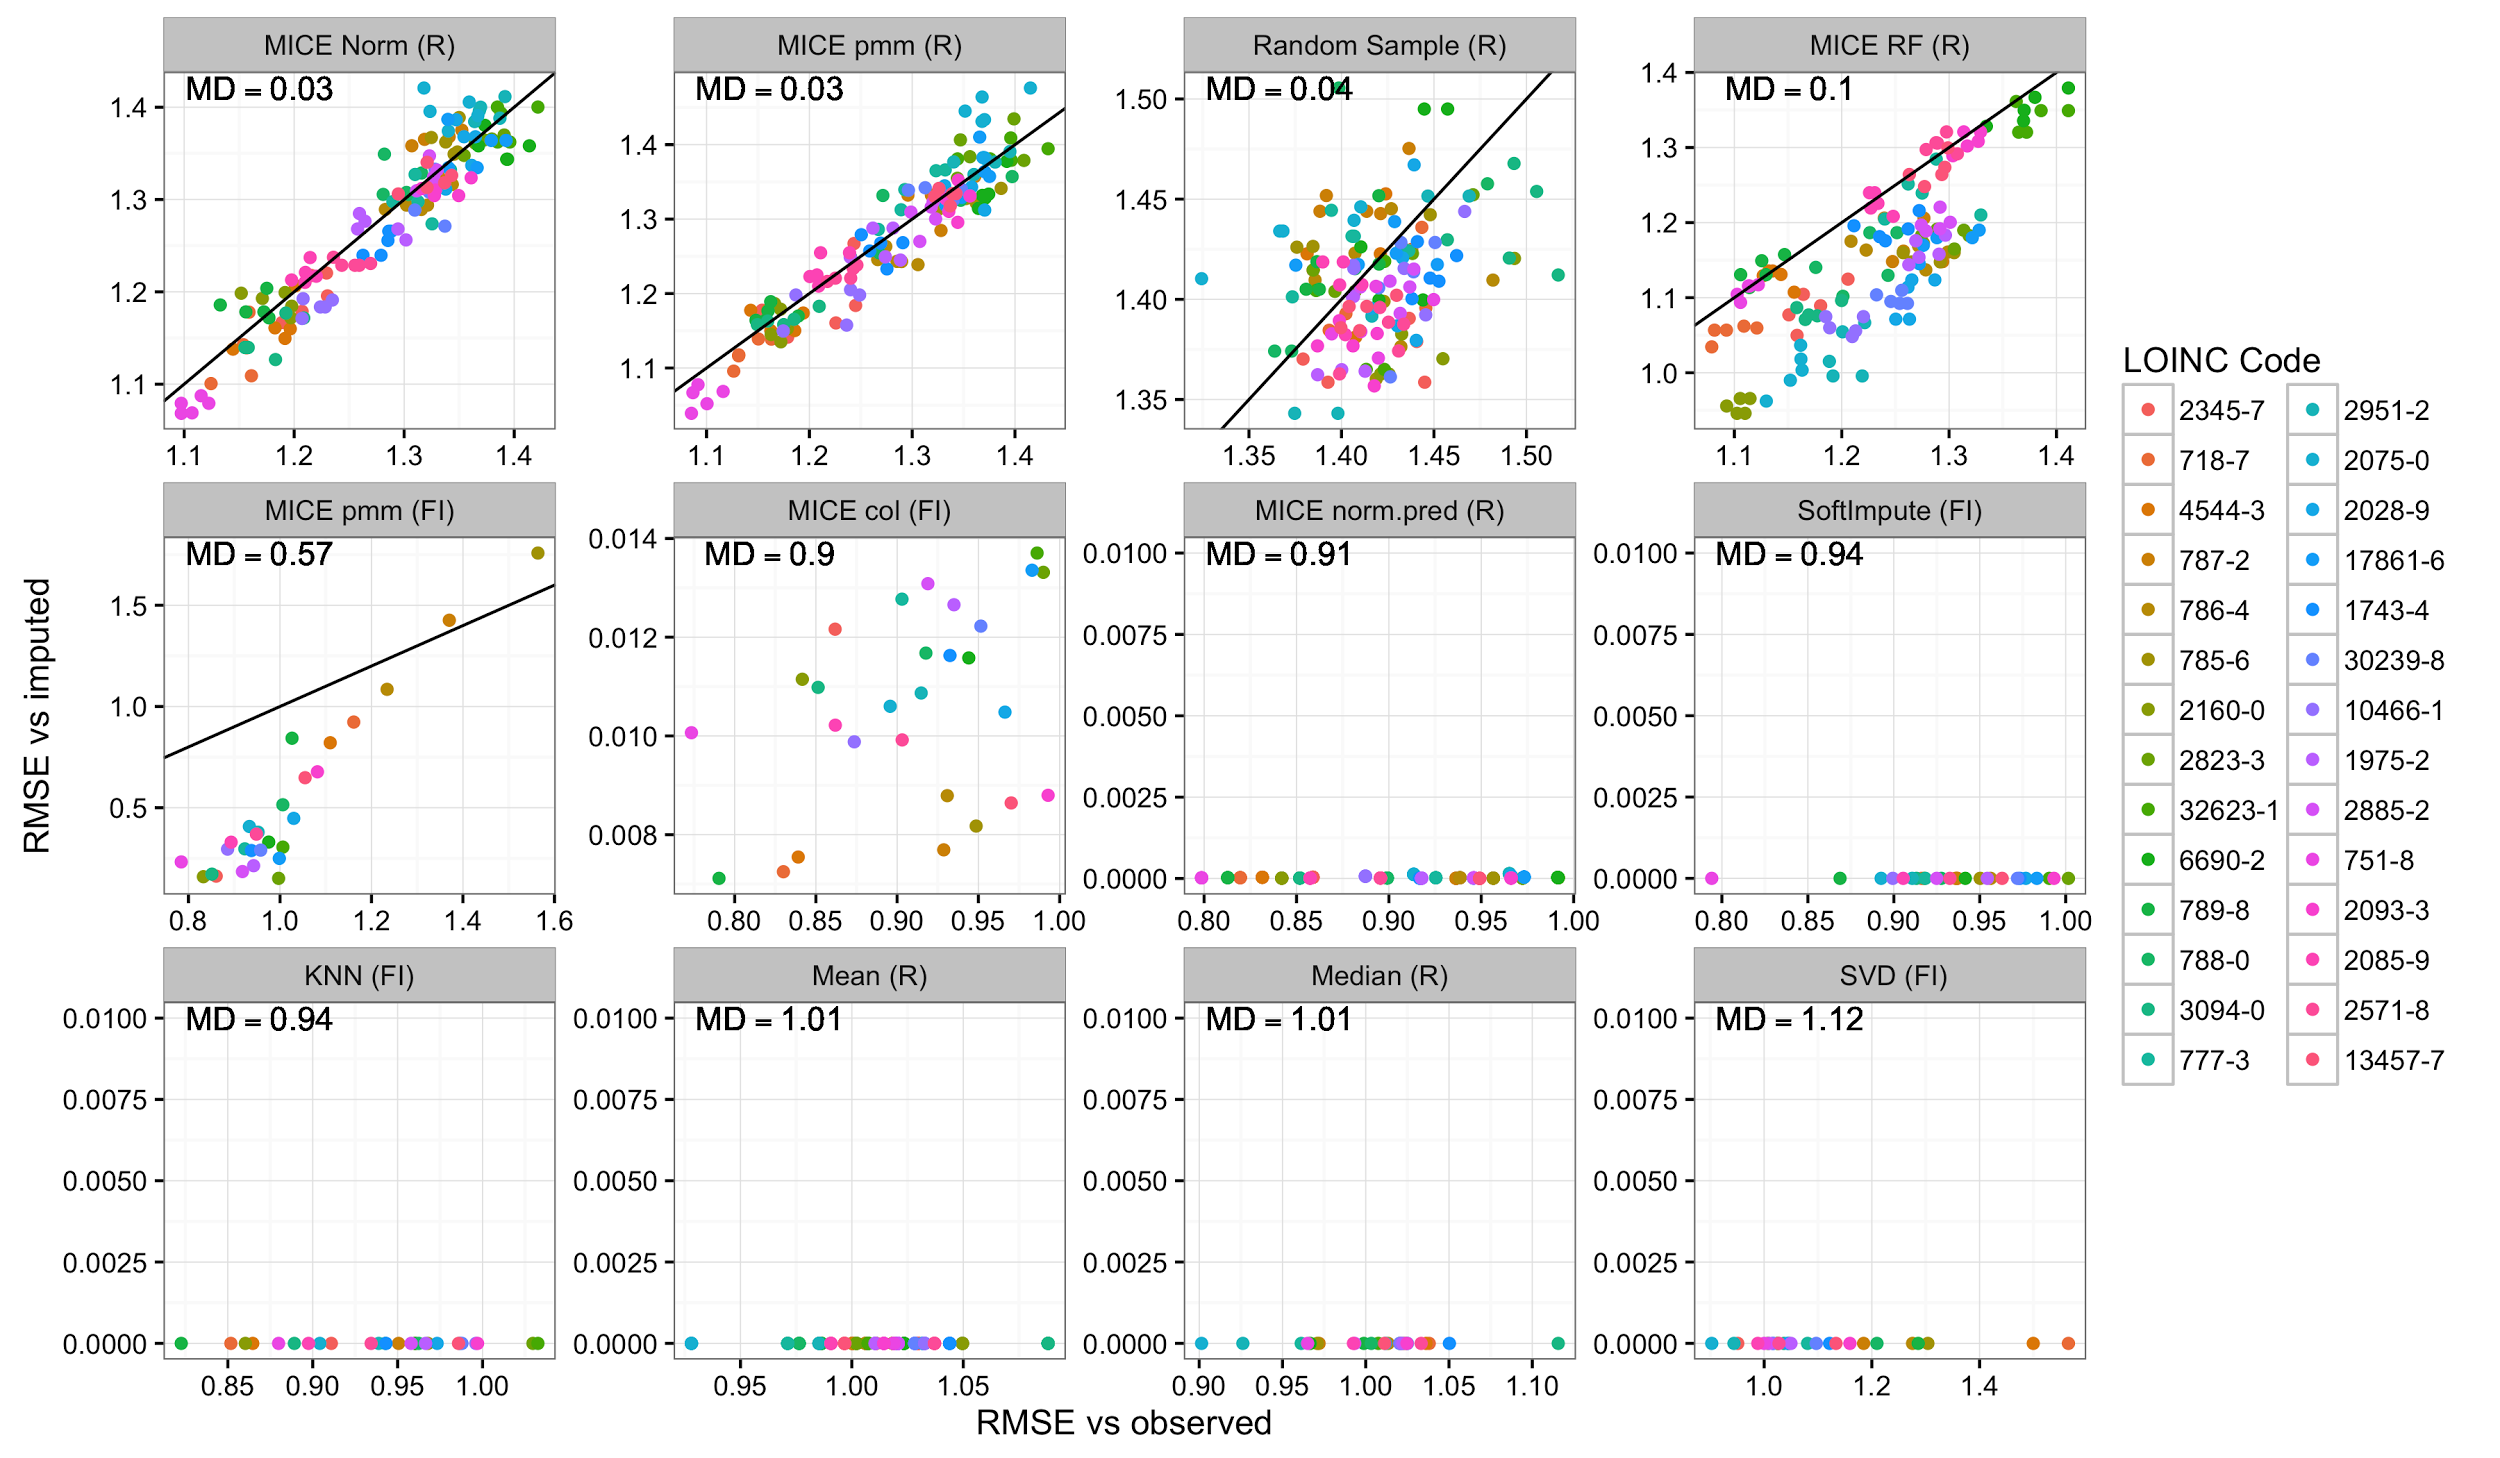
File:Fig6 Beaulieu-JonesJMIRMedInfo2018 6-1.png ...iation. The laboratory tests are indicated by the color of the points. The black diagonal line represents unity (y=x). Panels are ordered by each method’s(2,500 × 1,458 (674 KB)) - 20:49, 6 March 2018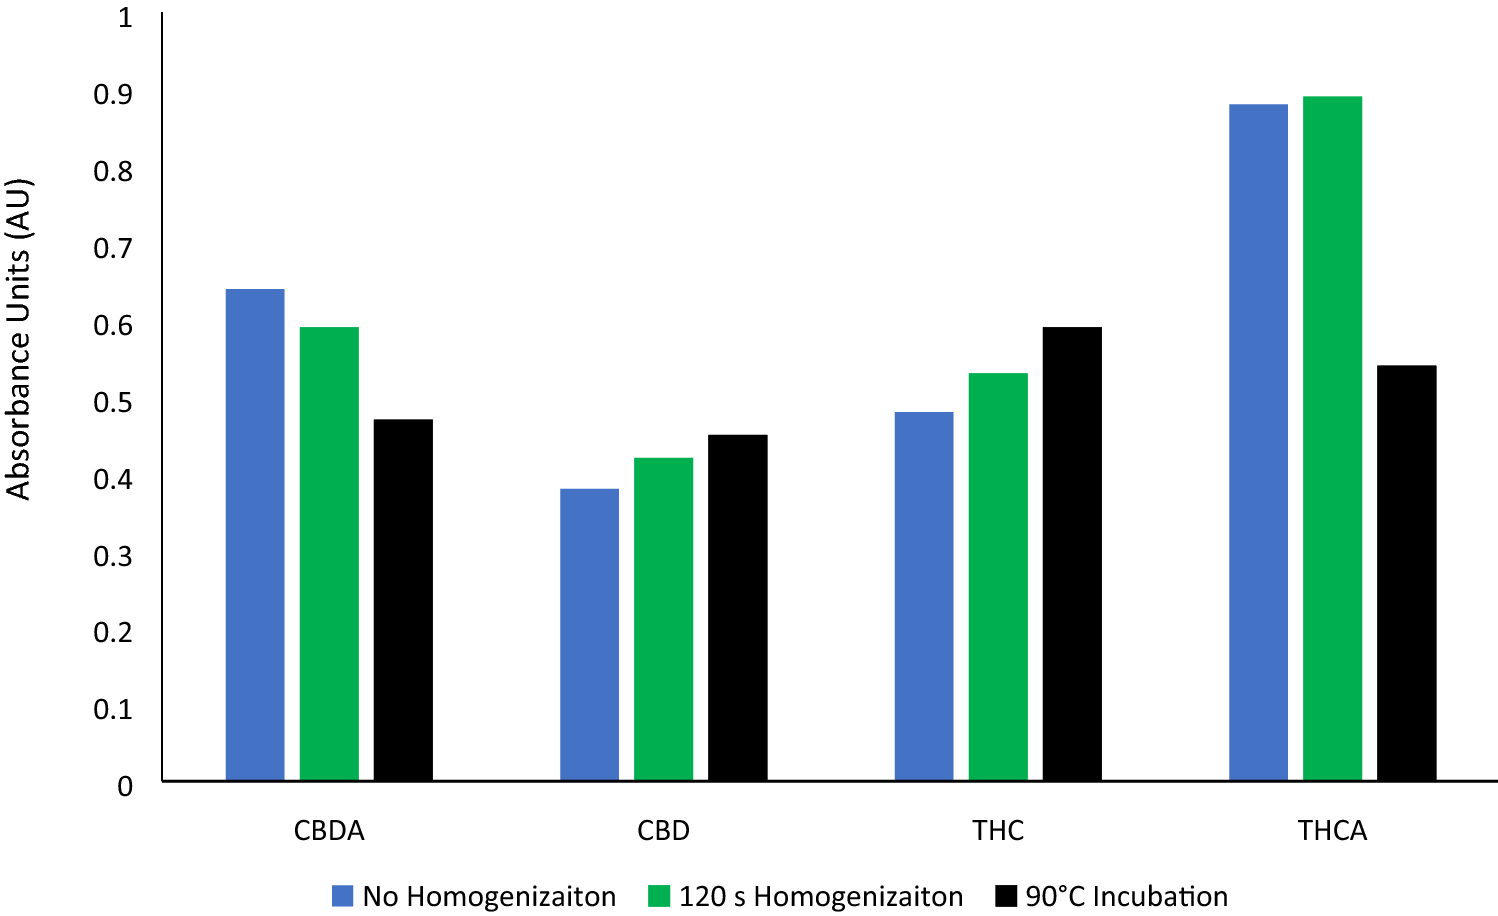
File:Fig1 Morehouse SNApplSci2021 3.png ...bance units following hemp homogenization (green), 90 C heating of sample (black), and no sample preparation (blue)(1,498 × 916 (33 KB)) - 21:15, 26 December 2023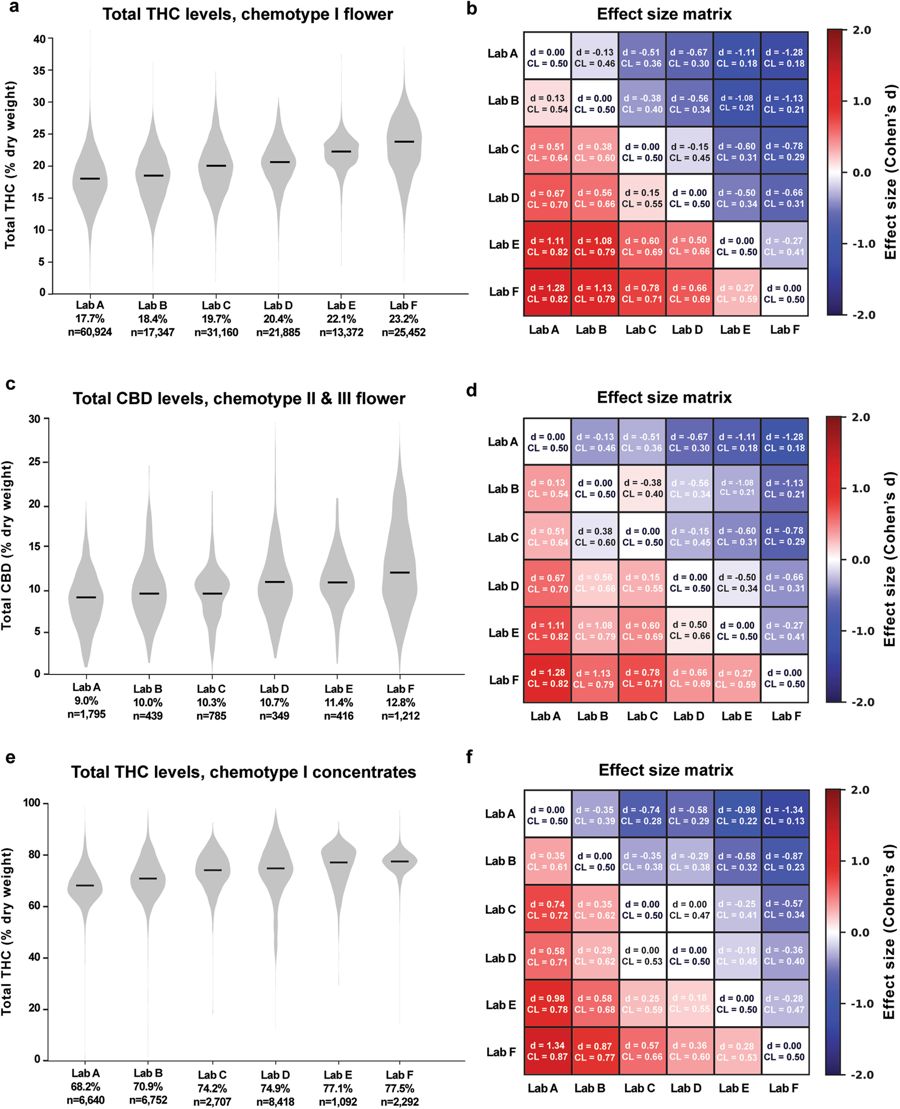
File:Fig2 Jikomes SciReports2018 8.jpg ...plots showing the distribution of total THC or CBD levels across labs A-F. Black lines denote median values, which are printed below the x-axis for each lab(900 × 1,109 (146 KB)) - 22:47, 20 December 2023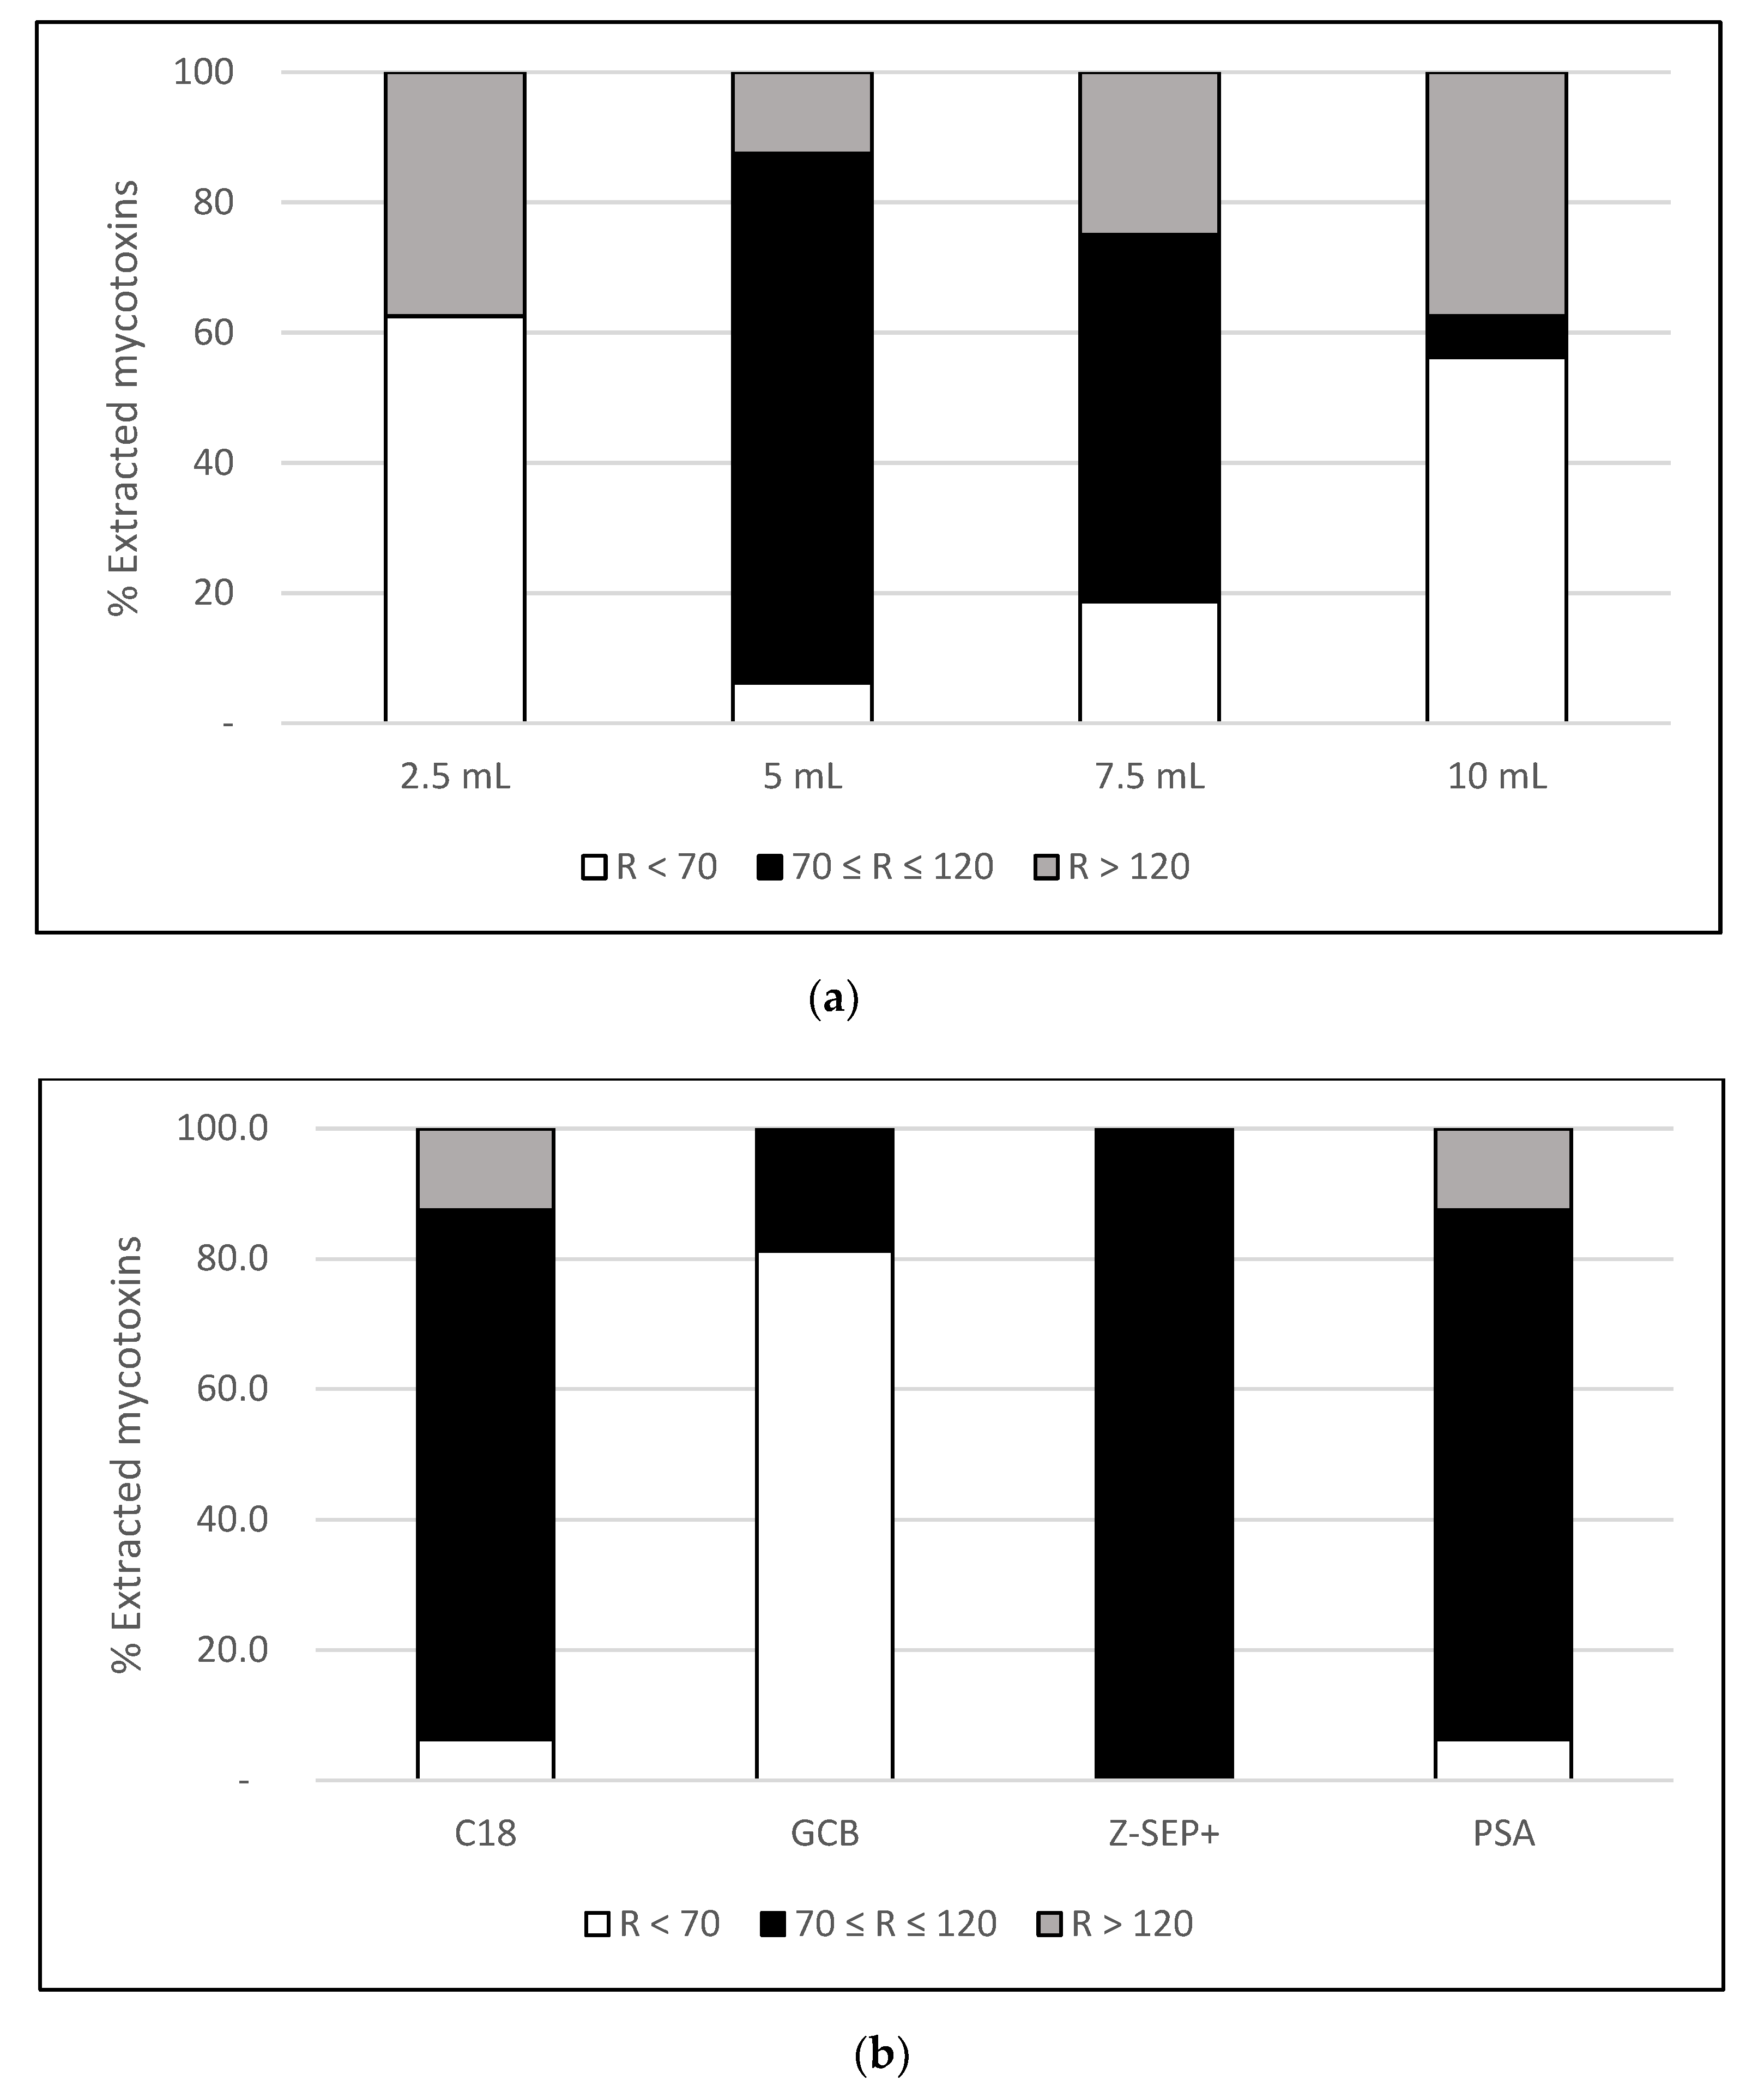
File:Fig1 Narváez Toxins2020 12-2.png ...tracted with a recovery value (R) below 70% (white), between 70% and 120% (black) and above 120% (grey), corresponding to extractions performed with: ('''a'(3,236 × 3,826 (74 KB)) - 22:46, 20 December 2023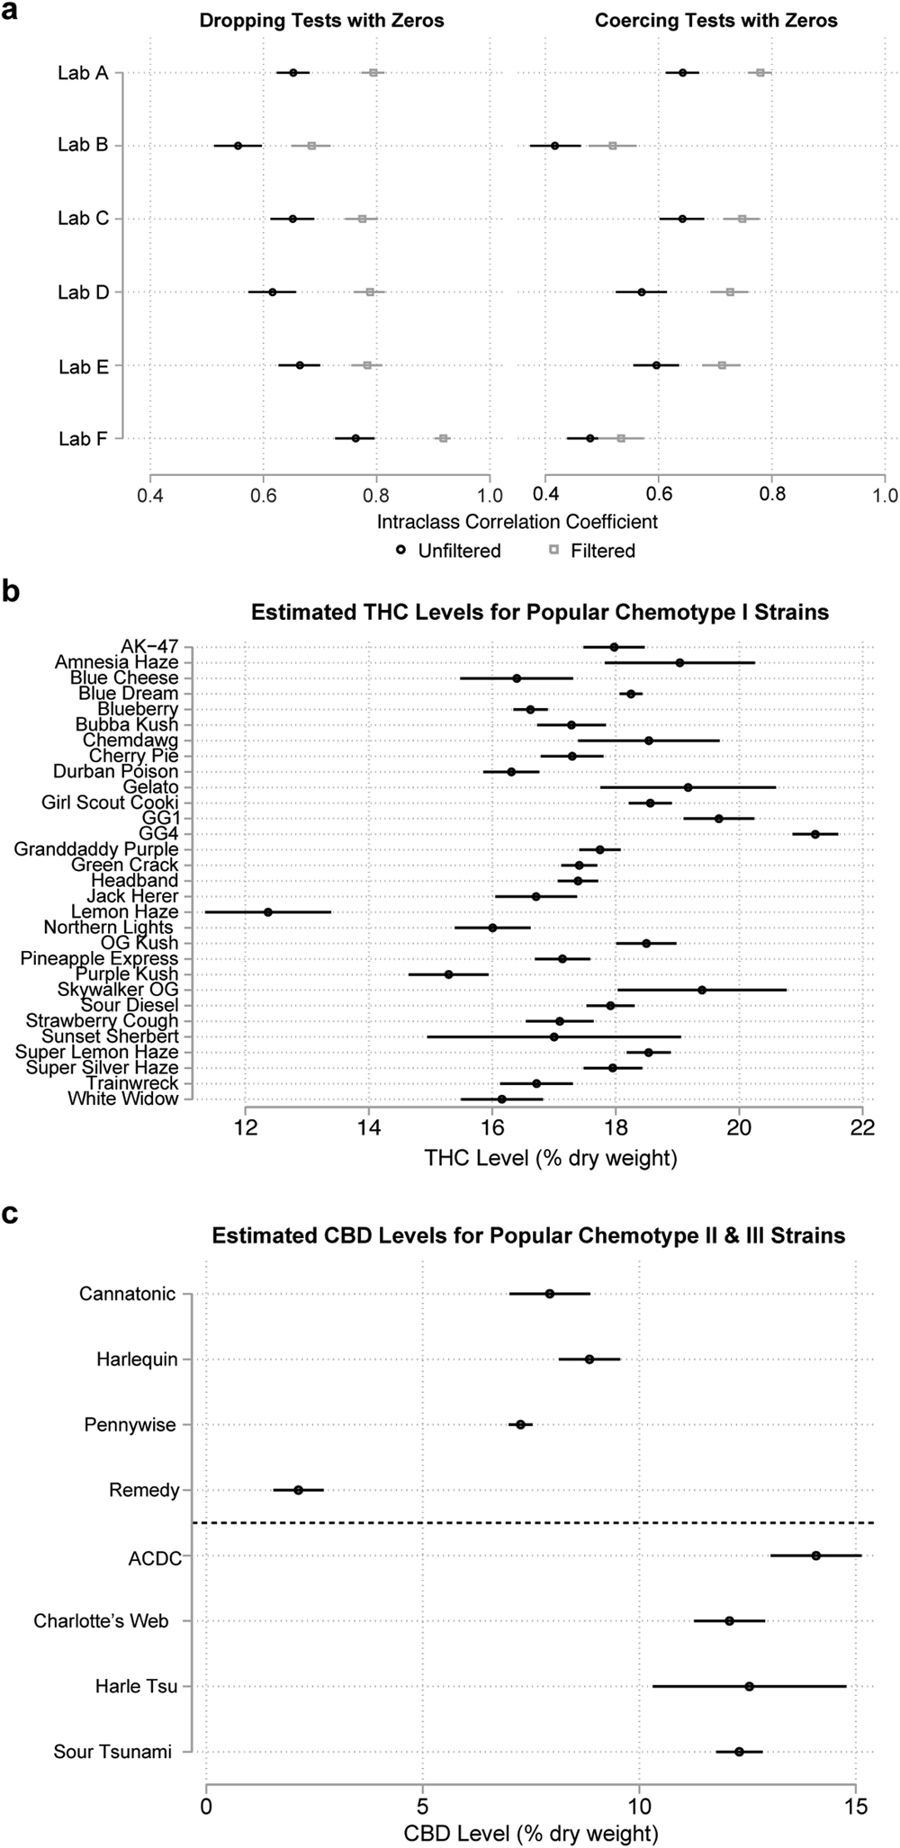
File:Fig8 Jikomes SciReports2018 8.jpg ...s (Intraclass Correlation Coefficient). 99% CIs are shown, by lab, before (black circles) and after (gray squares) filtering test results by the modal chemo(900 × 1,848 (160 KB)) - 22:48, 20 December 2023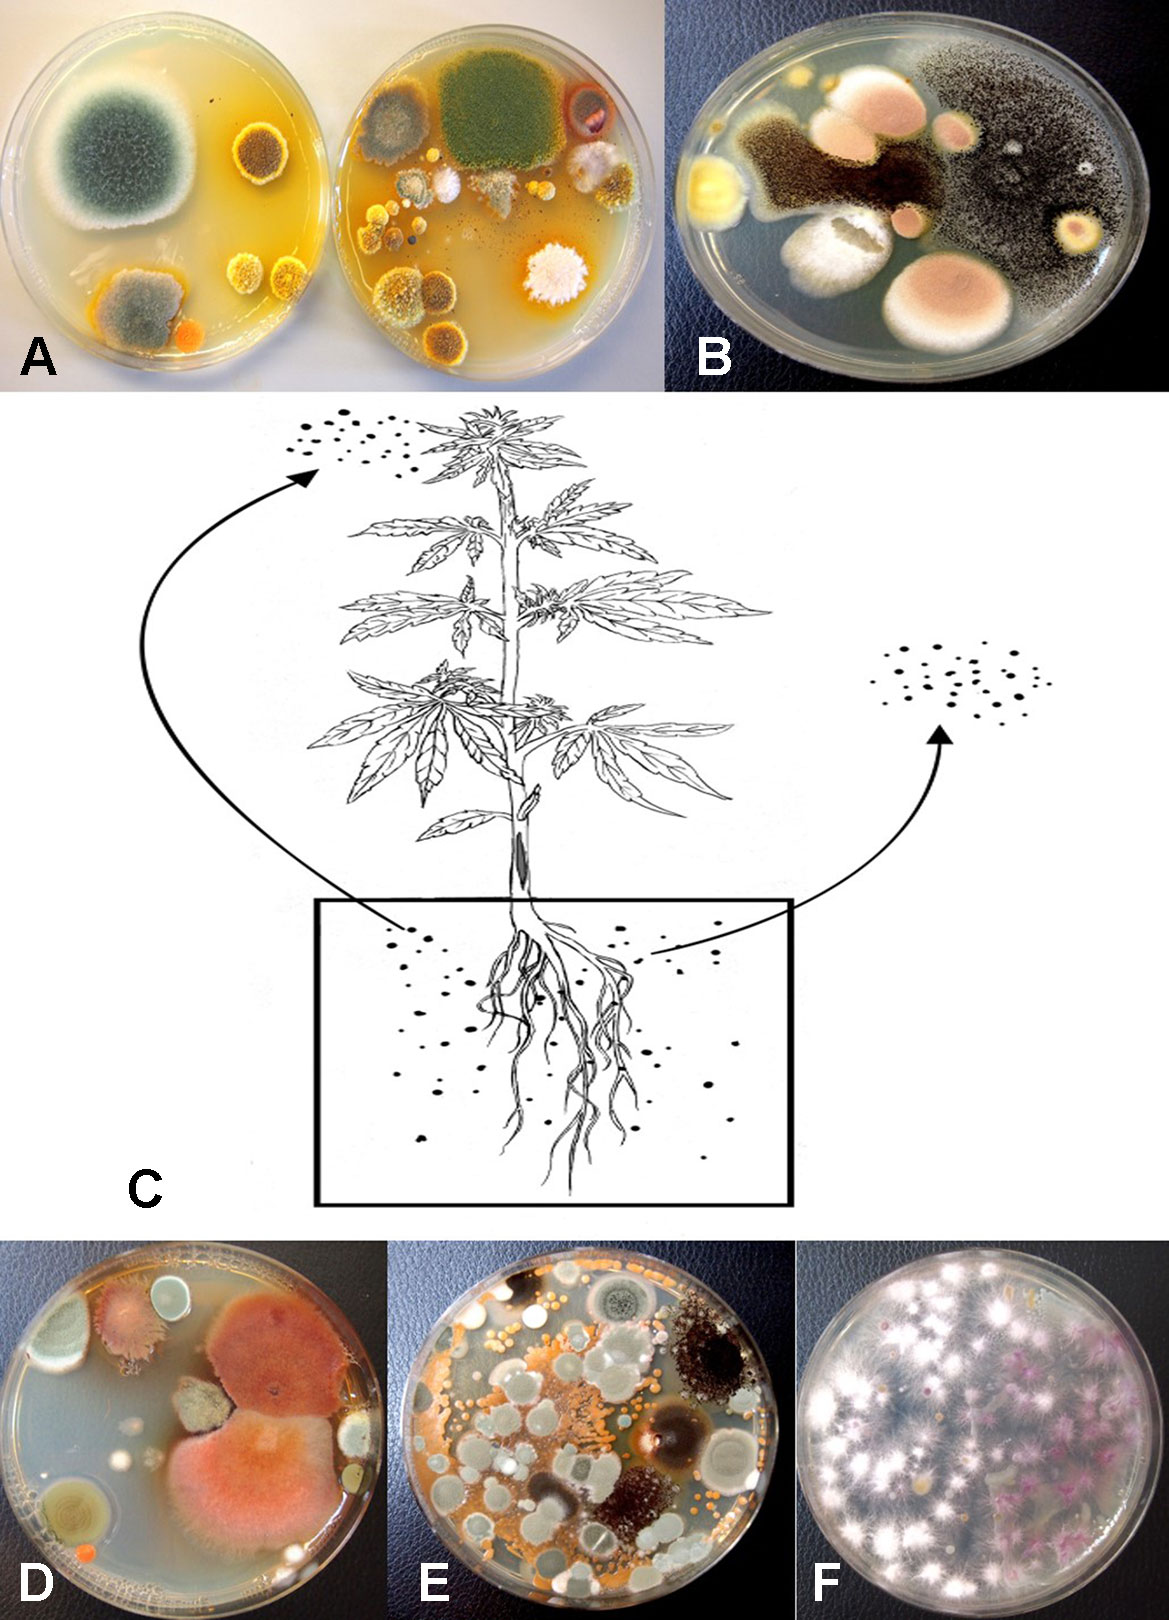
File:Fig10 Punja FrontPlantSci2019 10.jpg ...re recovered from unused coco bags. (B) Colonies of ''Aspergillus niger'' (black) and ''Aspergillus terreus'' (pink) present in coco samples. (C) Proposed s(1,169 × 1,620 (294 KB)) - 21:23, 26 December 2023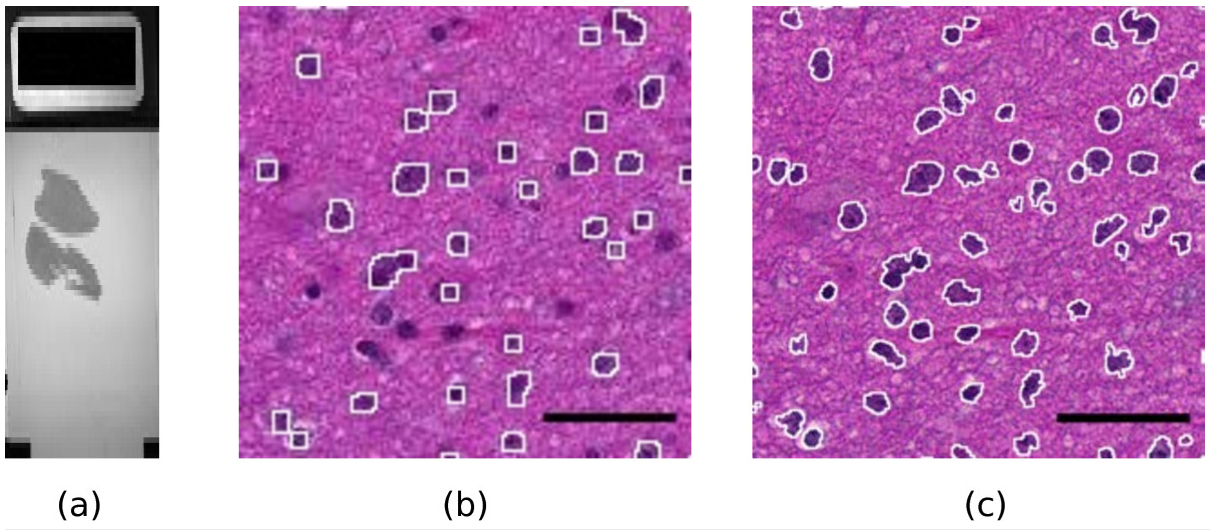
File:Fig1 Deroulers DiagnosticPath2013 8.jpg ...Figure 1. A sample slide. (a)''': macroscopic view of the whole slide (the black rectangle on the left is 1x2 cm). '''(b,c)''': Influence of the magnificati(1,210 × 530 (404 KB)) - 21:58, 26 September 2015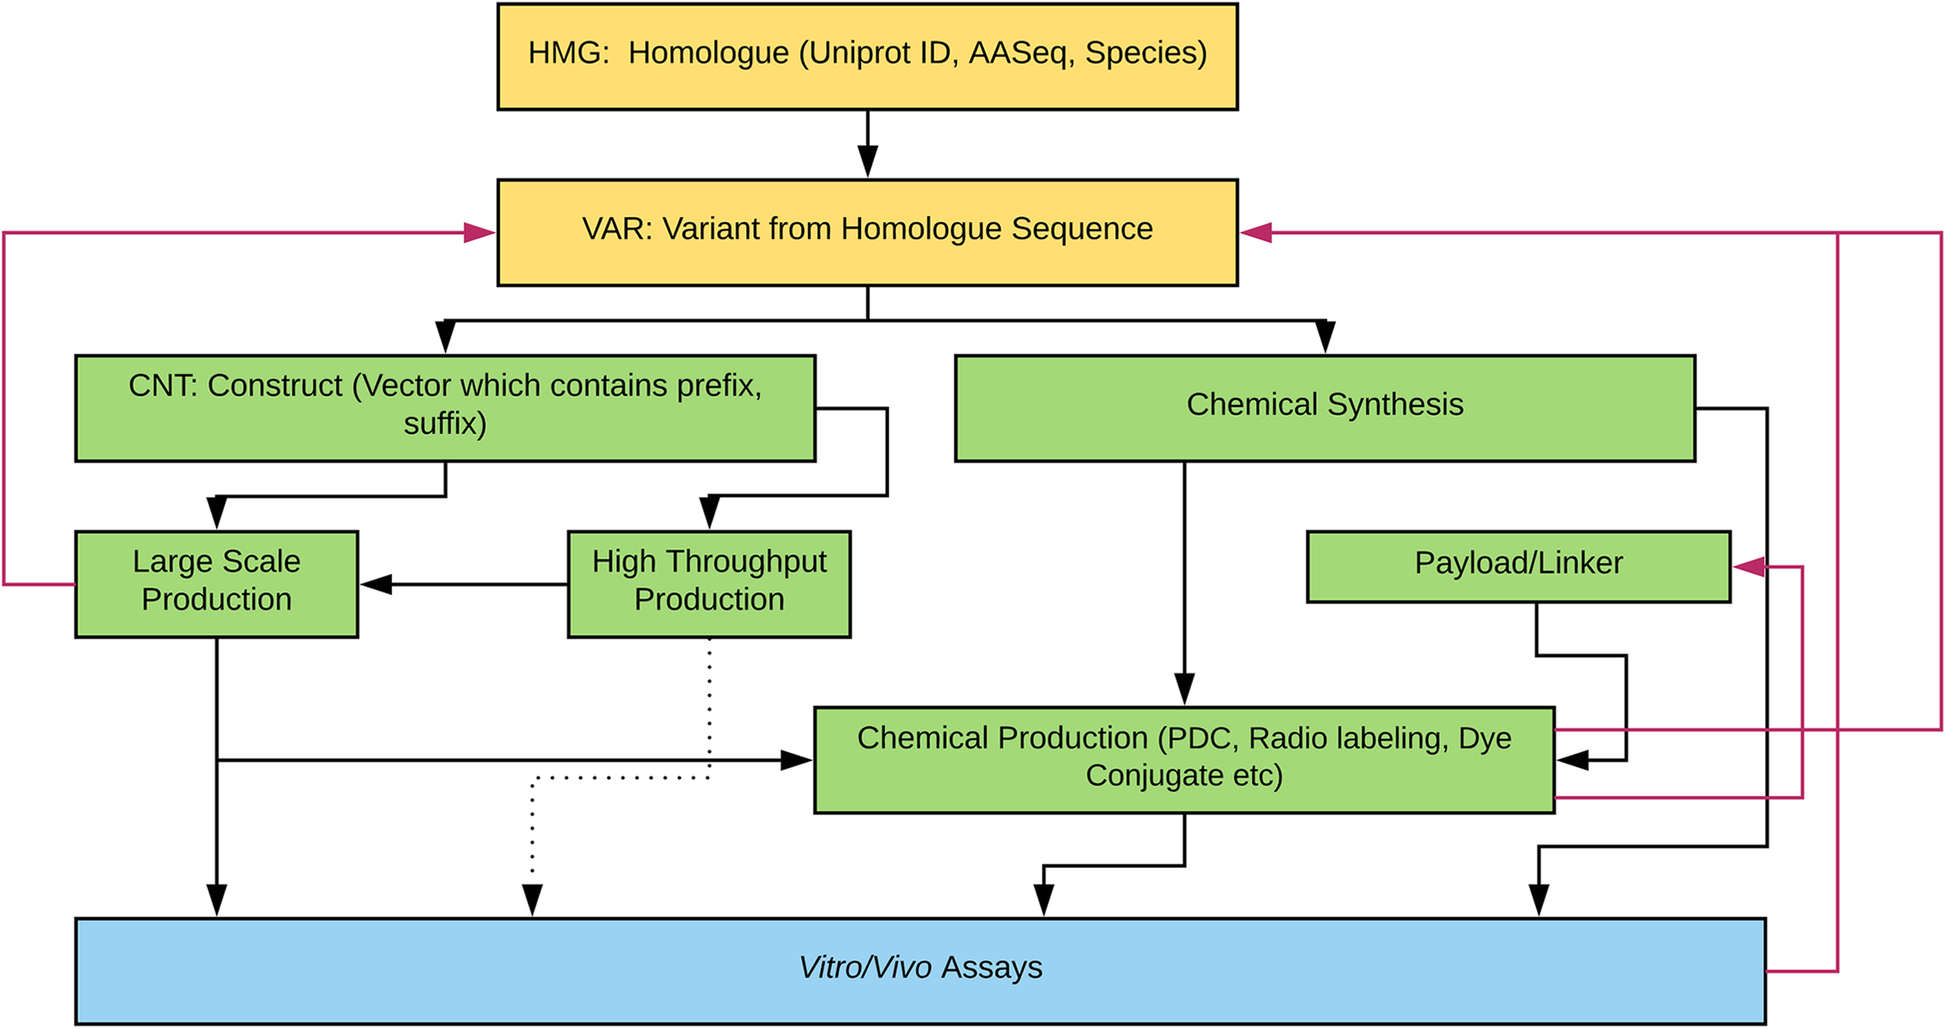
File:Fig1 Brusniak BMCBioinformatics2019 20.png ...e species and Uniprot numbers in the Homologue sample set database fields. Black arrows show the typical engineering paths. The dotted line from high throug(1,946 × 1,029 (255 KB)) - 20:45, 24 June 2019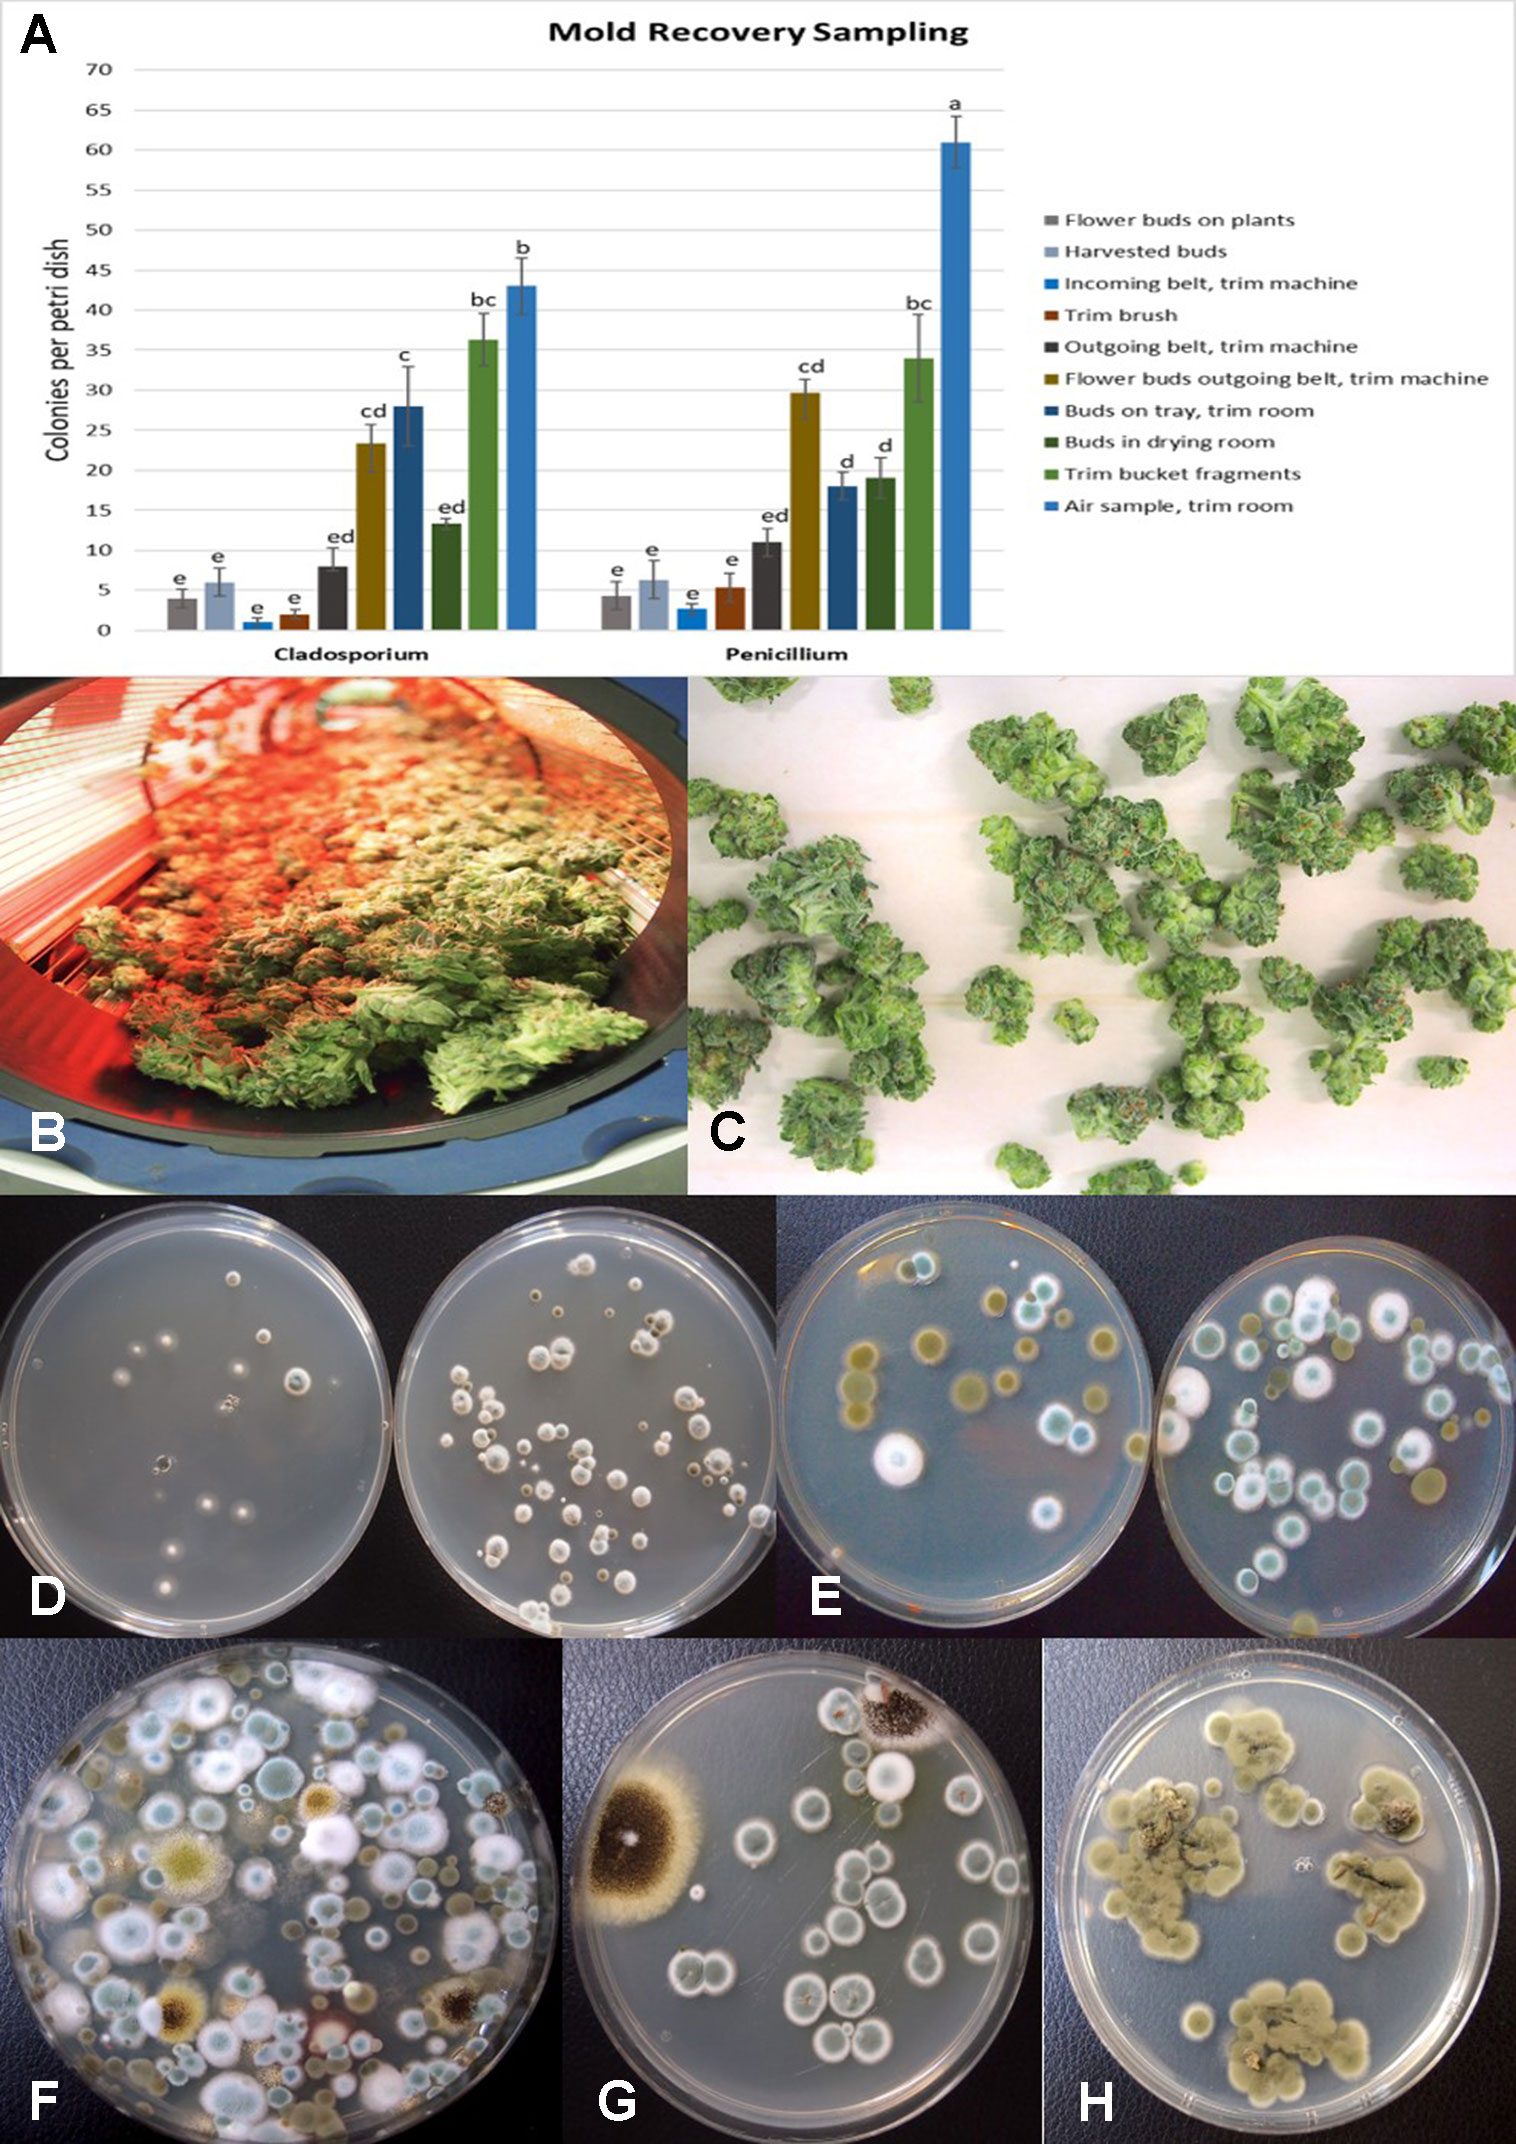
File:Fig13 Punja FrontPlantSci2019 10.jpg ...indoor-grown dried cannabis buds showing growth of ''Aspergillus niger'' (black colonies) and ''Penicillium olsonii'' (blue-green colonies). (H) Swabs take(1,516 × 2,144 (502 KB)) - 21:26, 26 December 2023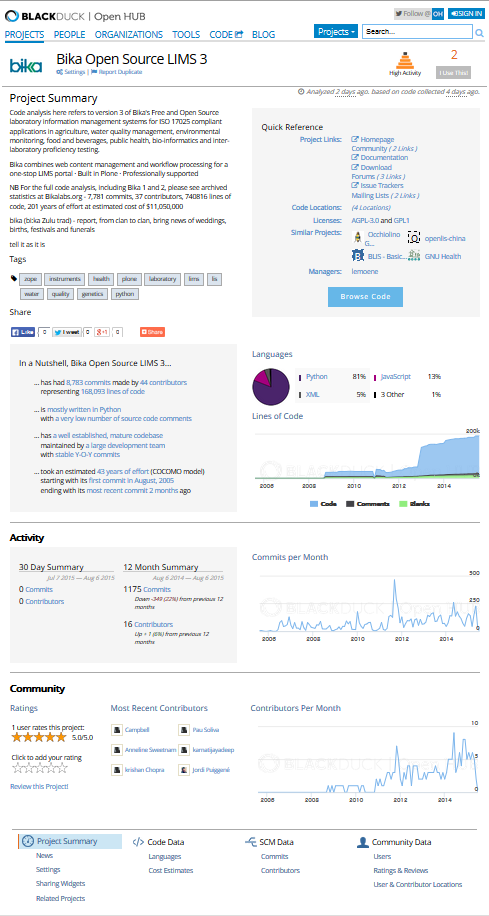
File:Fig2 Joyce 2015.png |Description='''Illustration 2.''' Result page displayed on Black Duck Software's Open Hub site for the Bika Open Source LIMS 3 project.(489 × 916 (97 KB)) - 15:42, 8 October 2015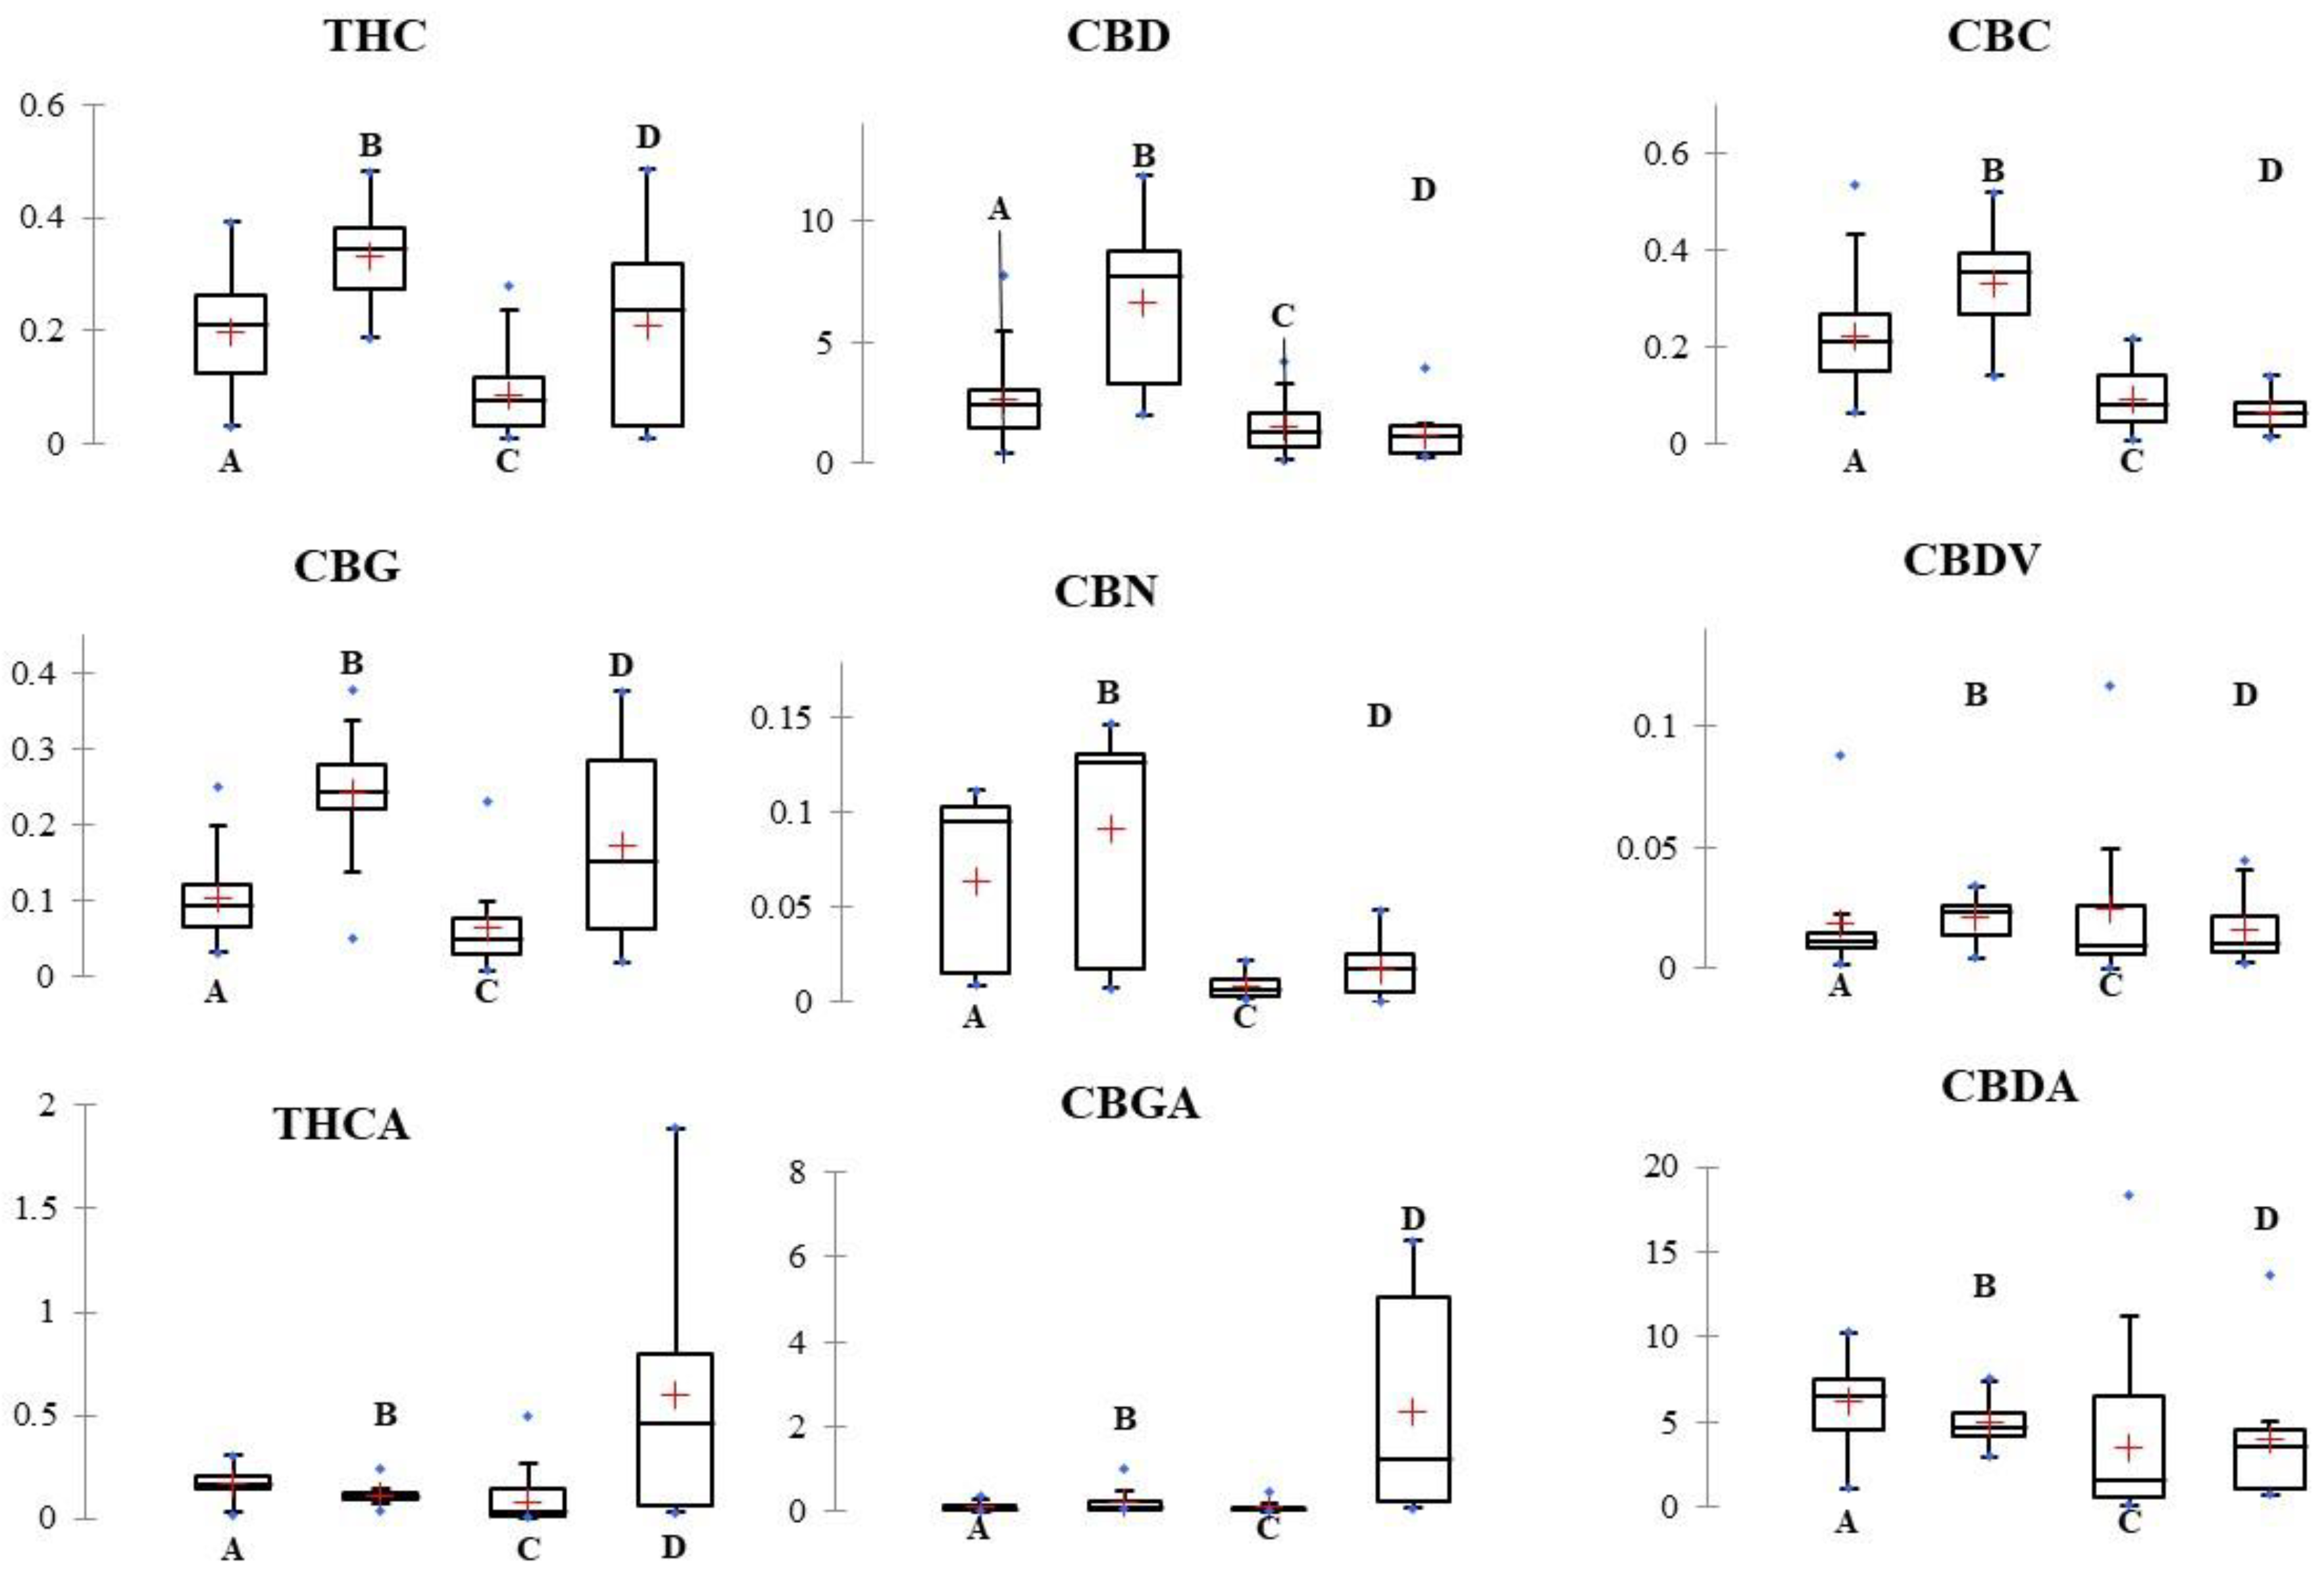
File:Fig1 Palmieri Molecules2019 24-19.png ...axis Title = Hemp retailers. Median and average were depicted with a flat black line and a red cross, respectively. |Source={{cite journal |title=Identific(3,532 × 2,400 (1.05 MB)) - 22:32, 14 October 2019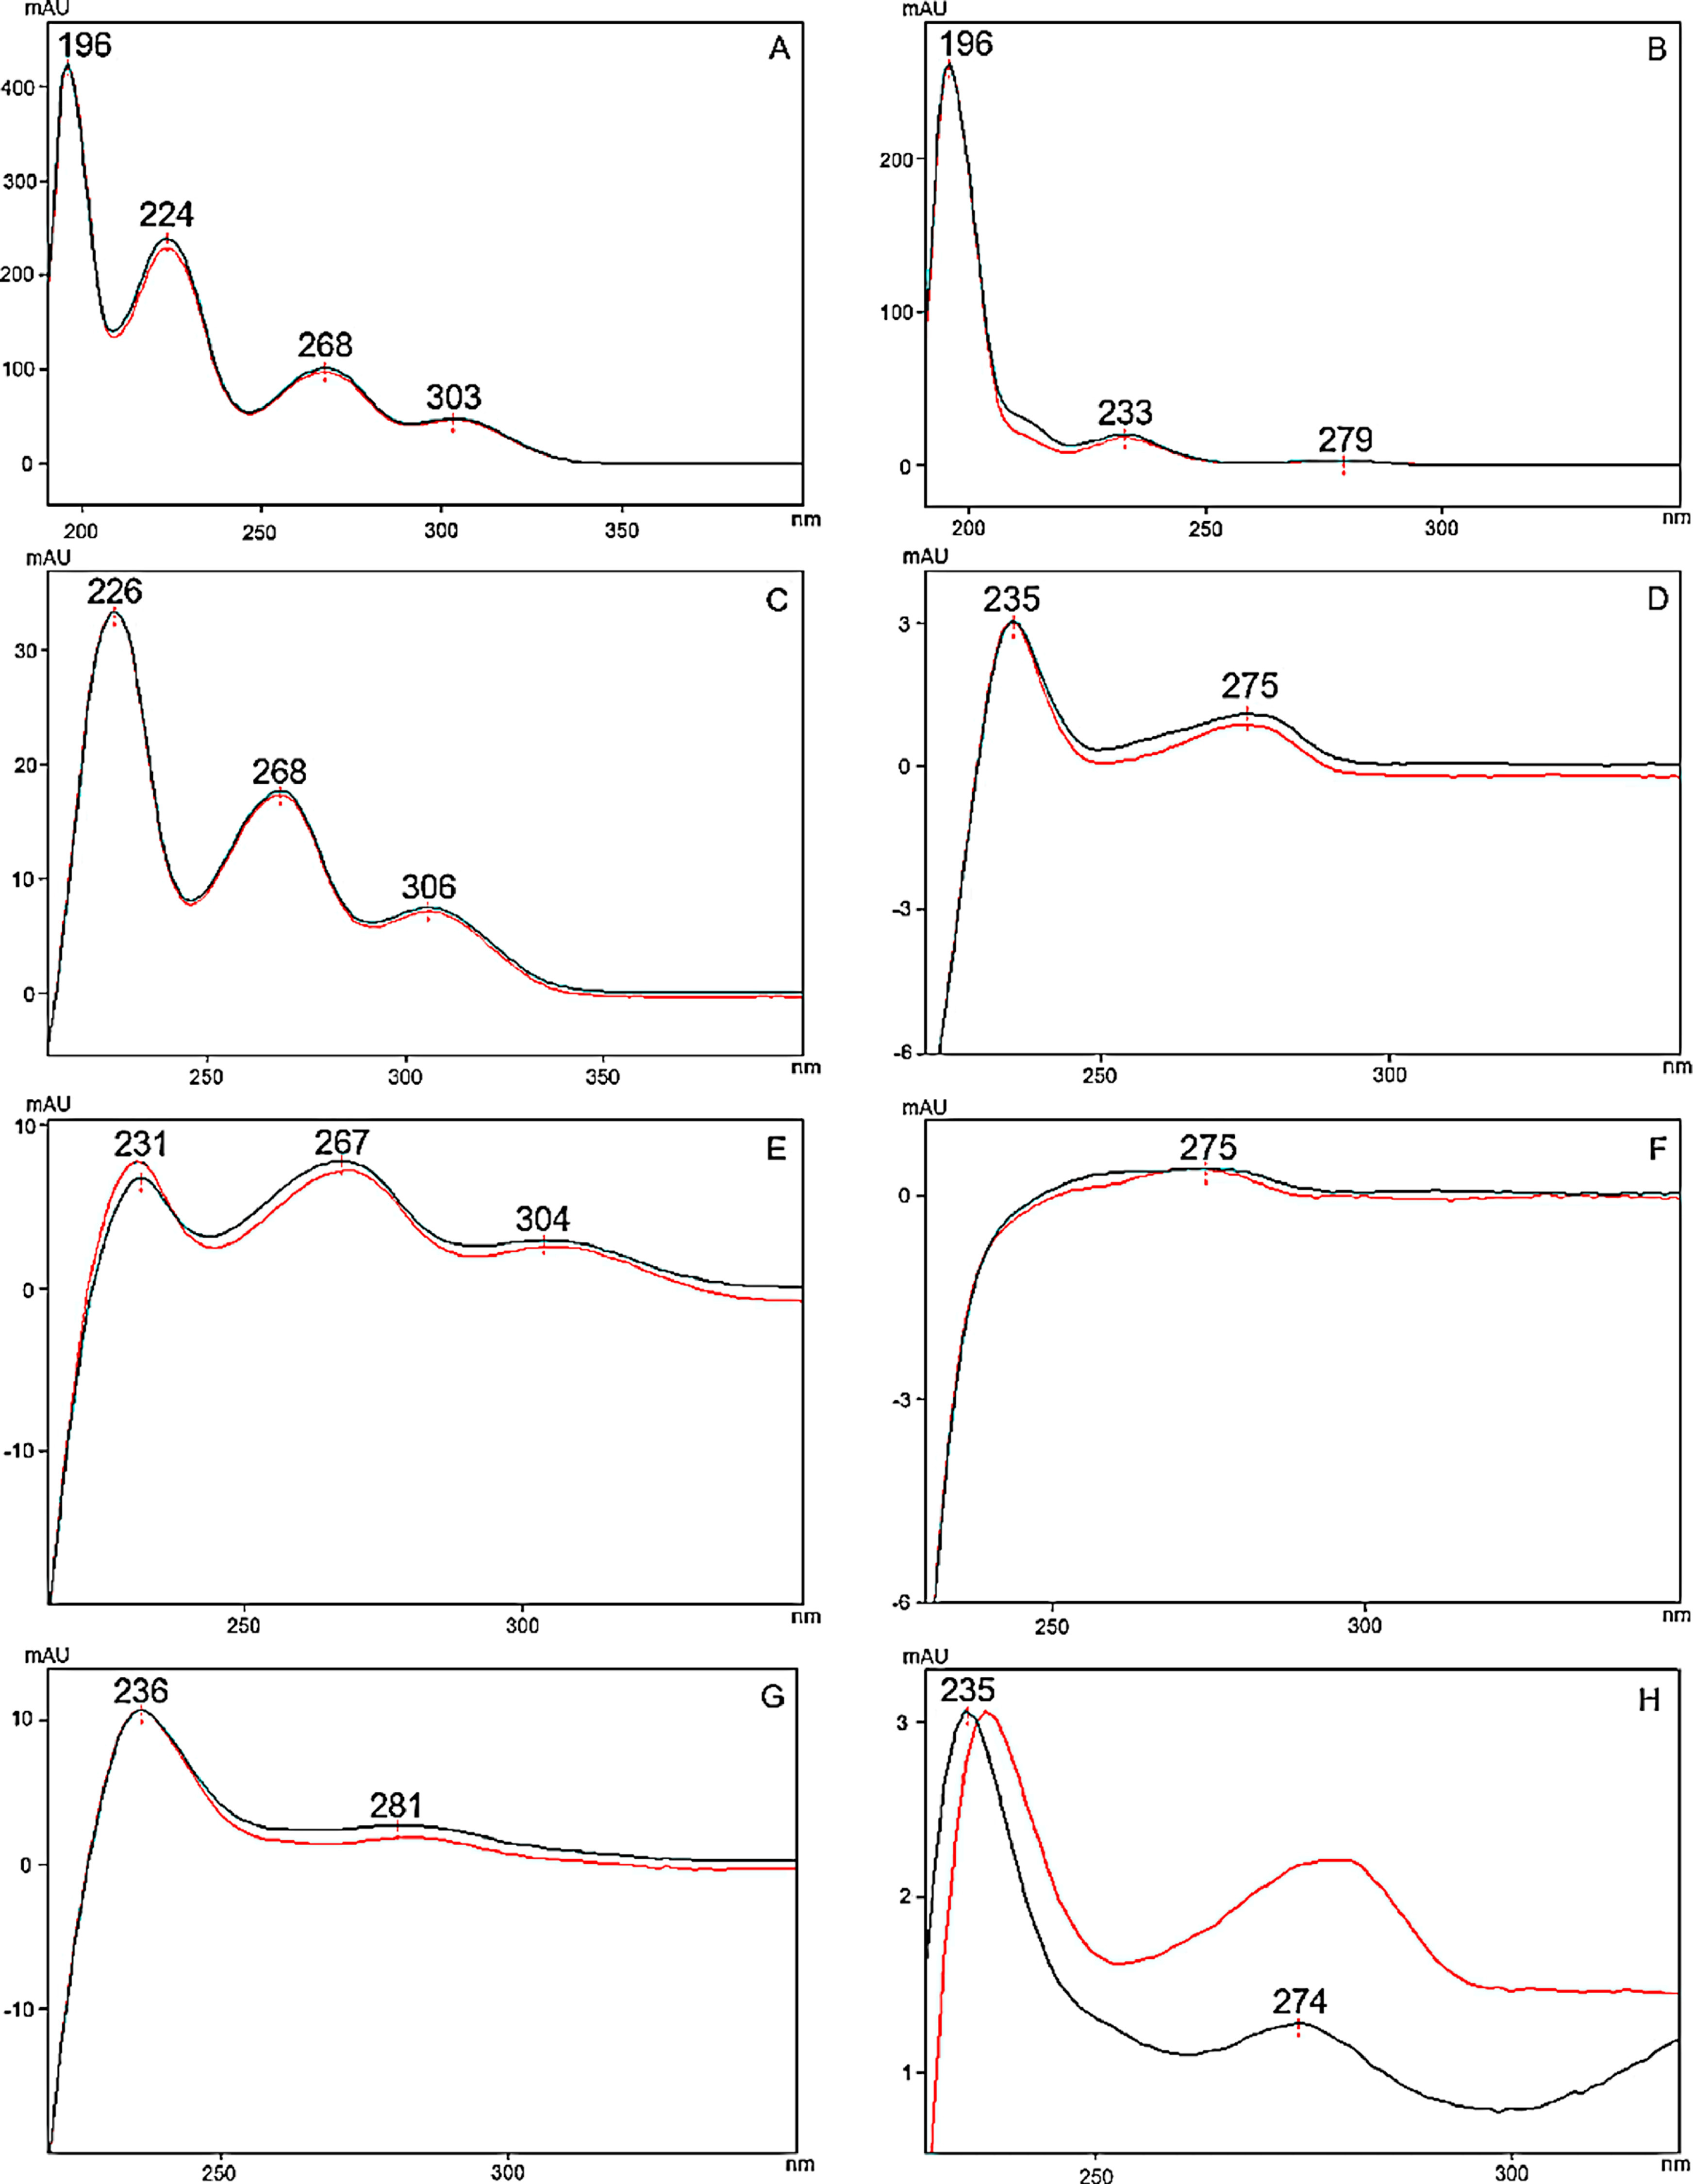
File:Fig2 Hall TalantaOpen2022 5.jpg ...ion='''Fig. 2''' Spectra of cannabinoid peaks recorded from the standards (black) and inflorescence sample (red). '''A''' THCA-A. '''B''' Δ<sup>9</sup>-THC(3,488 × 4,500 (754 KB)) - 21:44, 26 December 2023


