Search results
From LIMSWiki
Jump to navigationJump to search
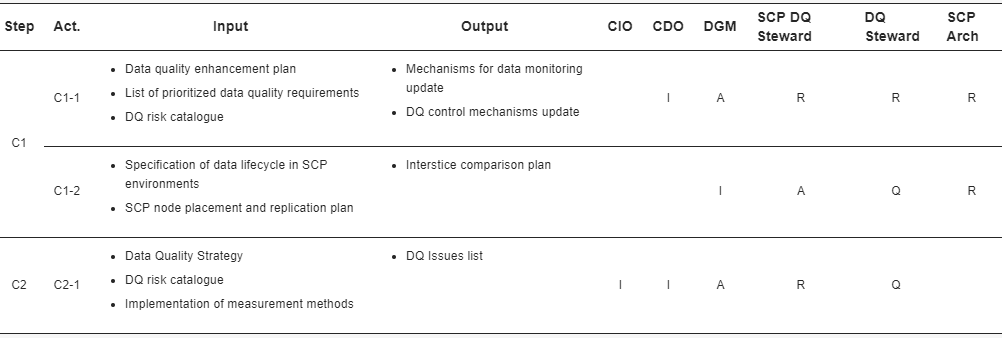
File:Tab7 Perez-Castillo Sensors2018 18-9.png ...ulted; I—Informed; Q—Quality Reviewer) |Source={{cite journal |title=DAQUA-MASS: An ISO 8000-61-based data quality management methodology for sensor data |(1,002 × 338 (26 KB)) - 19:19, 2 April 2019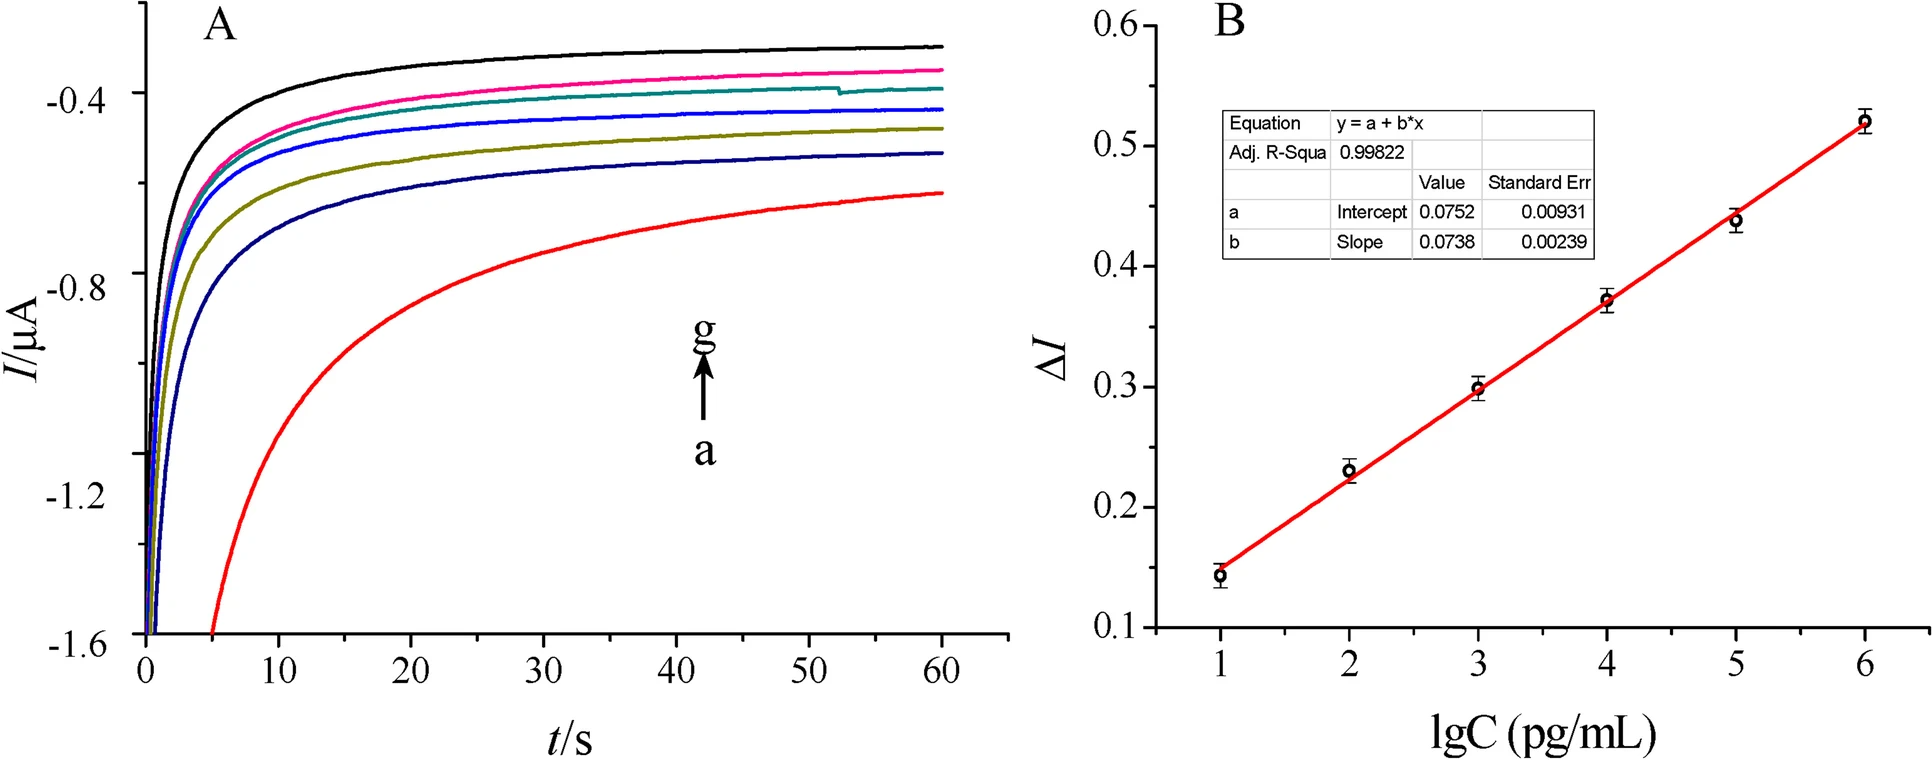
File:Fig2 Amini JofCannRes22 4.png ...ined for diluted THC solutions at increasing proportions with PBS, and the mass concentration was 0.01~103 ng/mL. ('''B''') Calibration curve for the det(1,932 × 760 (356 KB)) - 21:32, 26 December 2023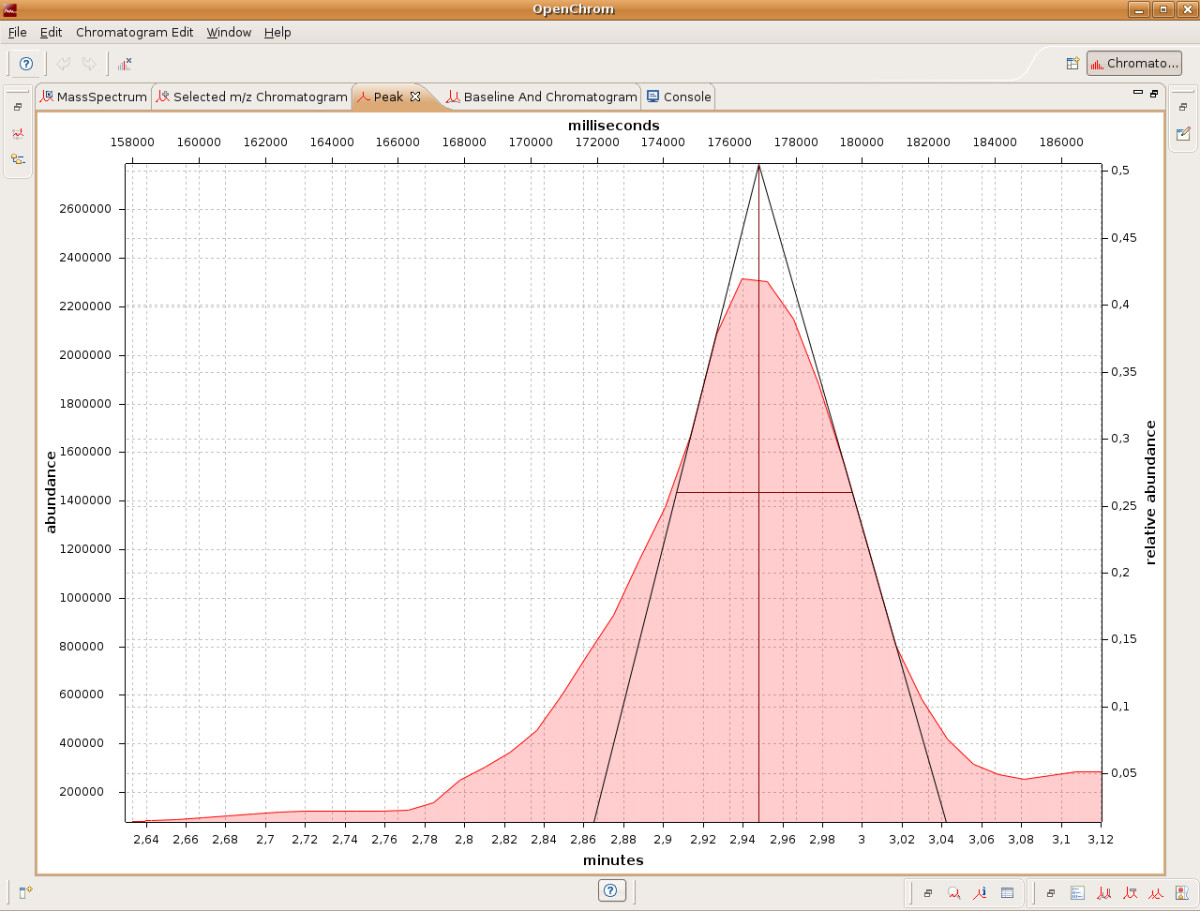
File:Fig4 Wenig BMCBioinformatics2010 11.jpg ...te journal |title=OpenChrom: A cross-platform open source software for the mass spectrometric analysis of chromatographic data |journal=BMC Bioinformatics(1,200 × 911 (212 KB)) - 15:46, 26 March 2016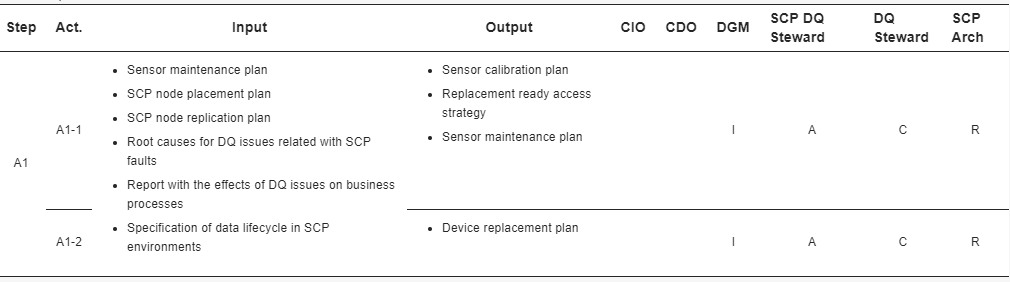
File:Tab8 Perez-Castillo Sensors2018 18-9.png ...ulted; I—Informed; Q—Quality Reviewer) |Source={{cite journal |title=DAQUA-MASS: An ISO 8000-61-based data quality management methodology for sensor data |(1,010 × 282 (24 KB)) - 19:29, 2 April 2019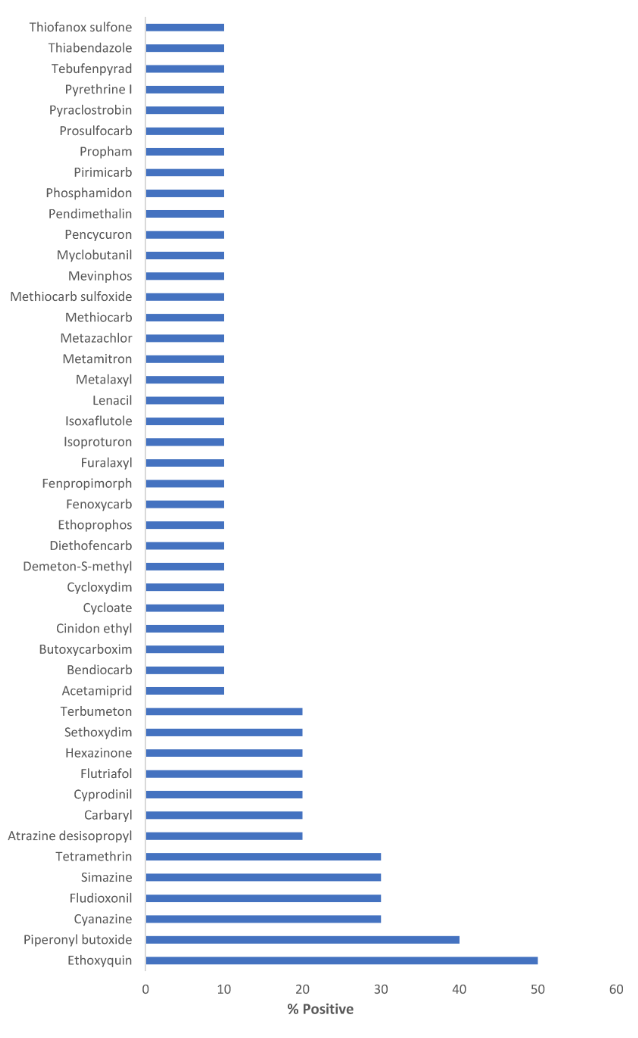
File:Fig2 Narváez Toxins2020 12-2.png ...nce liquid chromatography coupled with quadrupole-Orbitrap high-resolution mass spectrometry for multi-residue analysis of mycotoxins and pesticides in bot(638 × 1,038 (80 KB)) - 22:47, 20 December 2023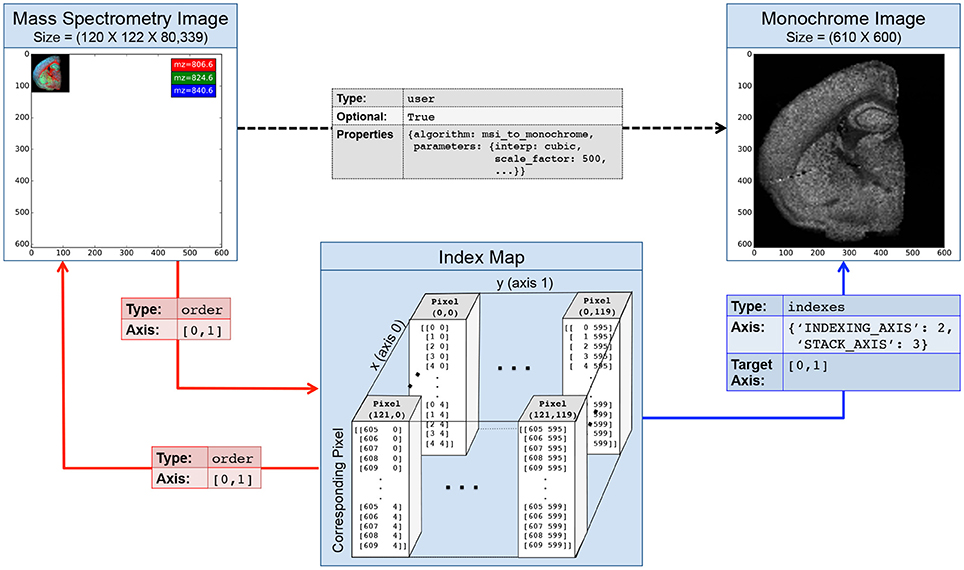
File:Fig4 Rubel FInNeuroinformatics2016 10.jpg ...stration of an index map relationship describing the interaction between a mass spectrometry image (MSI) and a derived monochrome image. The MSI image is i(964 × 570 (257 KB)) - 21:47, 20 February 2017
File:Fig3 Mudge AnalBioChem2017 409-12.gif ...r major cannabinoids comparing ('''a''') solvent composition and volume to mass ratio; ('''b''') extraction times of 15, 30, and 60 minutes, and ('''c''')(499 × 1,106 (59 KB)) - 22:47, 20 December 2023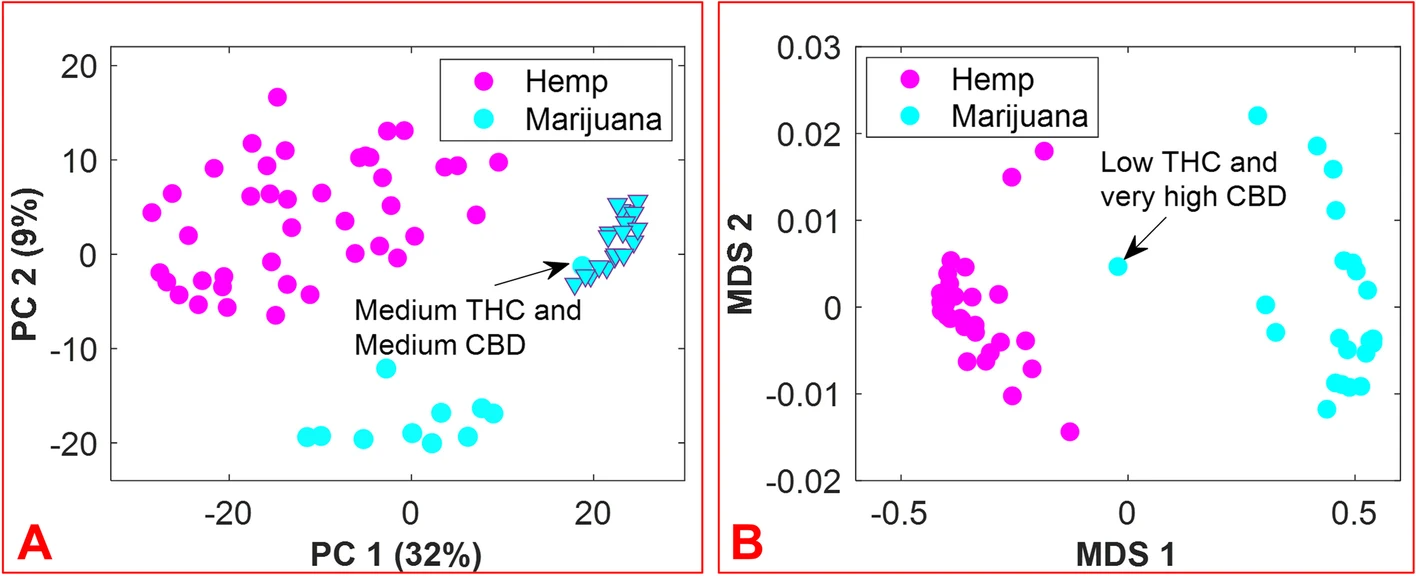
File:Fig3 Chambers JofCannRes23 5.png |Source={{cite journal |title=Combined ambient ionization mass spectrometric and chemometric approach for the differentiation of hemp and(1,416 × 576 (283 KB)) - 22:00, 26 December 2023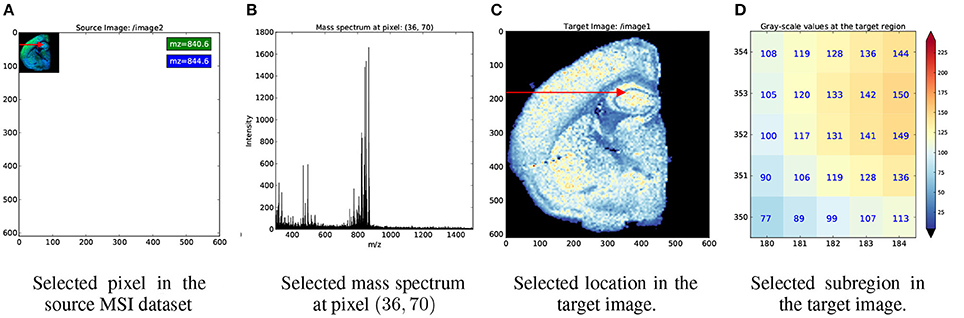
File:Fig5 Rubel FInNeuroinformatics2016 10.jpg ...dataset. '''(B)''' As expected, this results in the selection of a single mass spectrum. '''(C)''' We next map the same selection to our target dataset. F(964 × 318 (187 KB)) - 21:51, 20 February 2017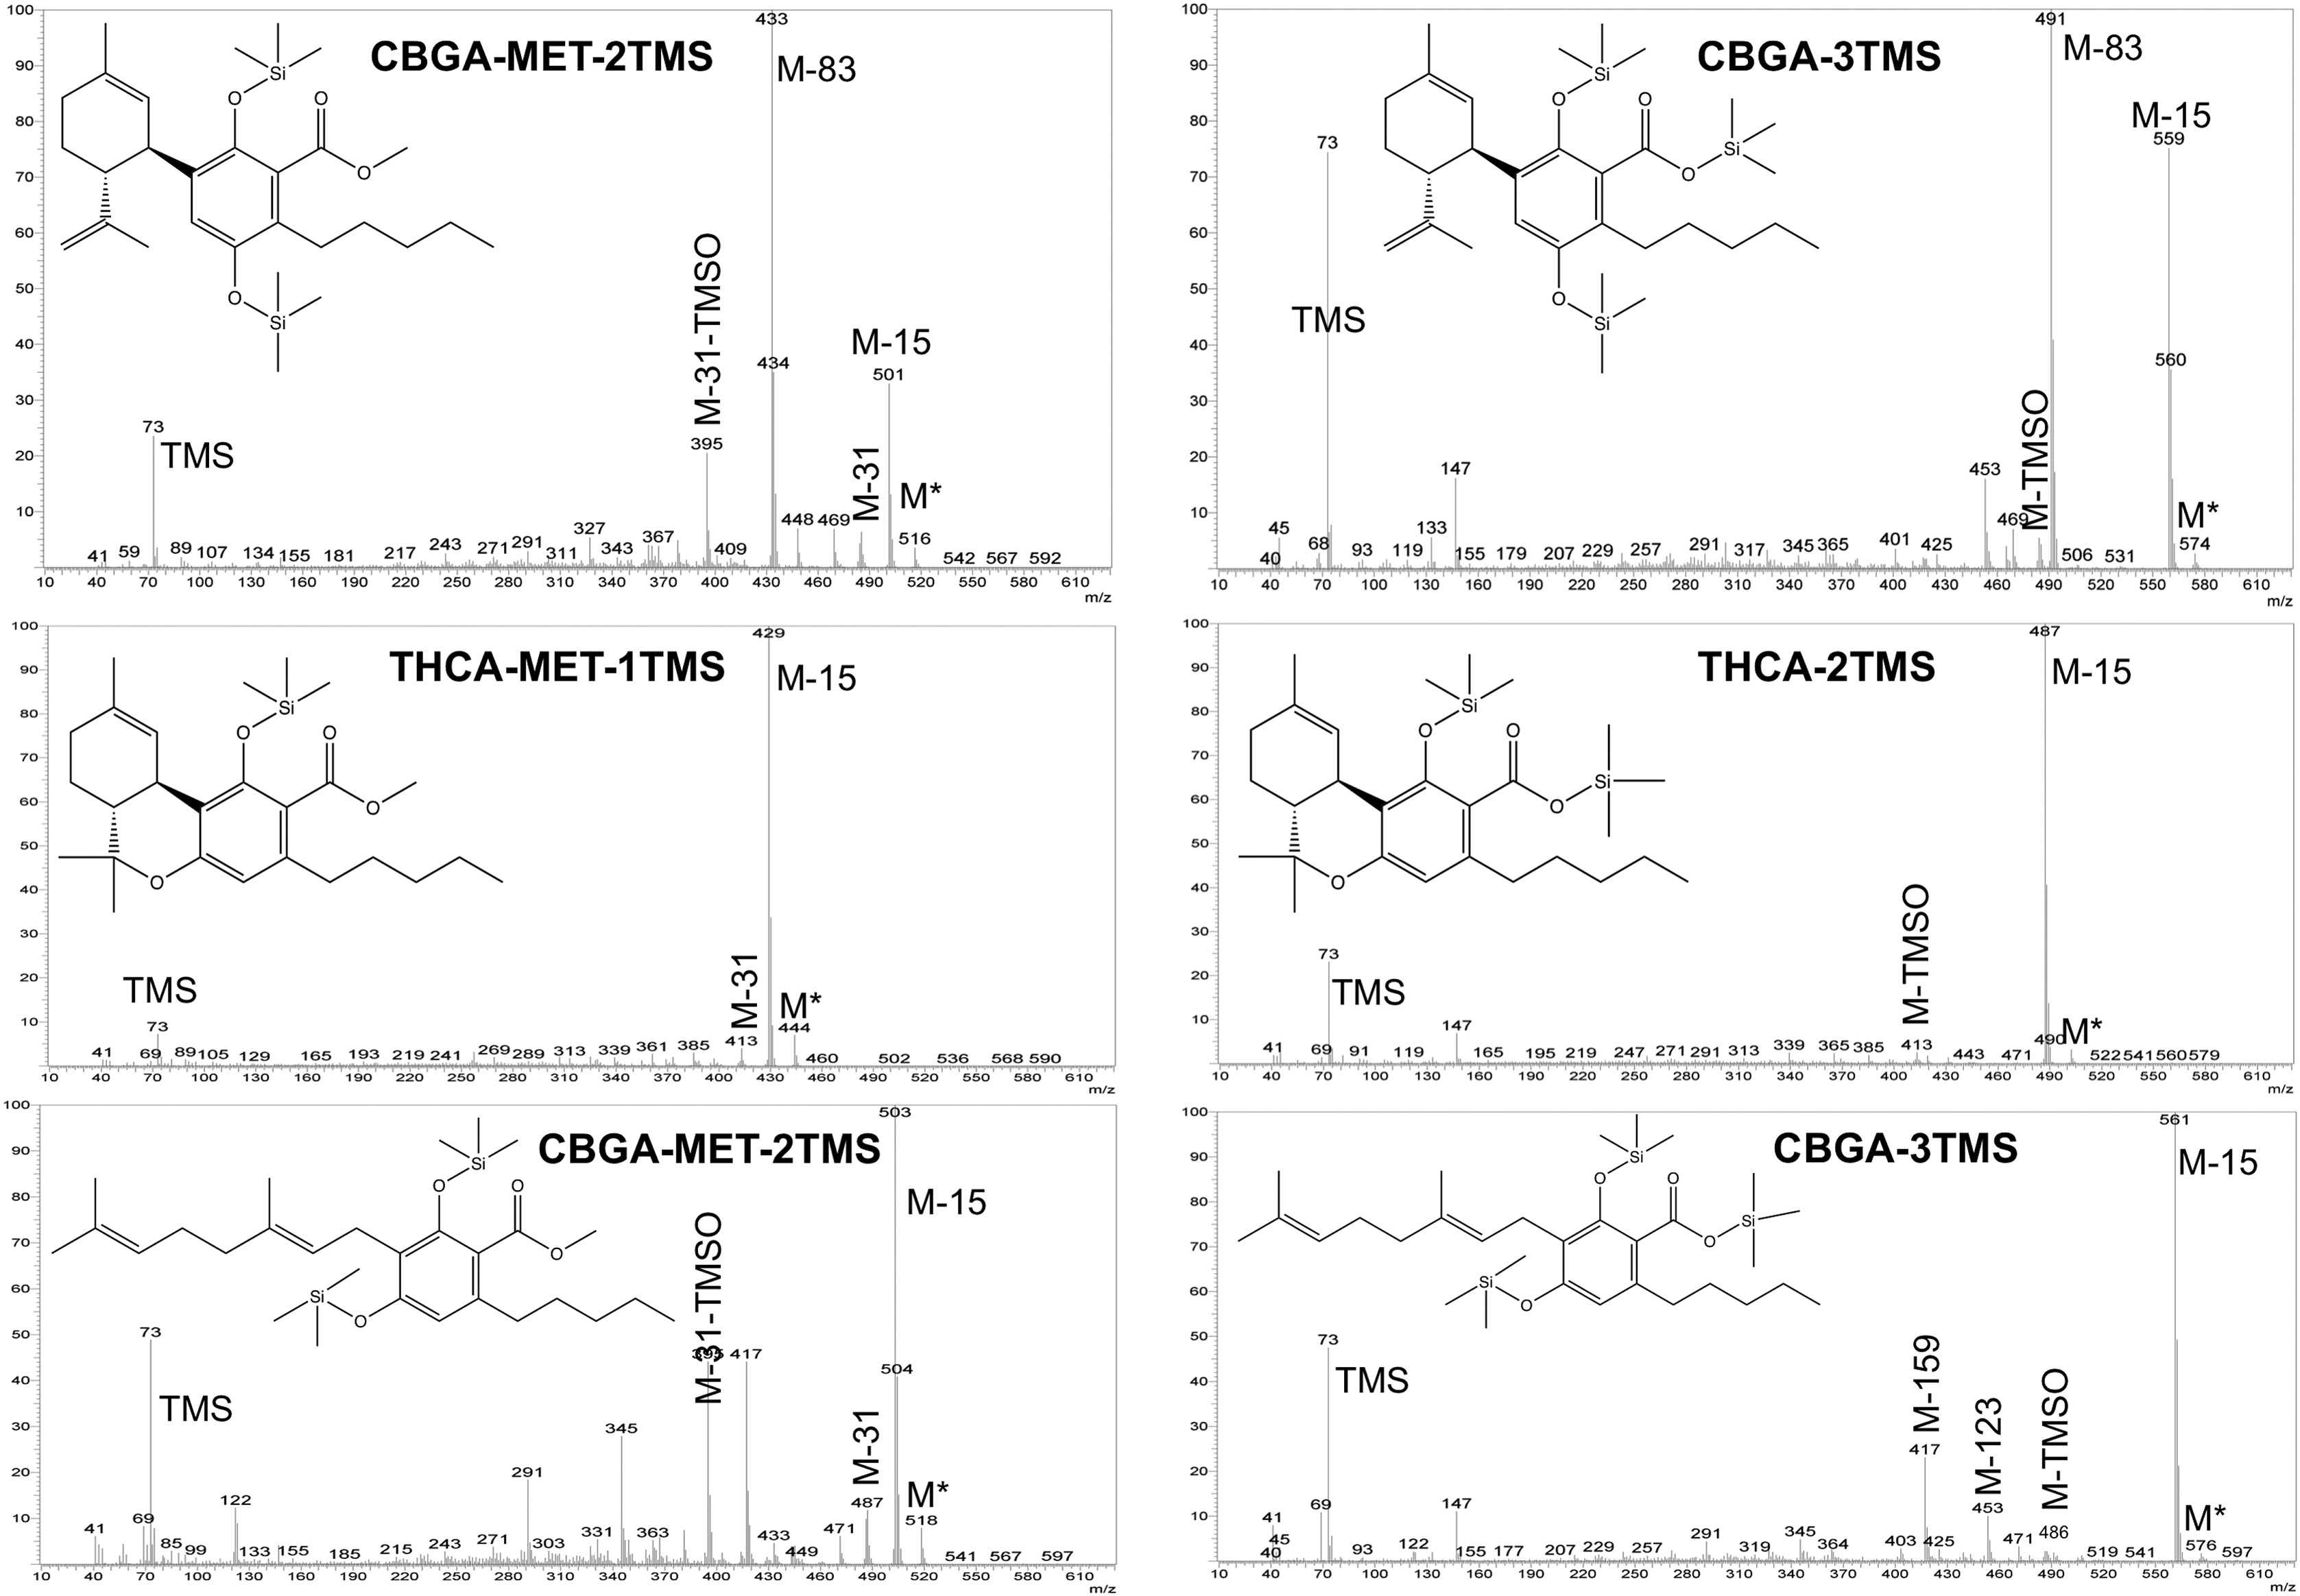
File:Fig2 Cardenia JofFoodDrugAnal2018 26-4.jpg ...(CBDA), tetrahydrocannabinolic acid (THCA) and cannabigerolic acid (CBGA) mass spectra, as related to methylation-silylation (MET-TMS) and silylation (TMS ...ite journal |title=Development and validation of a fast gas chromatography–mass spectrometry method for the determination of cannabinoids in ''Cannabis sat(3,354 × 2,328 (682 KB)) - 17:15, 22 October 2019
File:Fig4 Chambers JofCannRes23 5.png |Source={{cite journal |title=Combined ambient ionization mass spectrometric and chemometric approach for the differentiation of hemp and(1,416 × 1,063 (263 KB)) - 22:42, 26 December 2023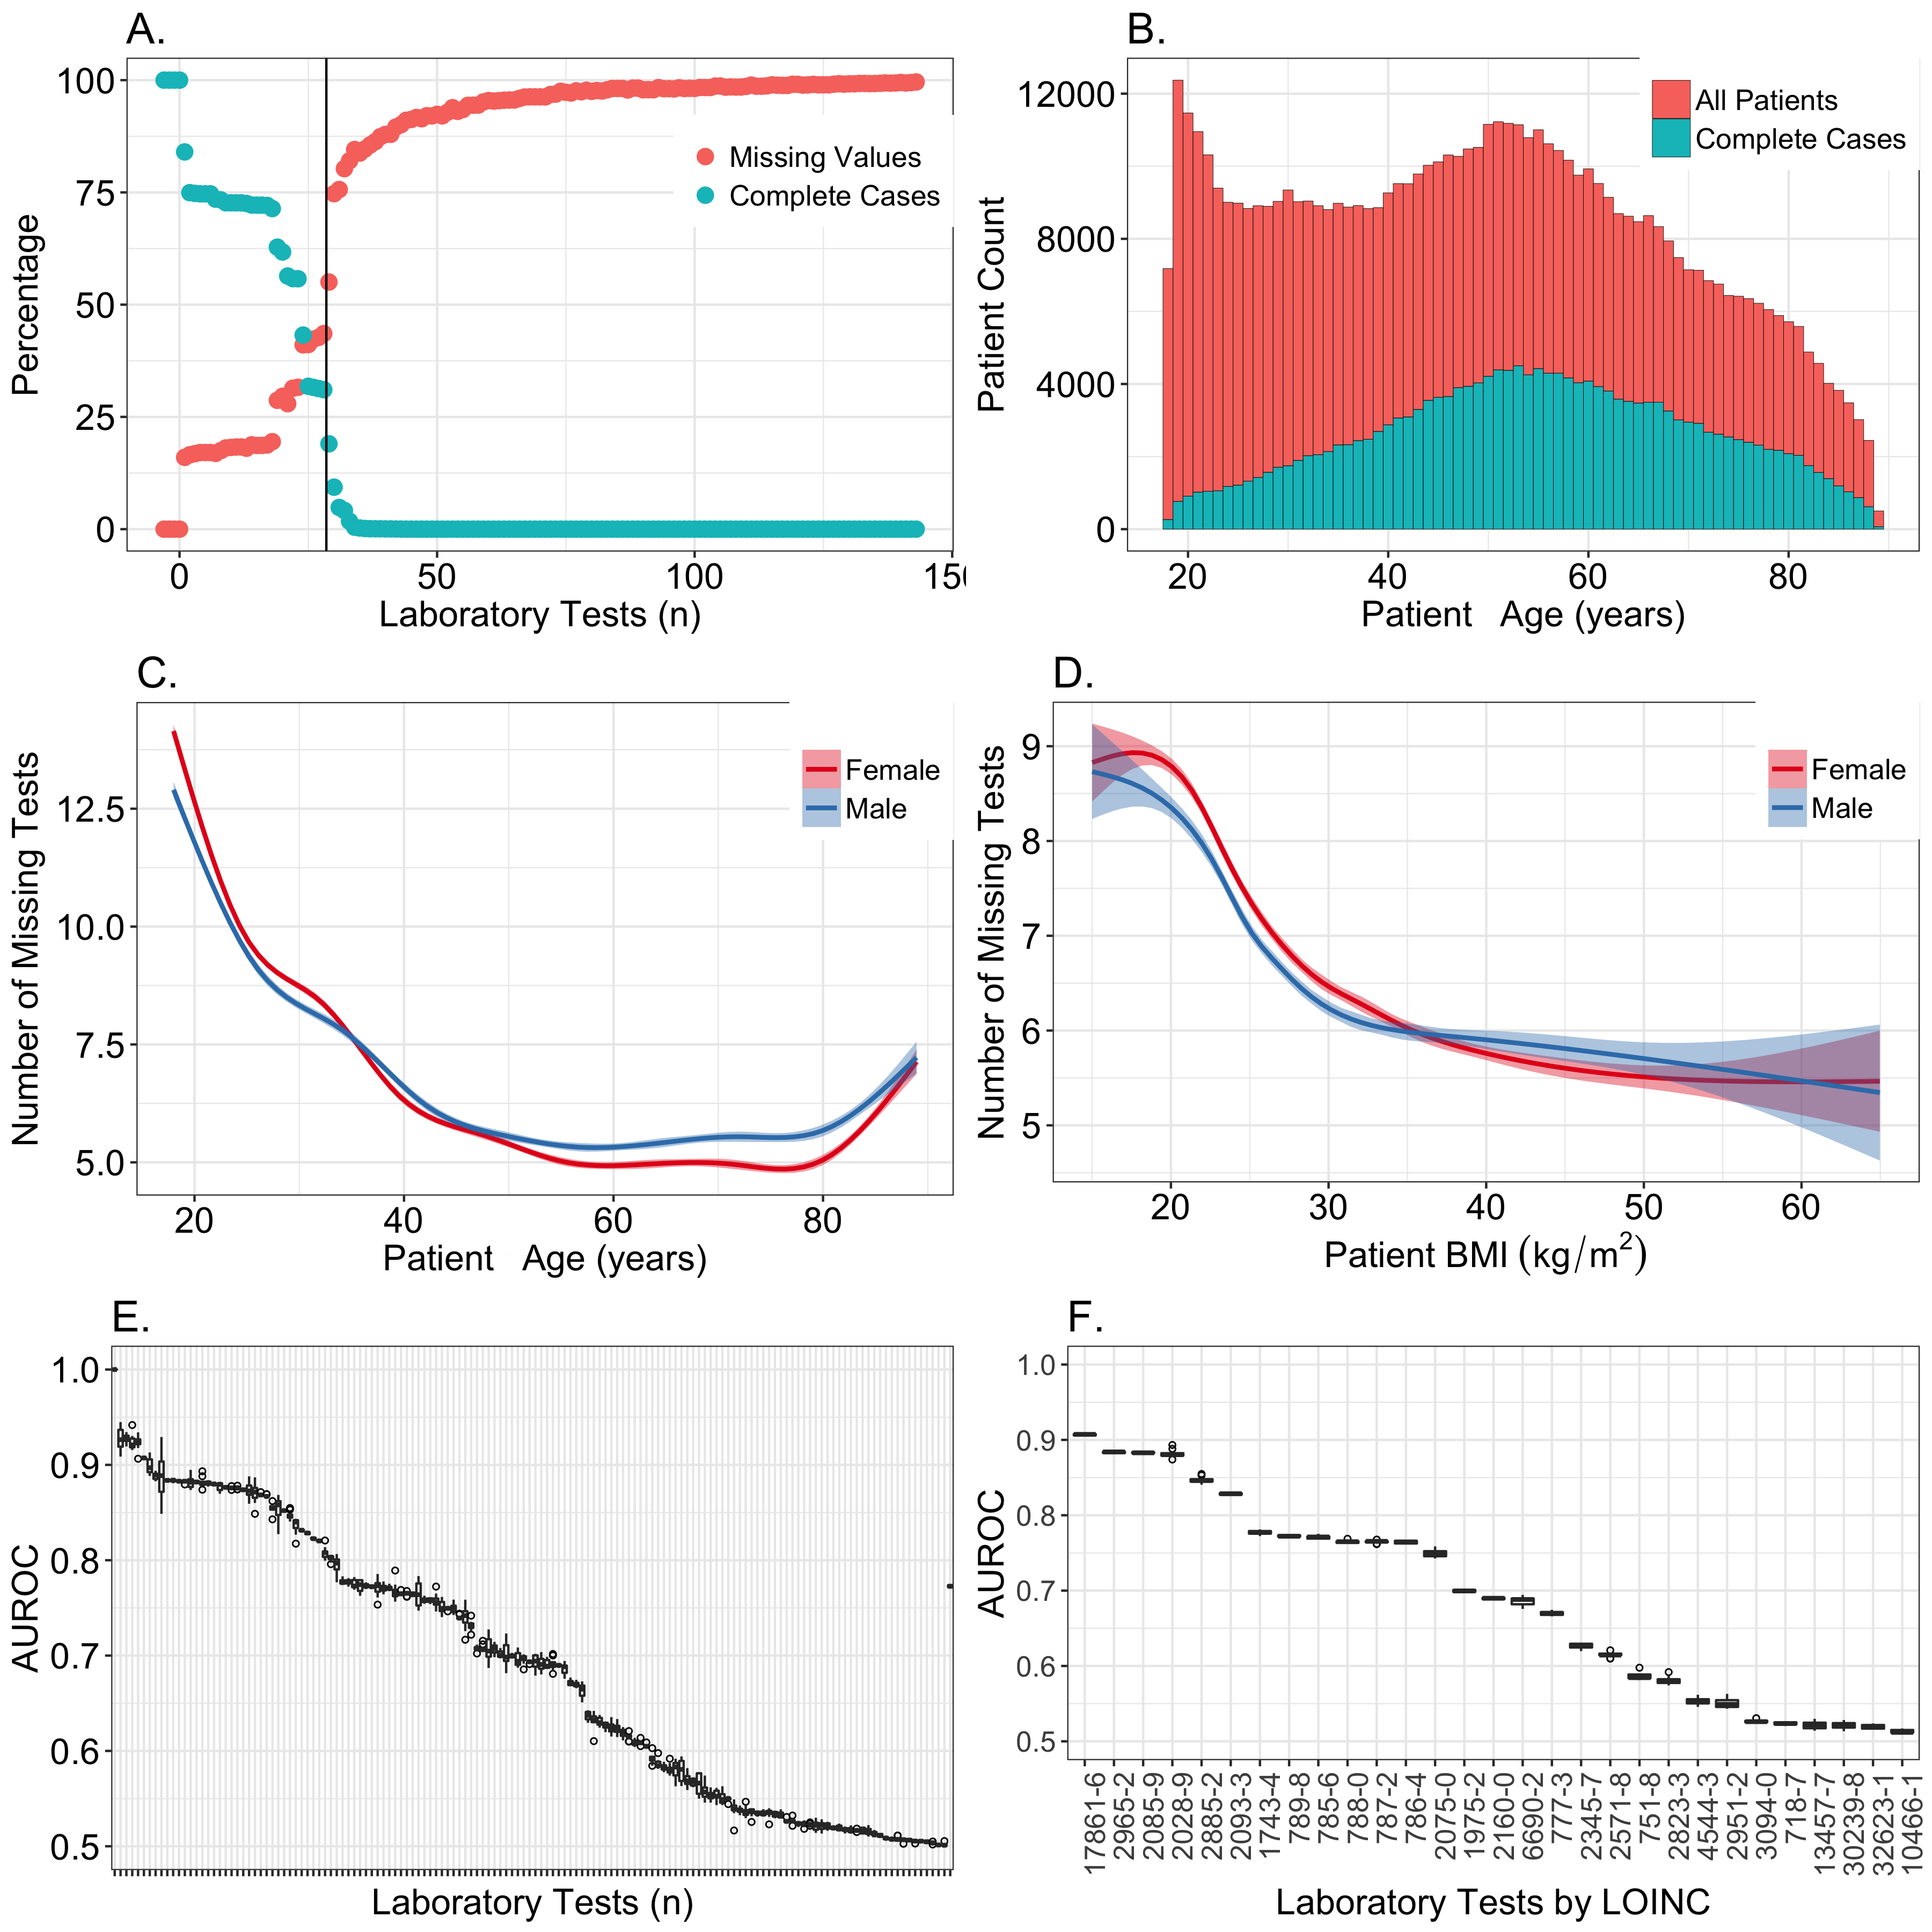
File:Fig2 Beaulieu-JonesJMIRMedInfo2018 6-1.png ...tation, the mean number of missing tests is depicted as a function of body mass index (BMI). '''(E)''' Accuracy of a random forest predicting the presence(3,600 × 3,600 (694 KB)) - 19:52, 6 March 2018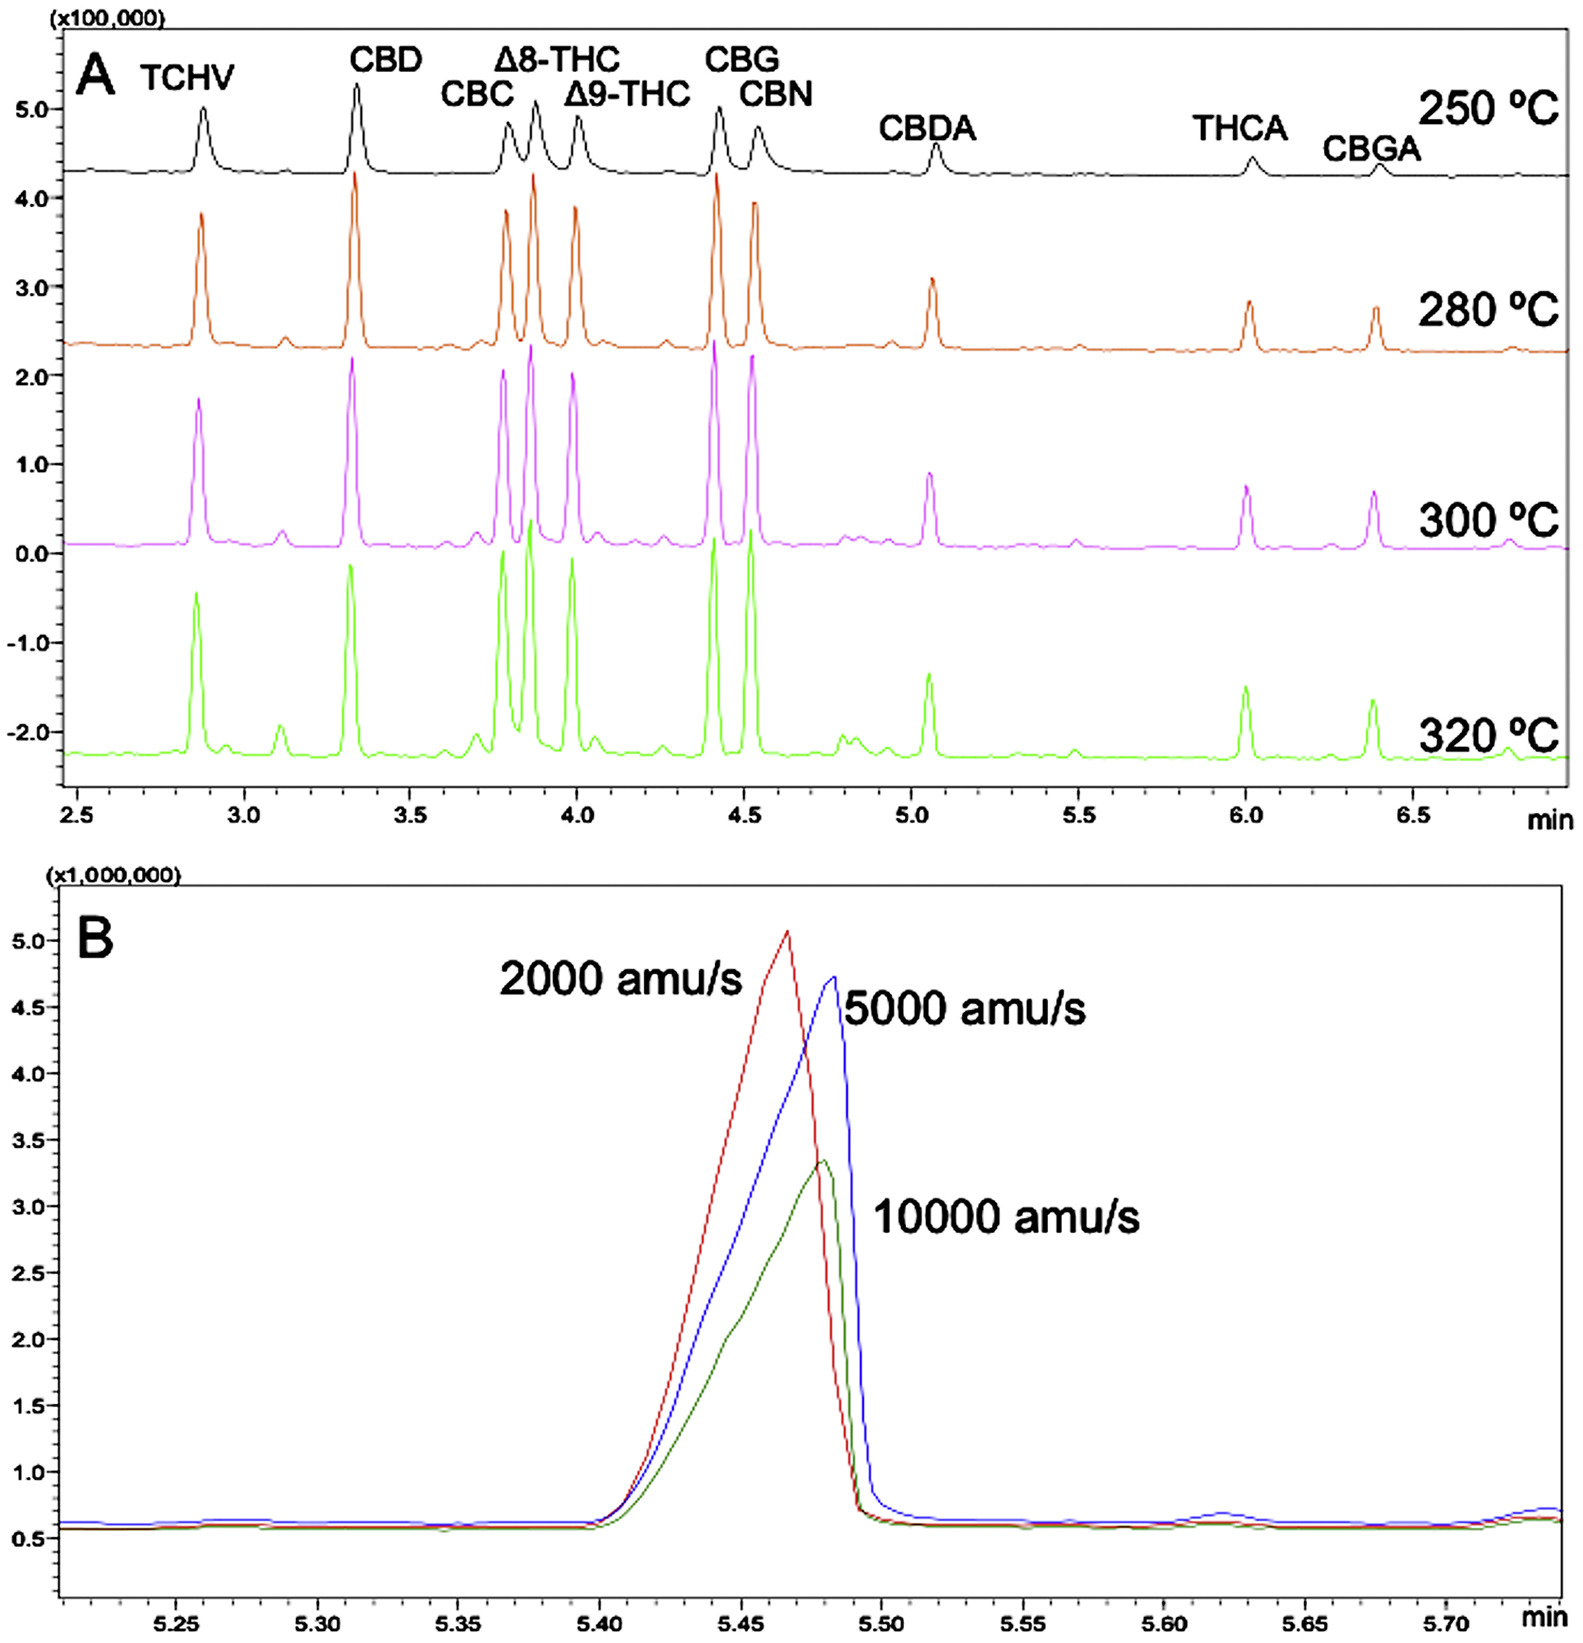
File:Fig4 Cardenia JofFoodDrugAnal2018 26-4.jpg ...d at different injector temperatures ('''A''') and total ion current (TIC) mass spectrum of cannabidiolic acid (CBDA), as related to different quadrupole a ...ite journal |title=Development and validation of a fast gas chromatography–mass spectrometry method for the determination of cannabinoids in ''Cannabis sat(1,583 × 1,643 (280 KB)) - 17:47, 22 October 2019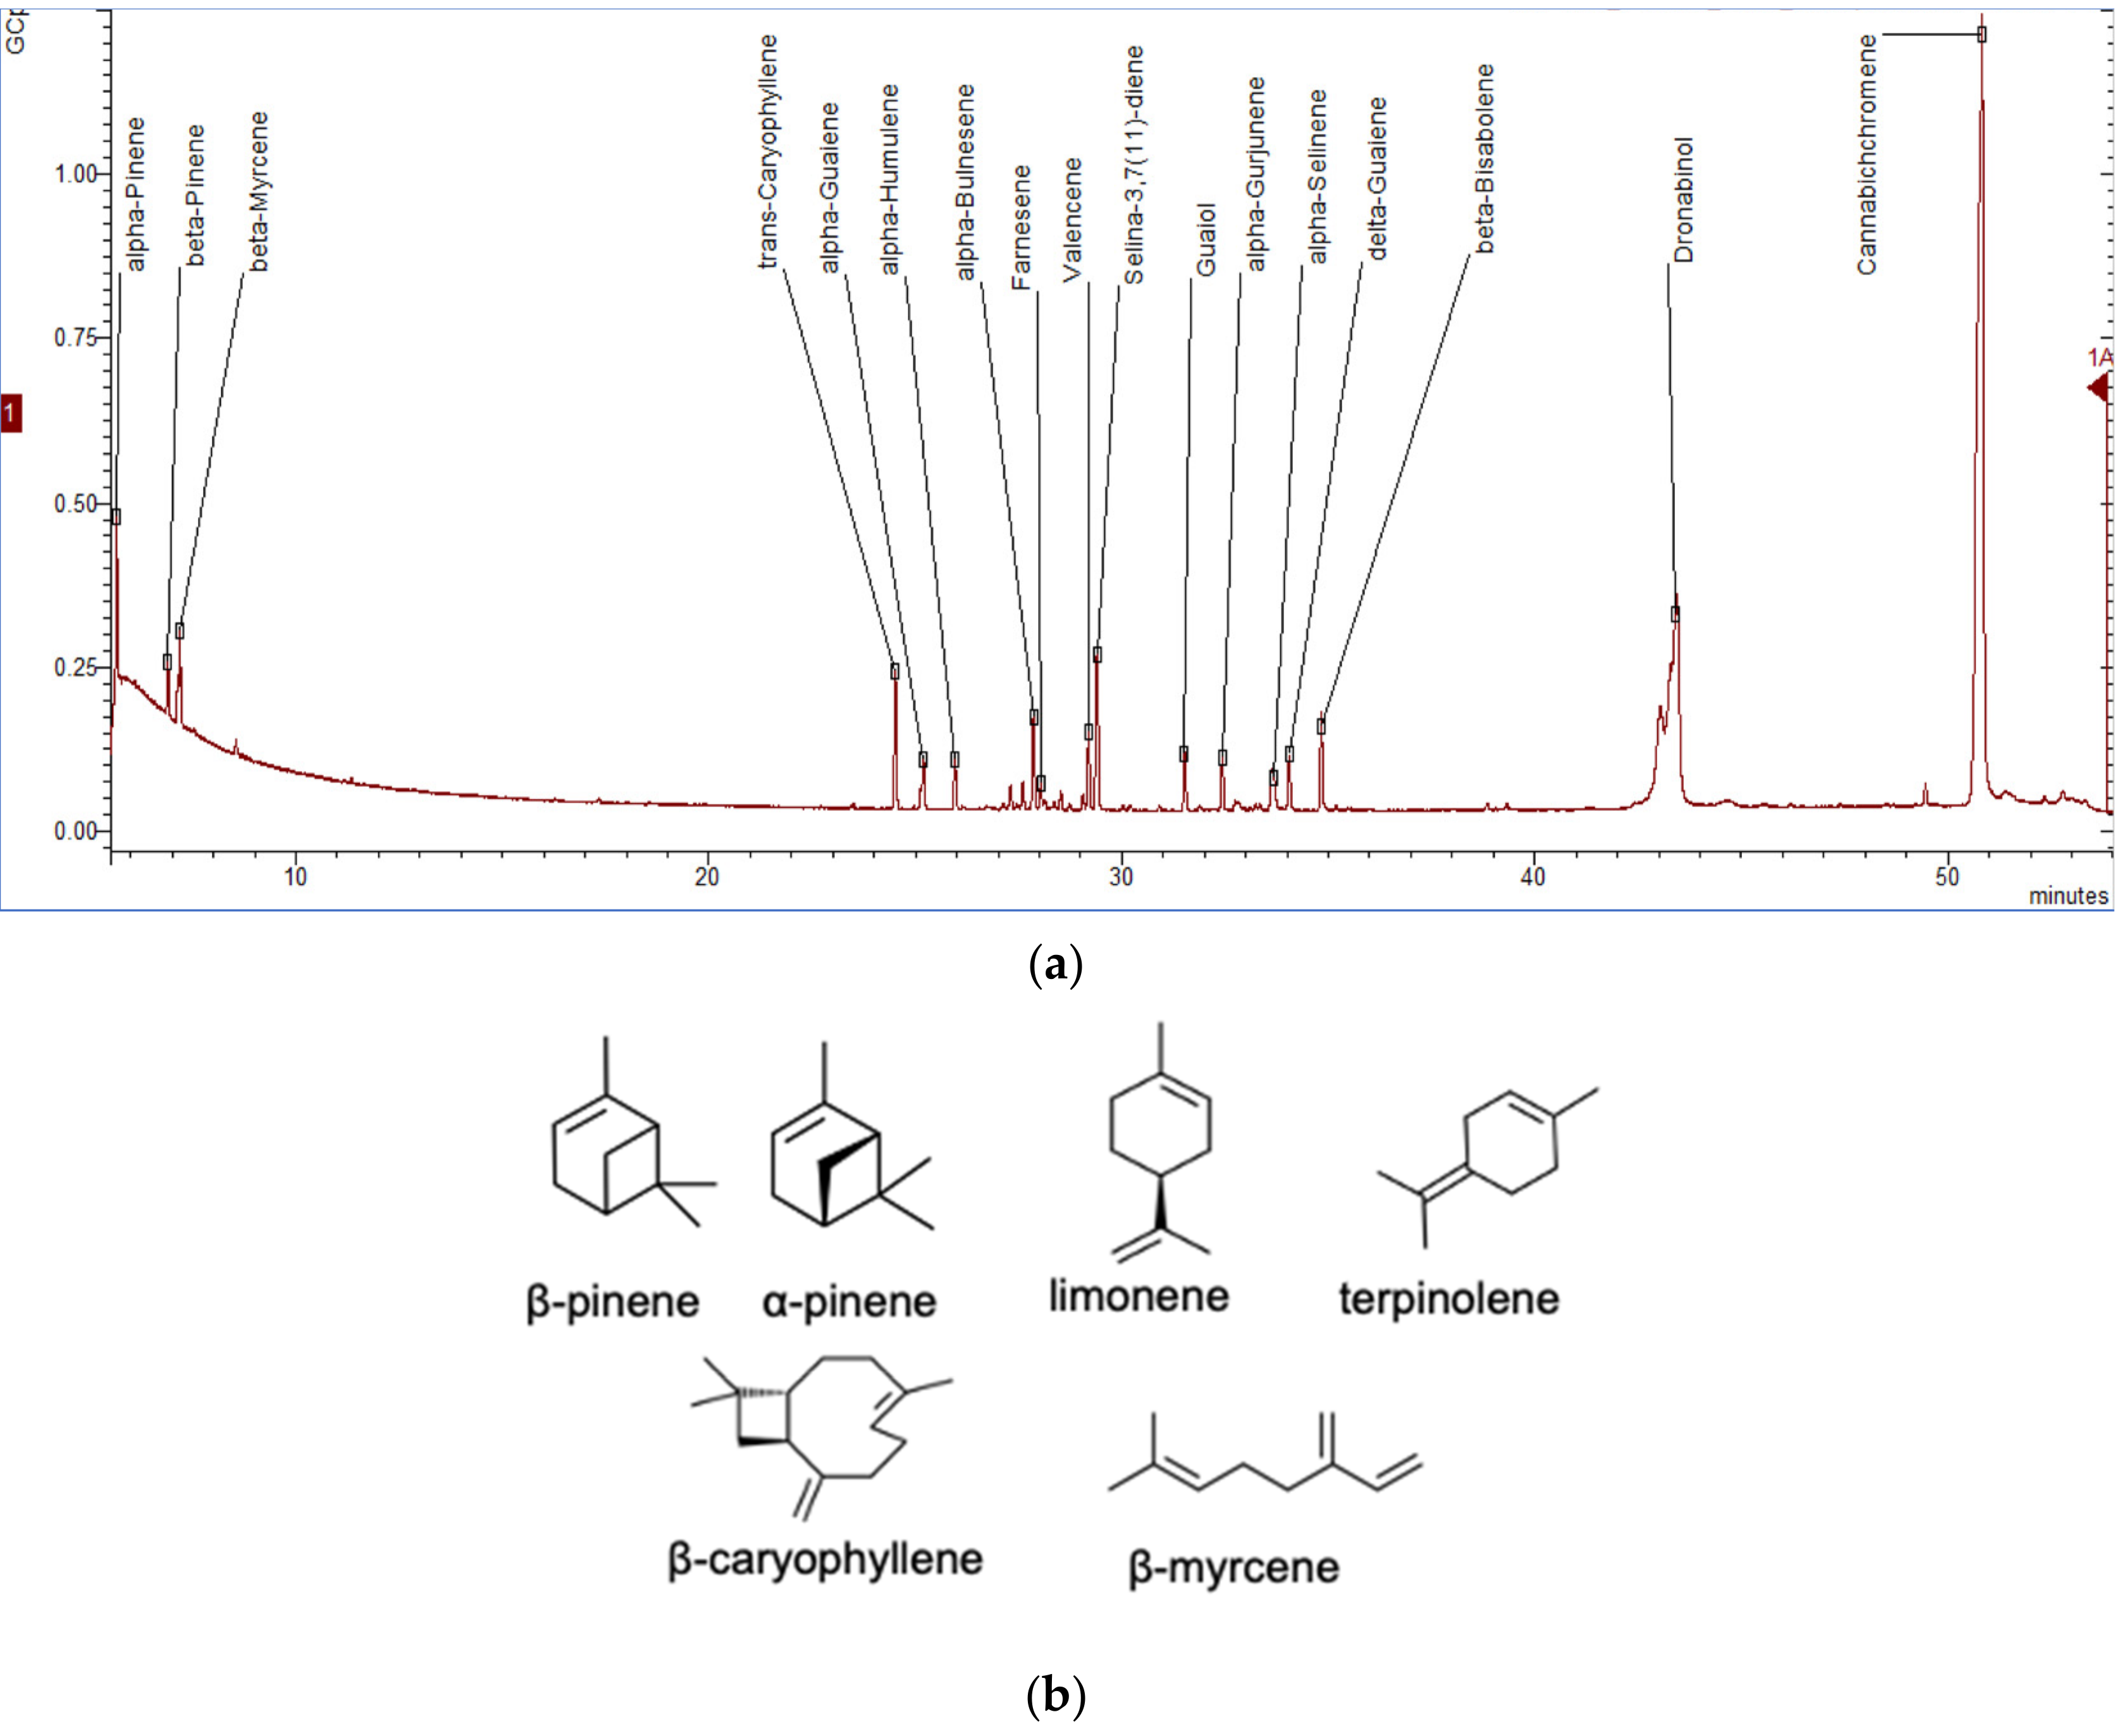
File:Fig5 Sommano Molecules21 25-24.png ...ted with propanol by the ultrasonic assisted method and gas chromatography mass spectrometry (GC-MS) analysis was performed using the protocol described by(3,361 × 2,745 (1.06 MB)) - 22:58, 26 December 2023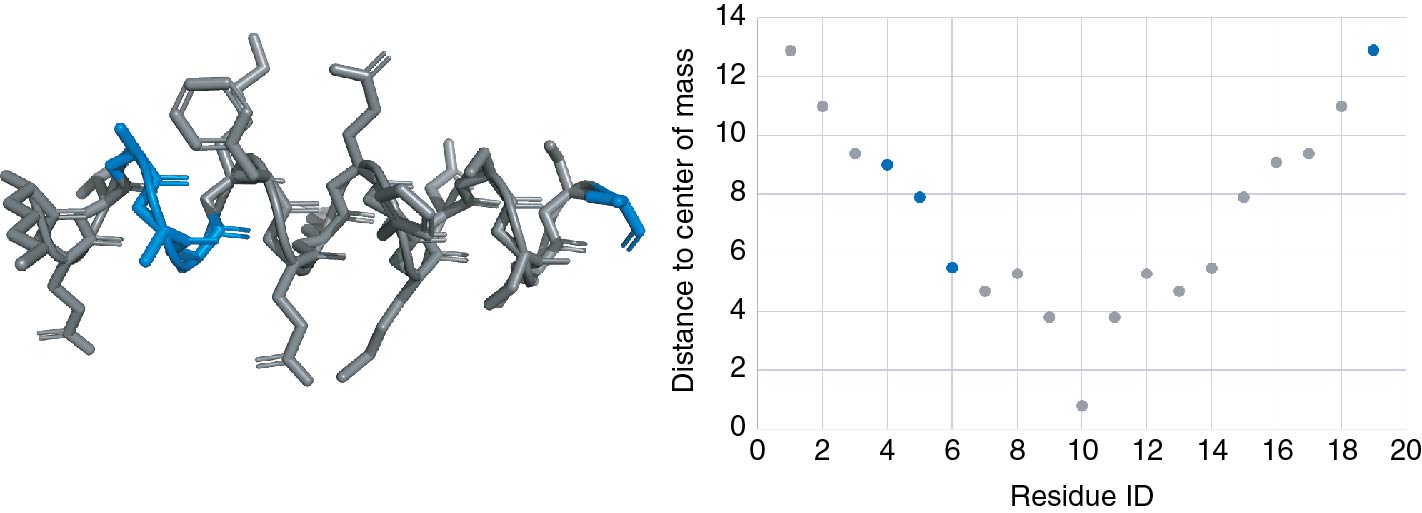
File:Fig5 Trellet JOfIntegBioinfo2018 15-2.jpg ...ure visualization and analytical plot of residue distance to the center of mass for the KETAAAKFERQHMDSSTSA peptide in two different spaces of the same env(1,422 × 513 (77 KB)) - 03:22, 6 March 2019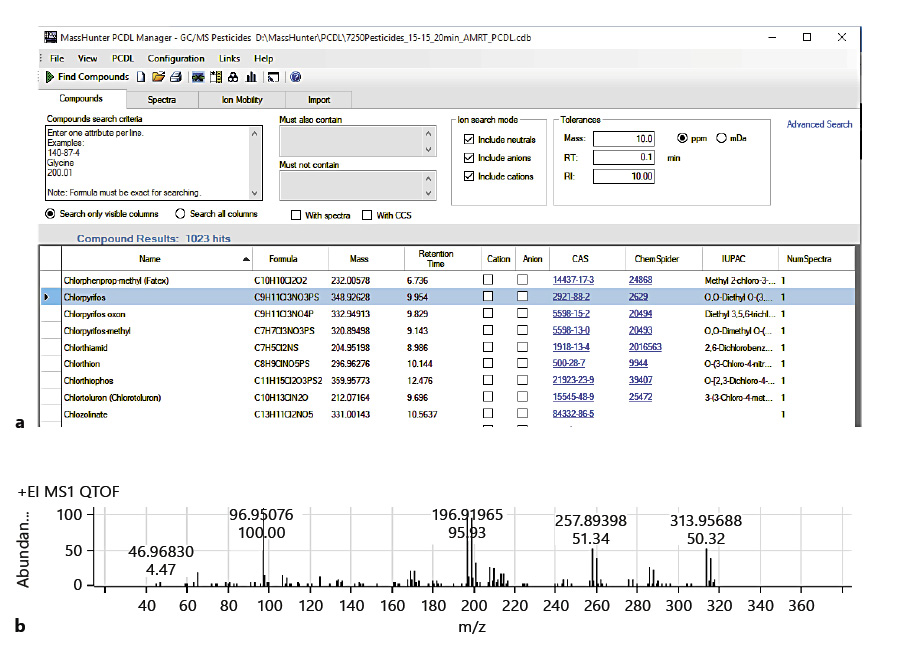
File:Fig2 Wylie MedCannCannab2020 3-1.jpg ...howing some of the content available for each entry. '''b.''' The accurate mass EI spectrum of chlorpyrifos from the PCDL.(897 × 666 (195 KB)) - 22:47, 20 December 2023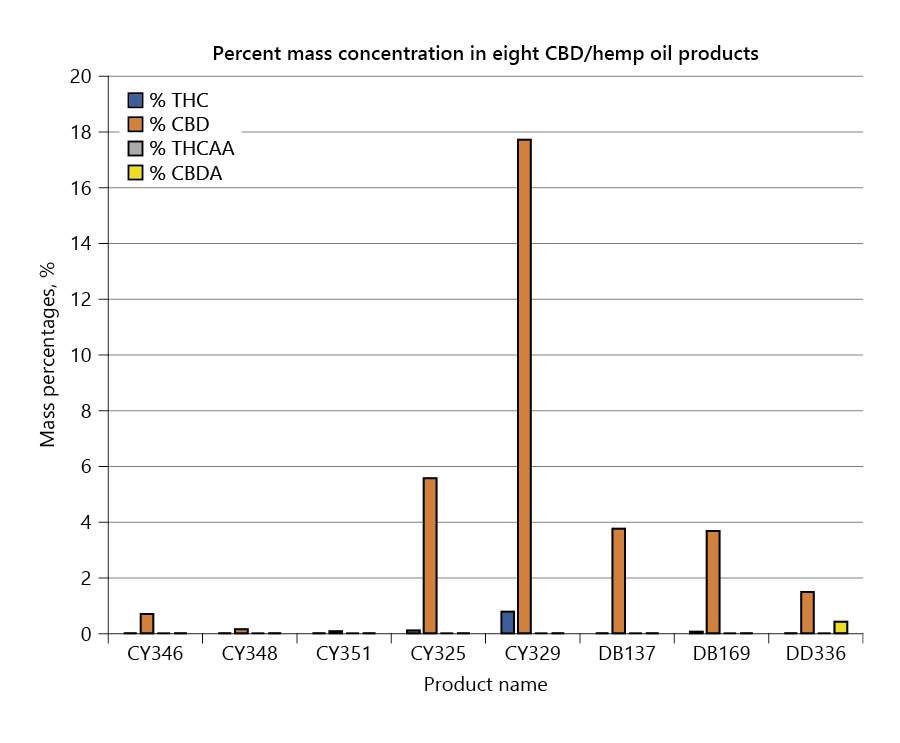
File:Fig9 ElSohly MedCannCannab2020 3-1.jpg |Description='''Fig. 9.''' Percent mass concentrations of delta-9-THC, CBD, delta-9-THCAA, and CBDA in eight CBD/he(900 × 743 (85 KB)) - 22:48, 20 December 2023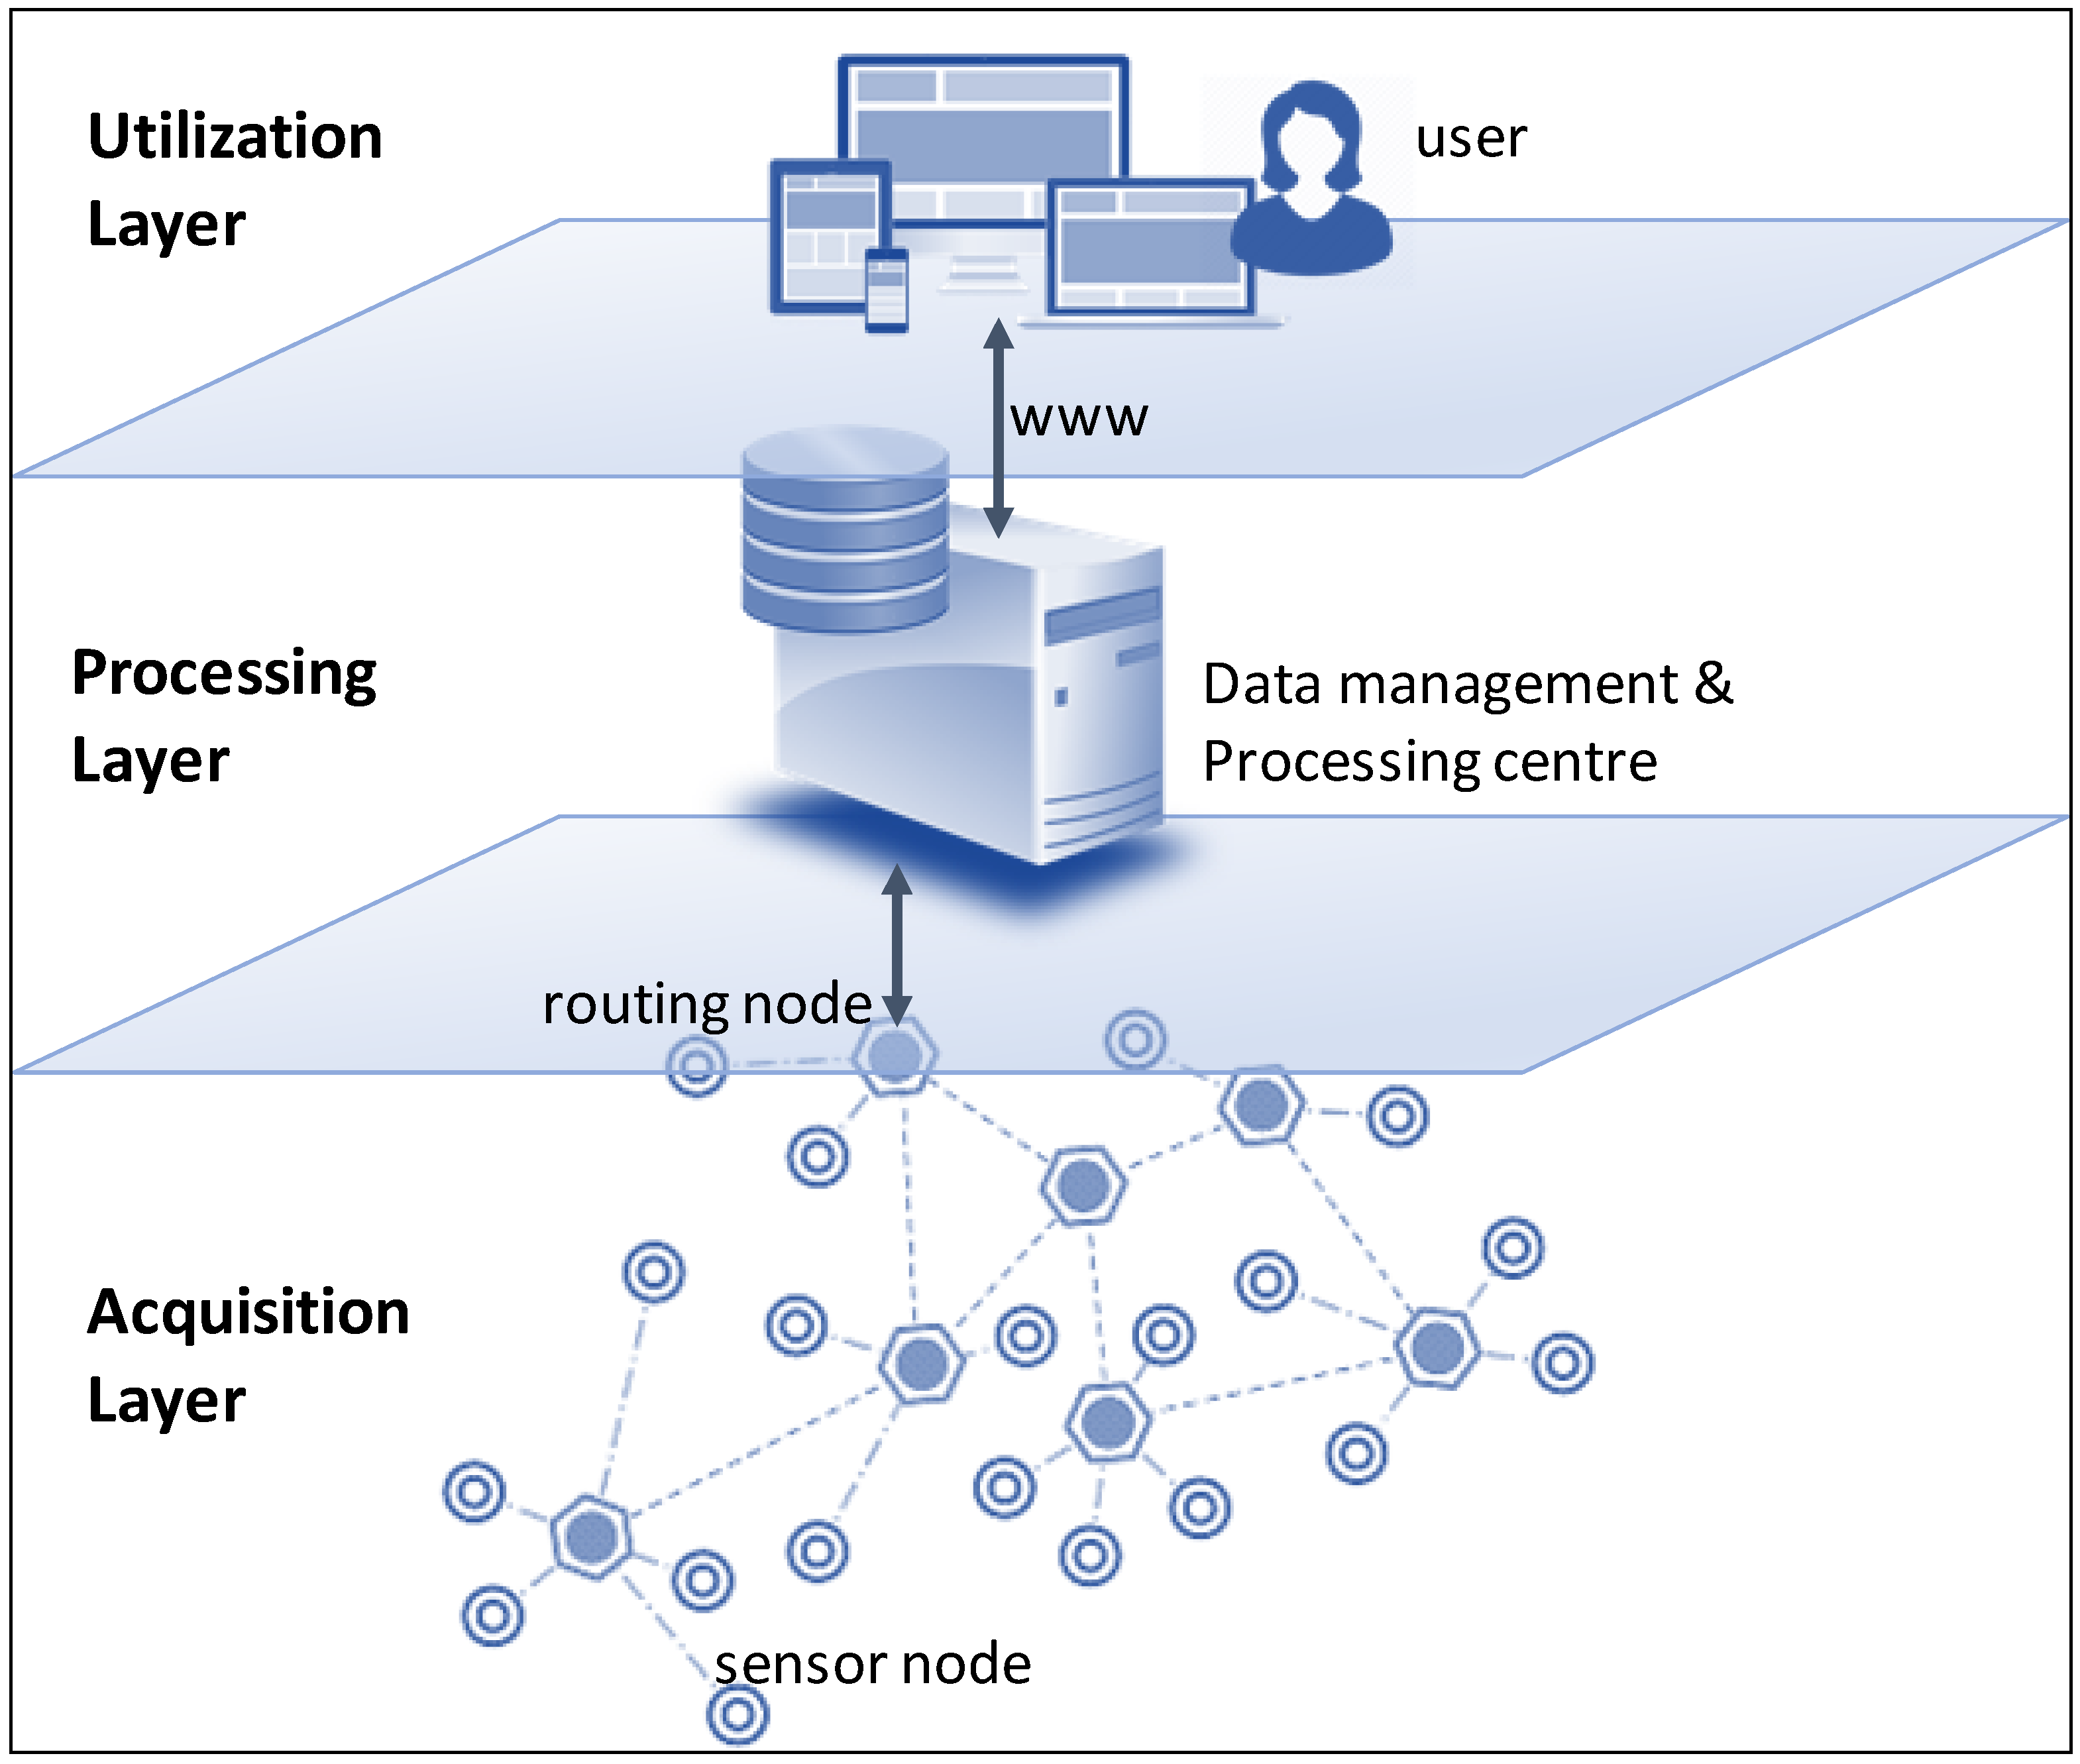
File:Fig1 Perez-Castillo Sensors2018 18-9.png ...igure 1.''' Layers in SCP environments |Source={{cite journal |title=DAQUA-MASS: An ISO 8000-61-based data quality management methodology for sensor data |(3,139 × 2,662 (366 KB)) - 23:33, 1 April 2019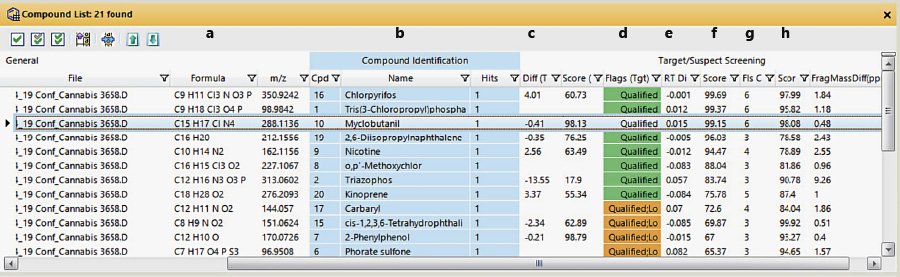
File:Fig3 Wylie MedCannCannab2020 3-1.jpg ...ula ('''a'''), the compound name ('''b'''), the difference in the measured mass of the molecular ion and the theoretical value in ppm ('''c'''), an indicat(900 × 277 (72 KB)) - 22:47, 20 December 2023


