Search results
From LIMSWiki
Jump to navigationJump to search
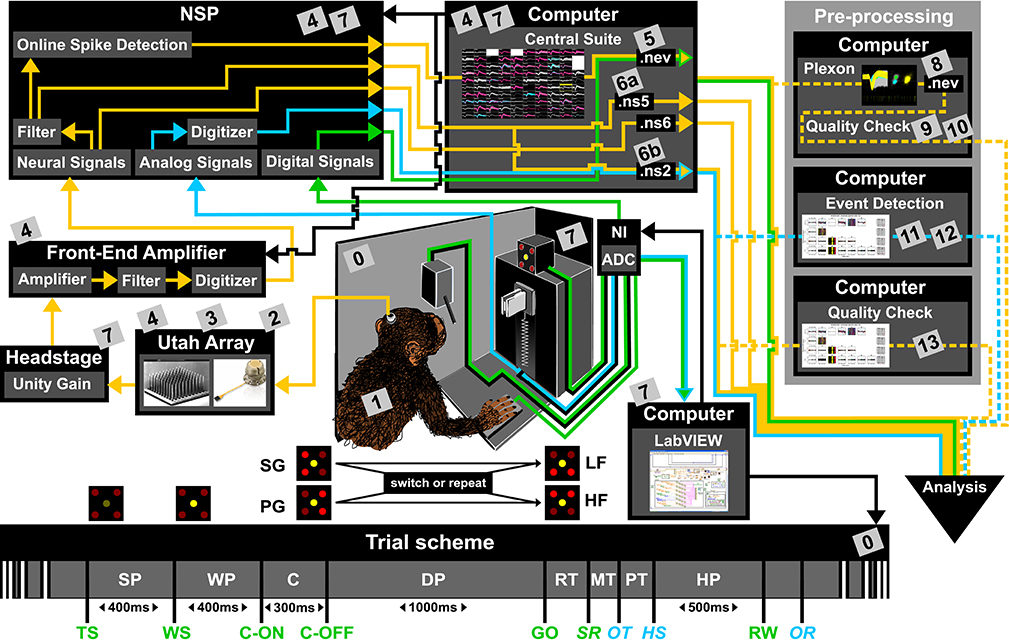
File:Fig1 Zehl FrontInNeuro2016 10.jpg ...r (timing, movement) are monitored (blue and green arrows) and controlled (black arrows) online via LabVIEW on a second setup control PC. The digitization o(1,009 × 640 (463 KB)) - 23:17, 20 December 2017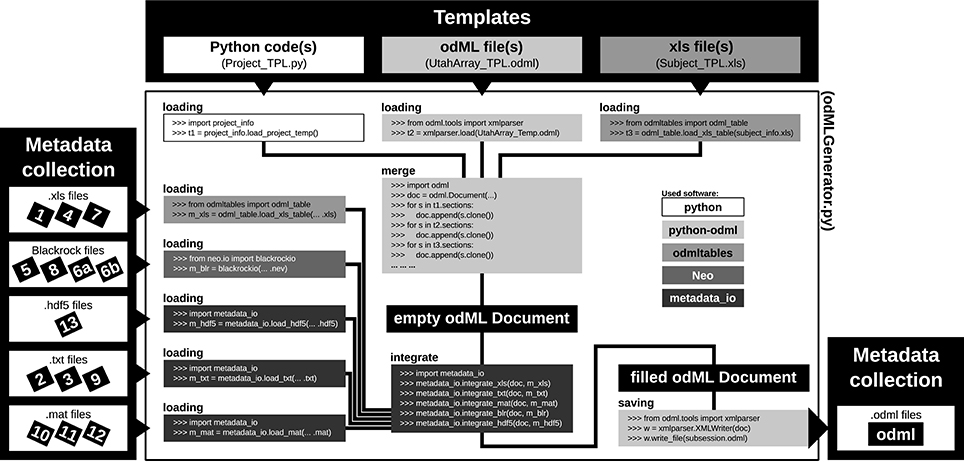
File:Fig7 Zehl FrontInNeuro2016 10.jpg ...represent the software used for the code (see legend right of center). The black colored boxes indicate files or file stages. The workflow consists of five(964 × 462 (212 KB)) - 20:45, 21 December 2017
File:Fig1 Johnson JofCannRes23 5.png ...nson, L.; Malone, M.; Paulson, E.; Swider, J.; Marelius, D.; Andersen, S.; Black, D. |volume=5 |at=29 |year=2023 |doi=10.1186/s42238-023-00197-6}} ...nson, L.; Malone, M.; Paulson, E.; Swider, J.; Marelius, D.; Andersen, S.; Black, D.(1,944 × 412 (155 KB)) - 21:11, 26 December 2023
File:Fig2 Johnson JofCannRes23 5.png ...nson, L.; Malone, M.; Paulson, E.; Swider, J.; Marelius, D.; Andersen, S.; Black, D. |volume=5 |at=29 |year=2023 |doi=10.1186/s42238-023-00197-6}} ...nson, L.; Malone, M.; Paulson, E.; Swider, J.; Marelius, D.; Andersen, S.; Black, D.(460 × 522 (74 KB)) - 21:47, 26 December 2023
File:Fig3 Johnson JofCannRes23 5.png ...nson, L.; Malone, M.; Paulson, E.; Swider, J.; Marelius, D.; Andersen, S.; Black, D. |volume=5 |at=29 |year=2023 |doi=10.1186/s42238-023-00197-6}} ...nson, L.; Malone, M.; Paulson, E.; Swider, J.; Marelius, D.; Andersen, S.; Black, D.(1,944 × 986 (388 KB)) - 22:30, 26 December 2023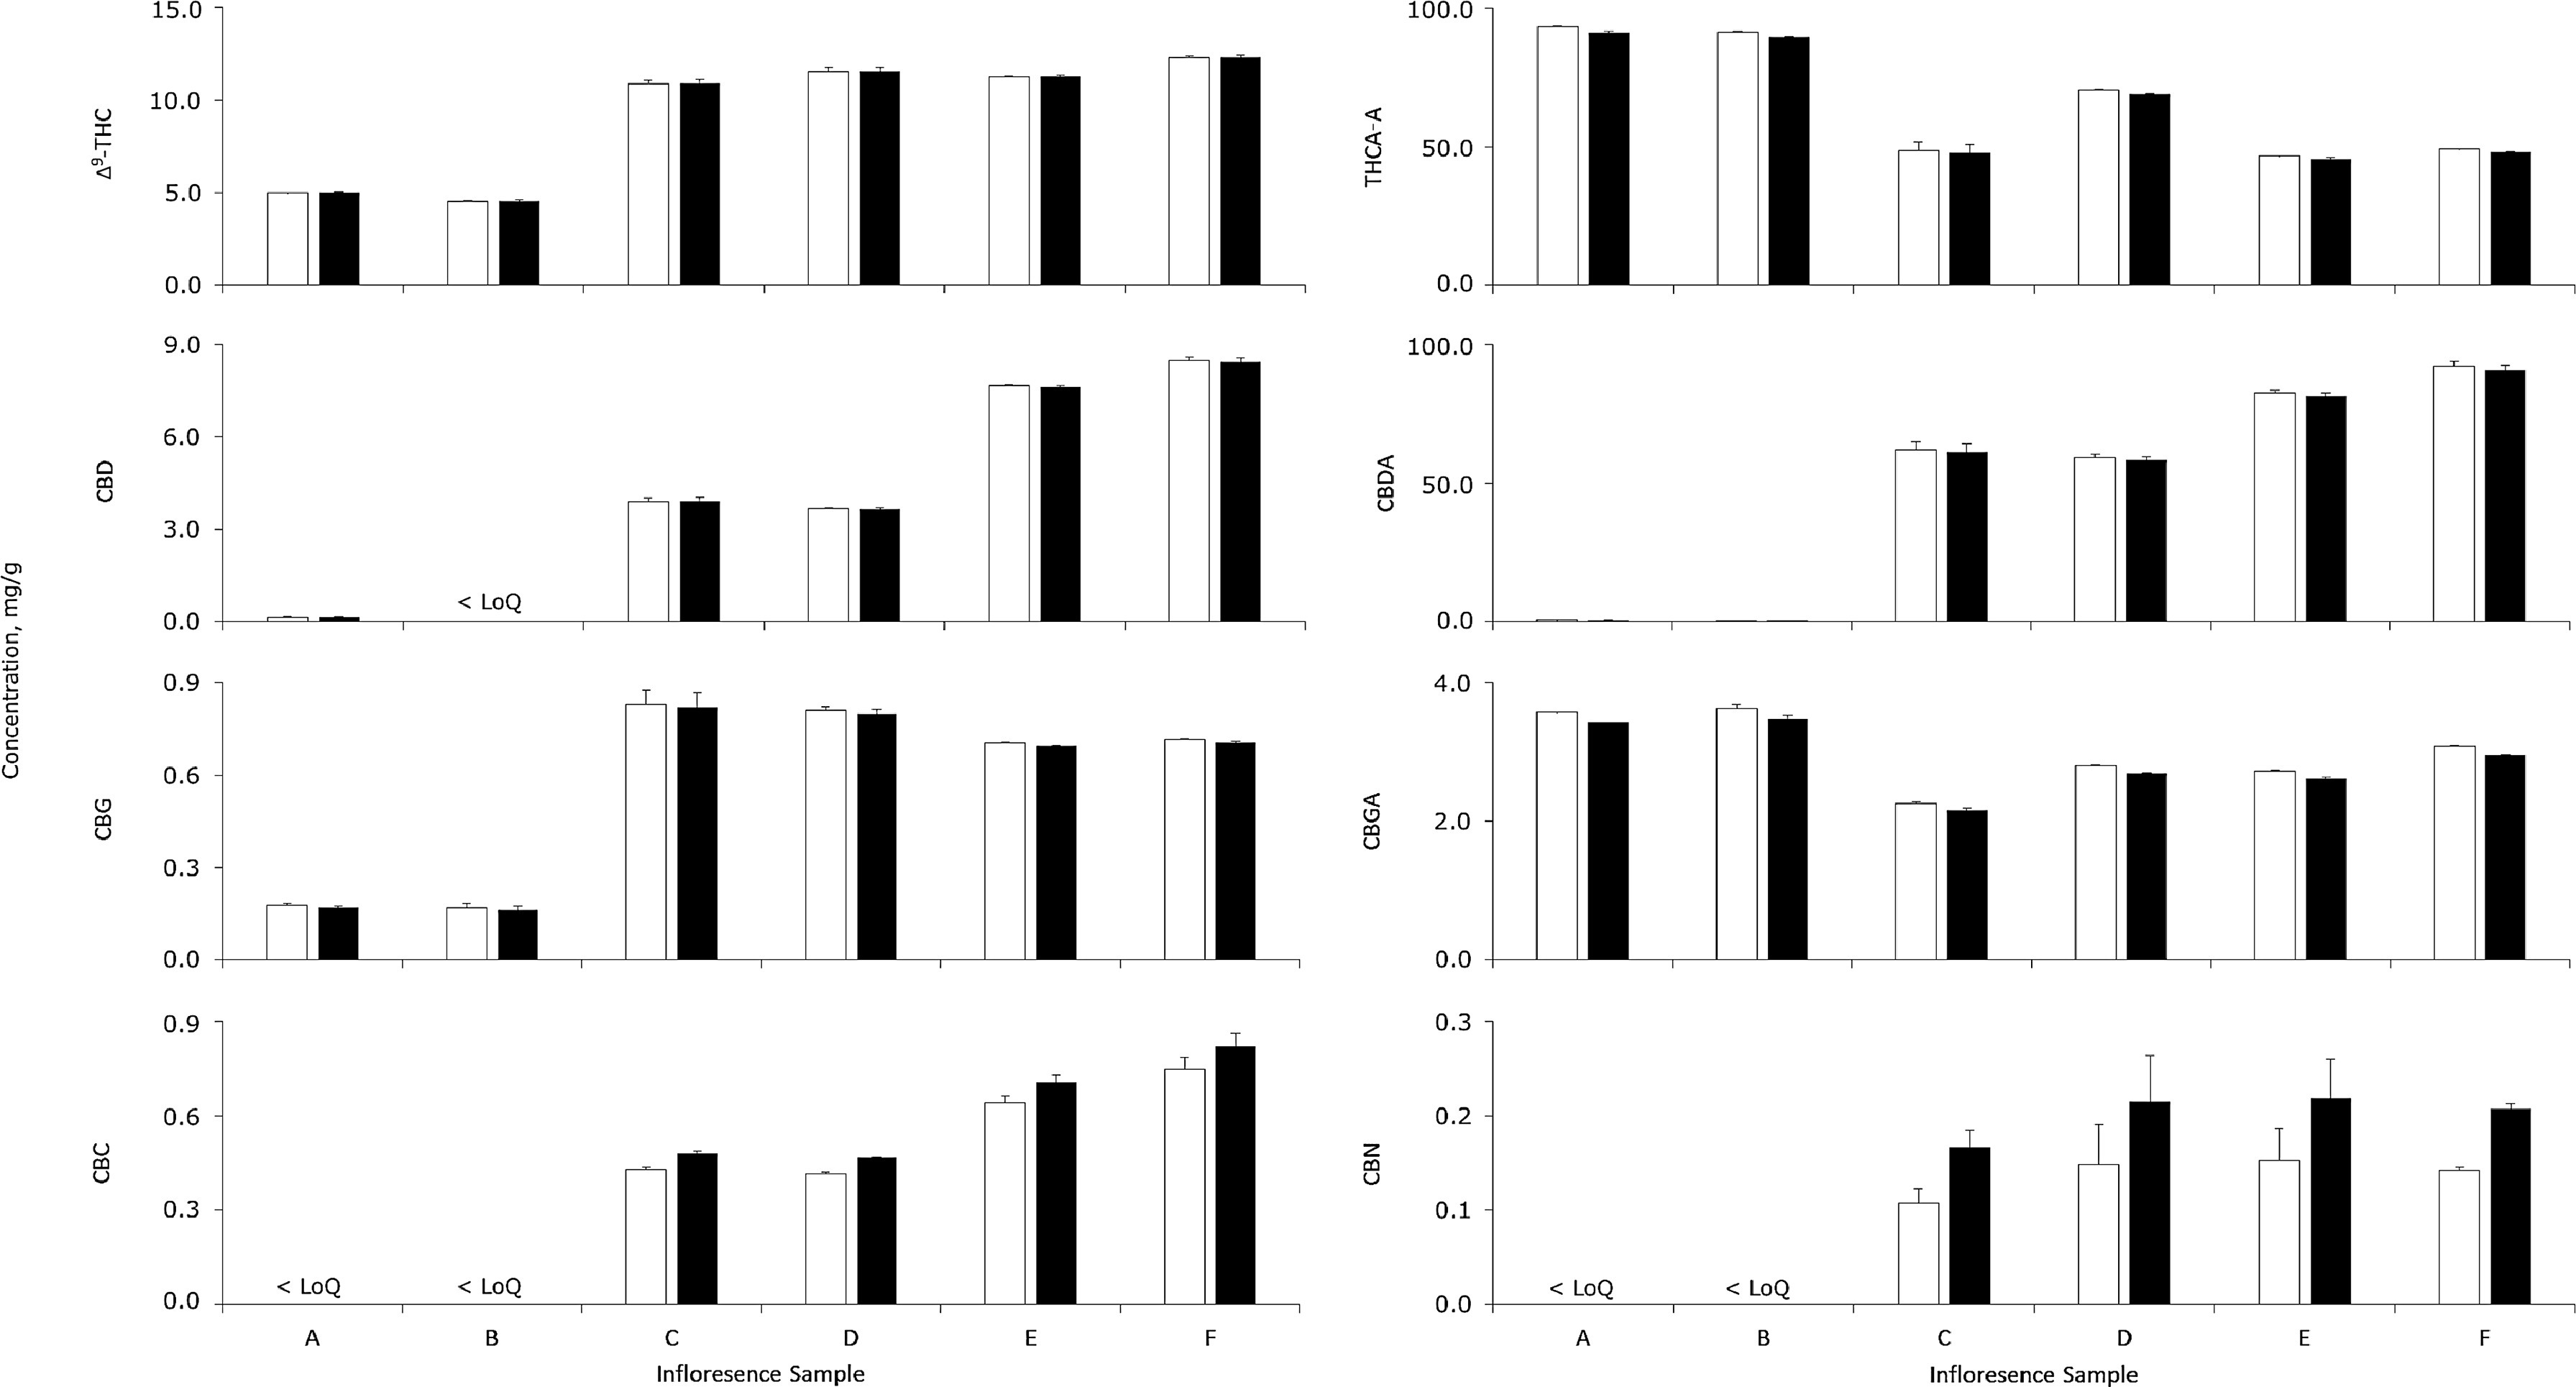
File:Fig3 Hall TalantaOpen2022 5.jpg ...eported by the multipoint calibration (white) against the RRF calibration (black); mean ± sample standard deviation (''n'' = 2 × 2, sample preparations ×(3,583 × 1,929 (292 KB)) - 22:03, 26 December 2023
File:Fig3 Garza BMCBioinformatics2016 17.gif .... The place P<sub>0</sub> expects and contains one token, represented by a black dot, and is thus enabled. It follows that P<sub>0</sub> is the starting pla(471 × 248 (16 KB)) - 21:17, 13 June 2016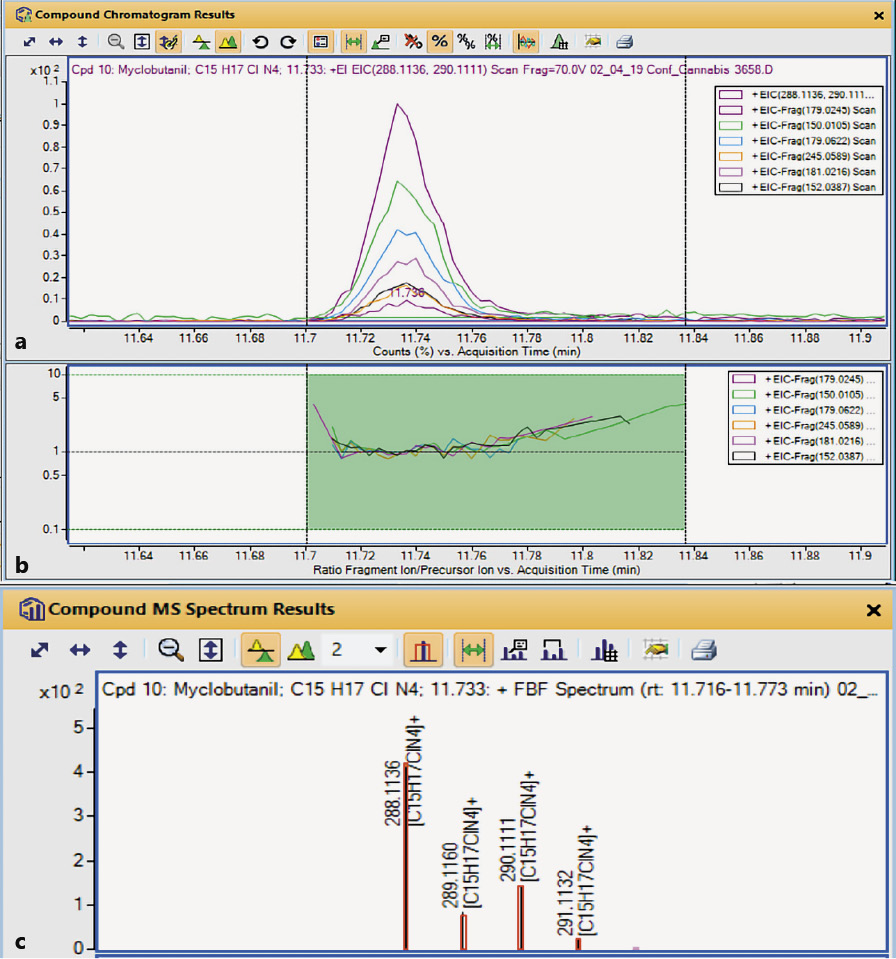
File:Fig4 Wylie MedCannCannab2020 3-1.jpg ...rizontal straight line. '''c.''' The isotope pattern of the molecular ion (black vertical lines) compared to the theoretical pattern (red boxes).(896 × 959 (262 KB)) - 22:47, 20 December 2023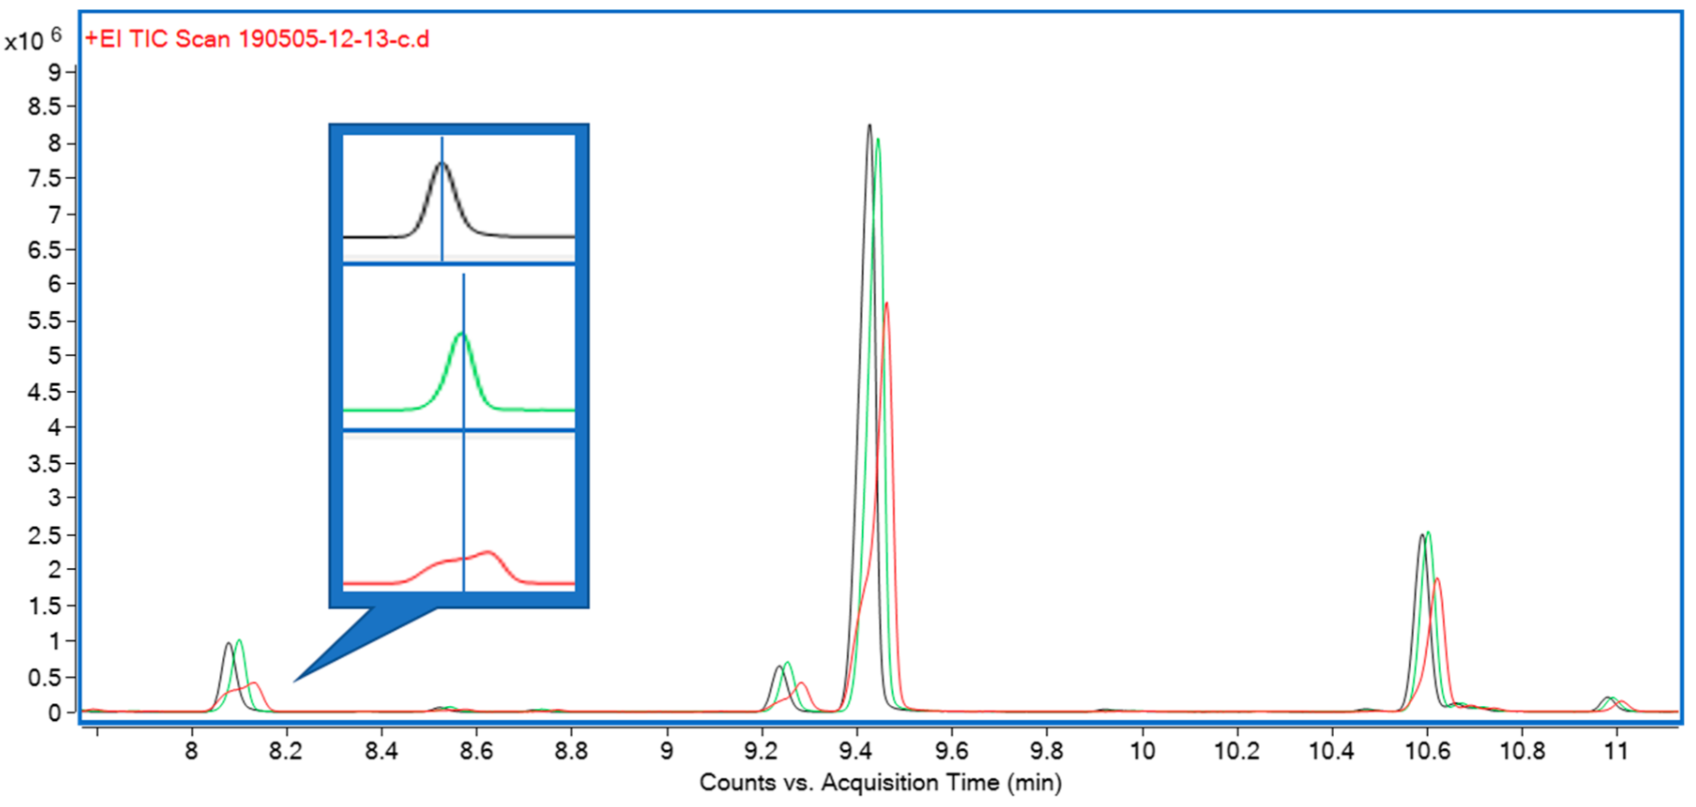
File:Fig3 Krill Metabolites2020 10-7.png ...early eluting compounds using three different injection solvents: hexane (black), ethyl acetate (green), isopropanol (red). Callout: enlarged detail of pea(1,696 × 807 (158 KB)) - 22:47, 20 December 2023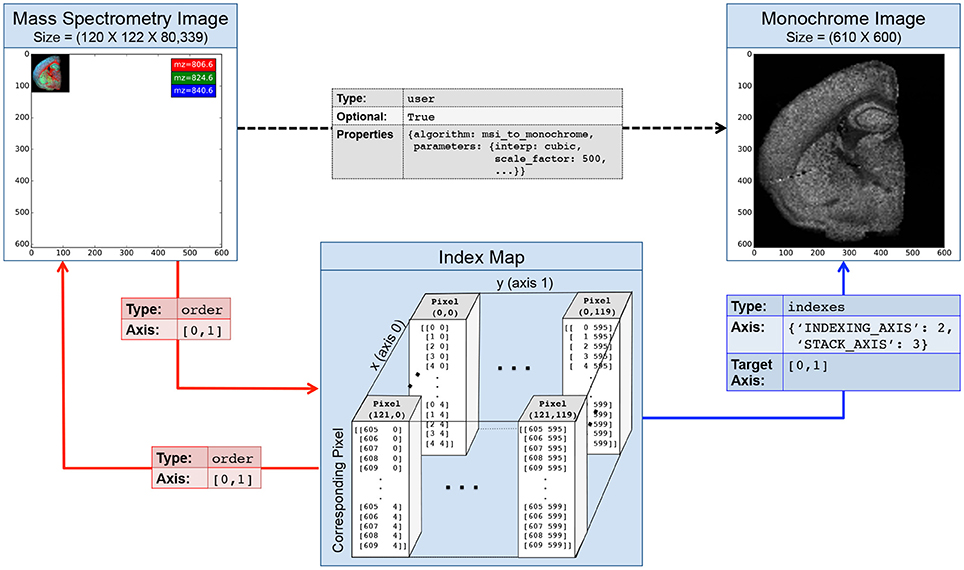
File:Fig4 Rubel FInNeuroinformatics2016 10.jpg ...ccess the image. Optionally, we may create a fourth ''user'' relationship (black arrow) to further characterize the semantic relationship between the derive(964 × 570 (257 KB)) - 21:47, 20 February 2017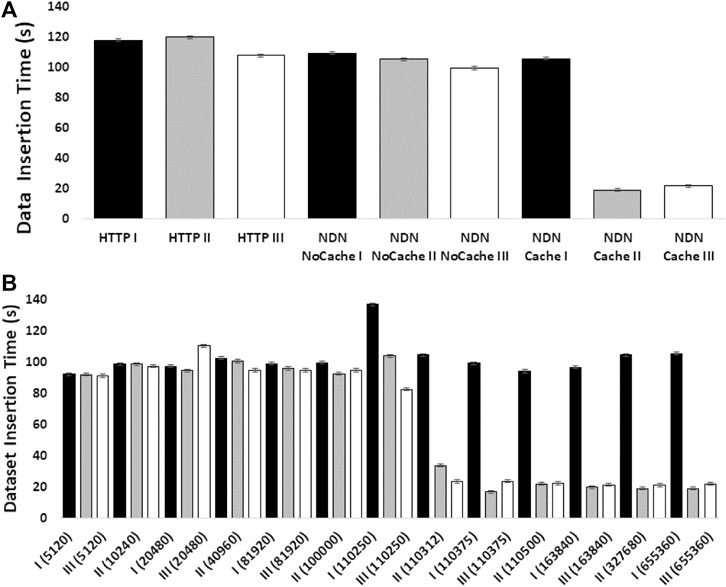
File:Fig4 Ogle FrontBigData2021 4.jpg ...0:167.8 Mb, SRR5263231:167.9 Mb) was sequentially transferred three times (black bars [transfer I], gray bars [transfer II], white bars [transfer III]) for(726 × 587 (58 KB)) - 22:30, 19 March 2021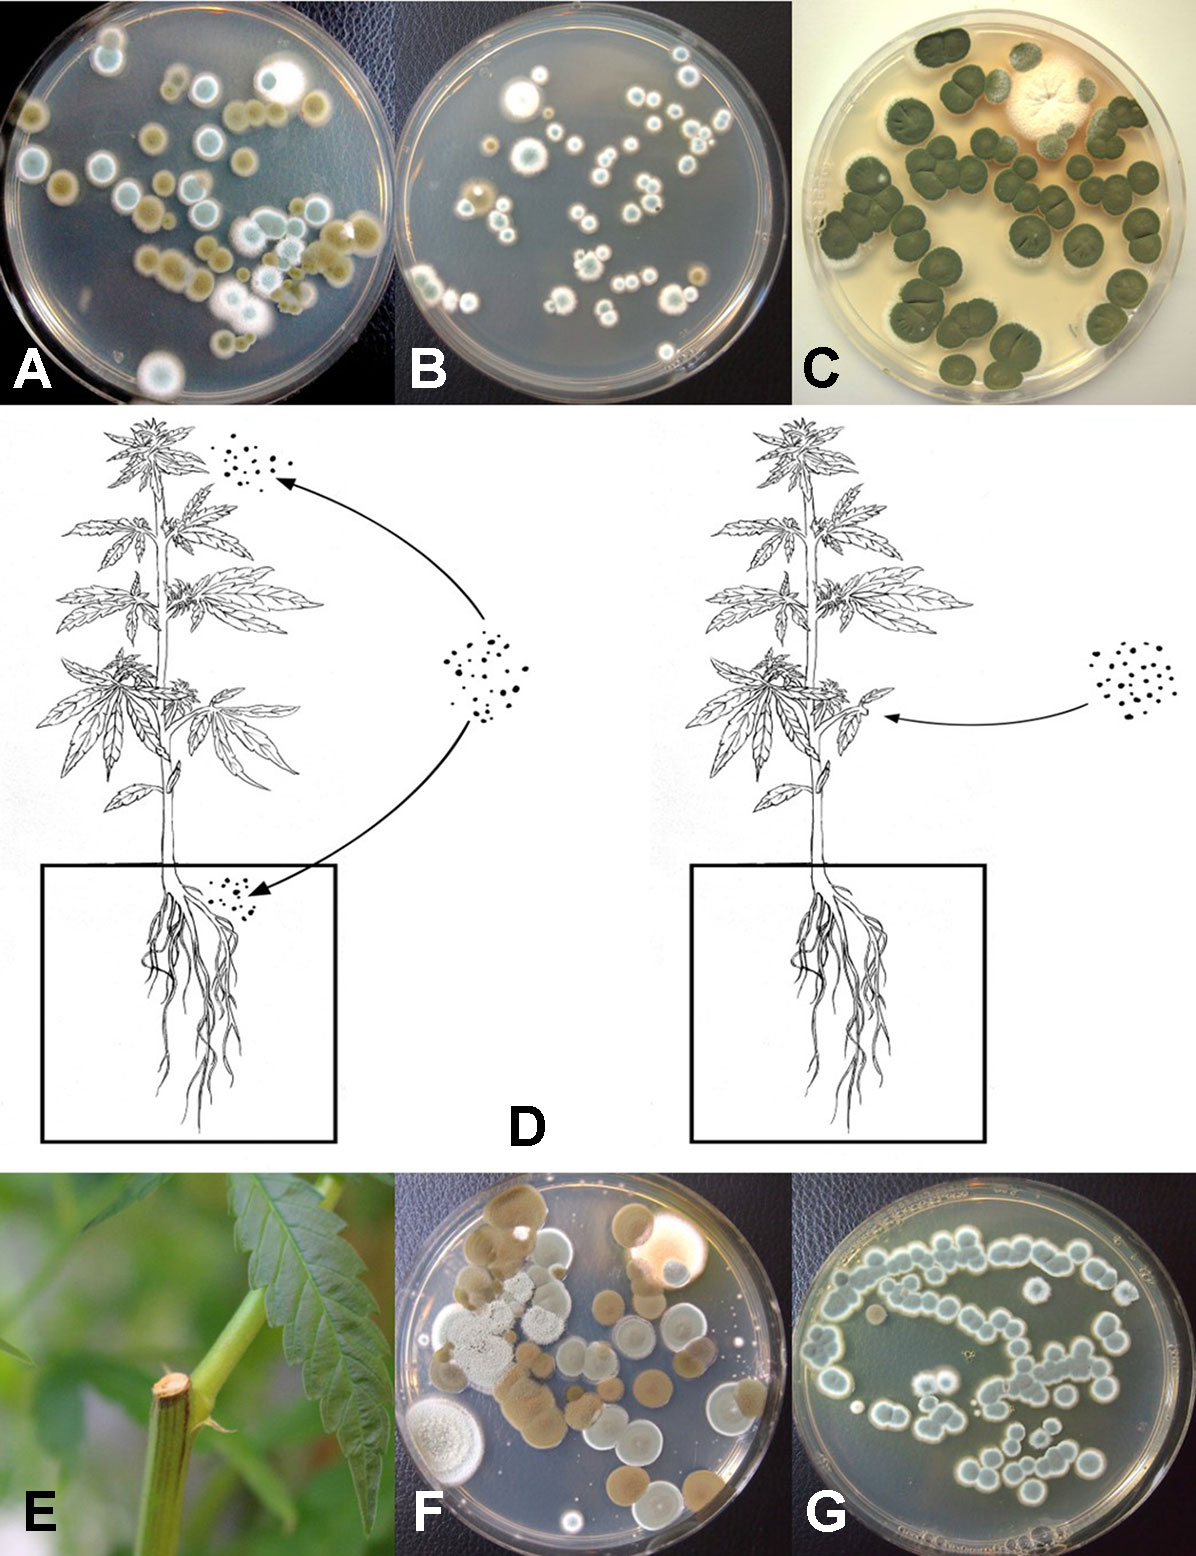
File:Fig8 Punja FrontPlantSci2019 10.jpg ...under laboratory conditions for five days. Both ''Cladosporium'' (brown to black colonies) and ''Penicillium'' (blue-green colonies) were observed growing o(1,196 × 1,556 (278 KB)) - 23:05, 26 December 2023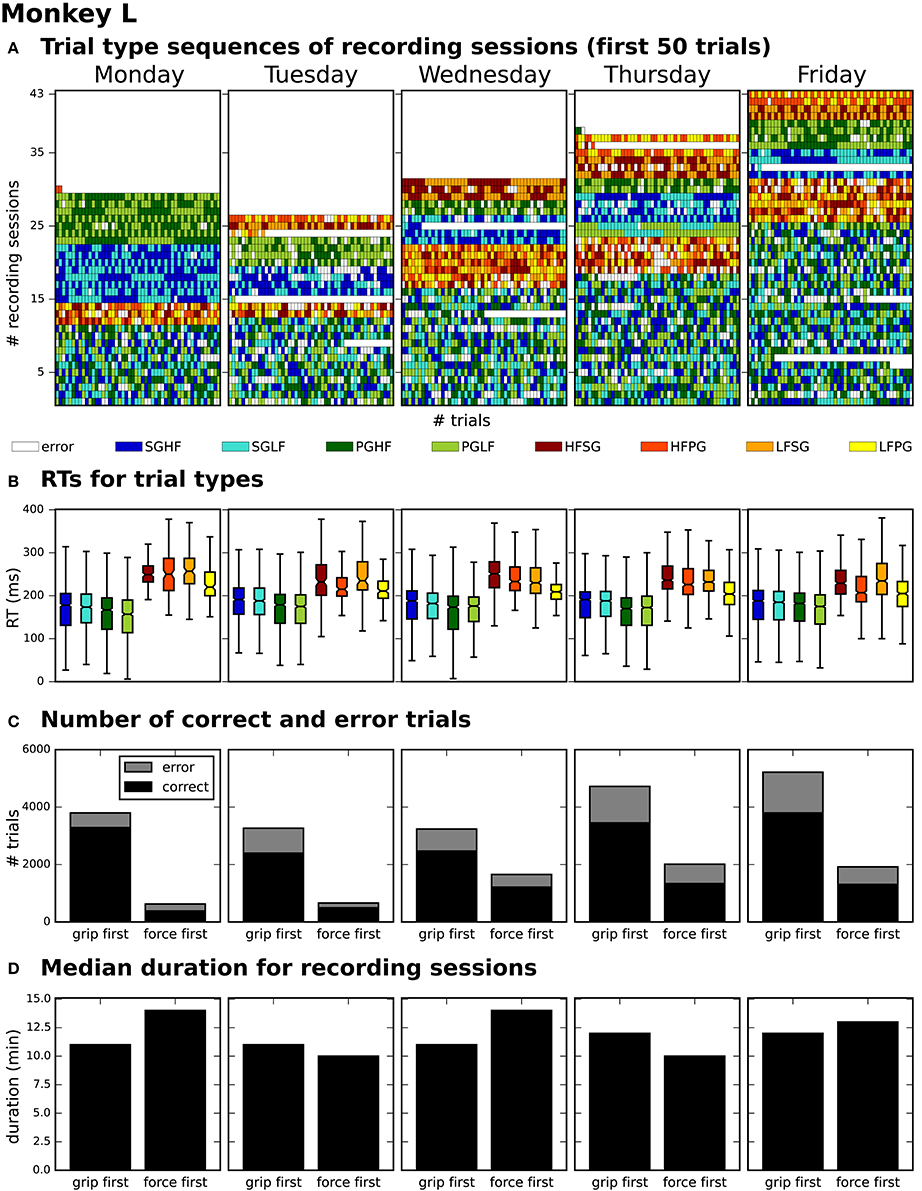
File:Fig3 Zehl FrontInNeuro2016 10.jpg ...all sessions differentiating between correct and error trials (colored in black and gray) and between sessions where the monkey was first informed about th(922 × 1,191 (791 KB)) - 00:00, 21 December 2017
File:Fig3 Karim JofKSUScience2022 34-2.jpg |Description='''Fig 3.''' Black box of system structure. The relationship and the communication process bet(2,362 × 554 (94 KB)) - 20:27, 4 July 2022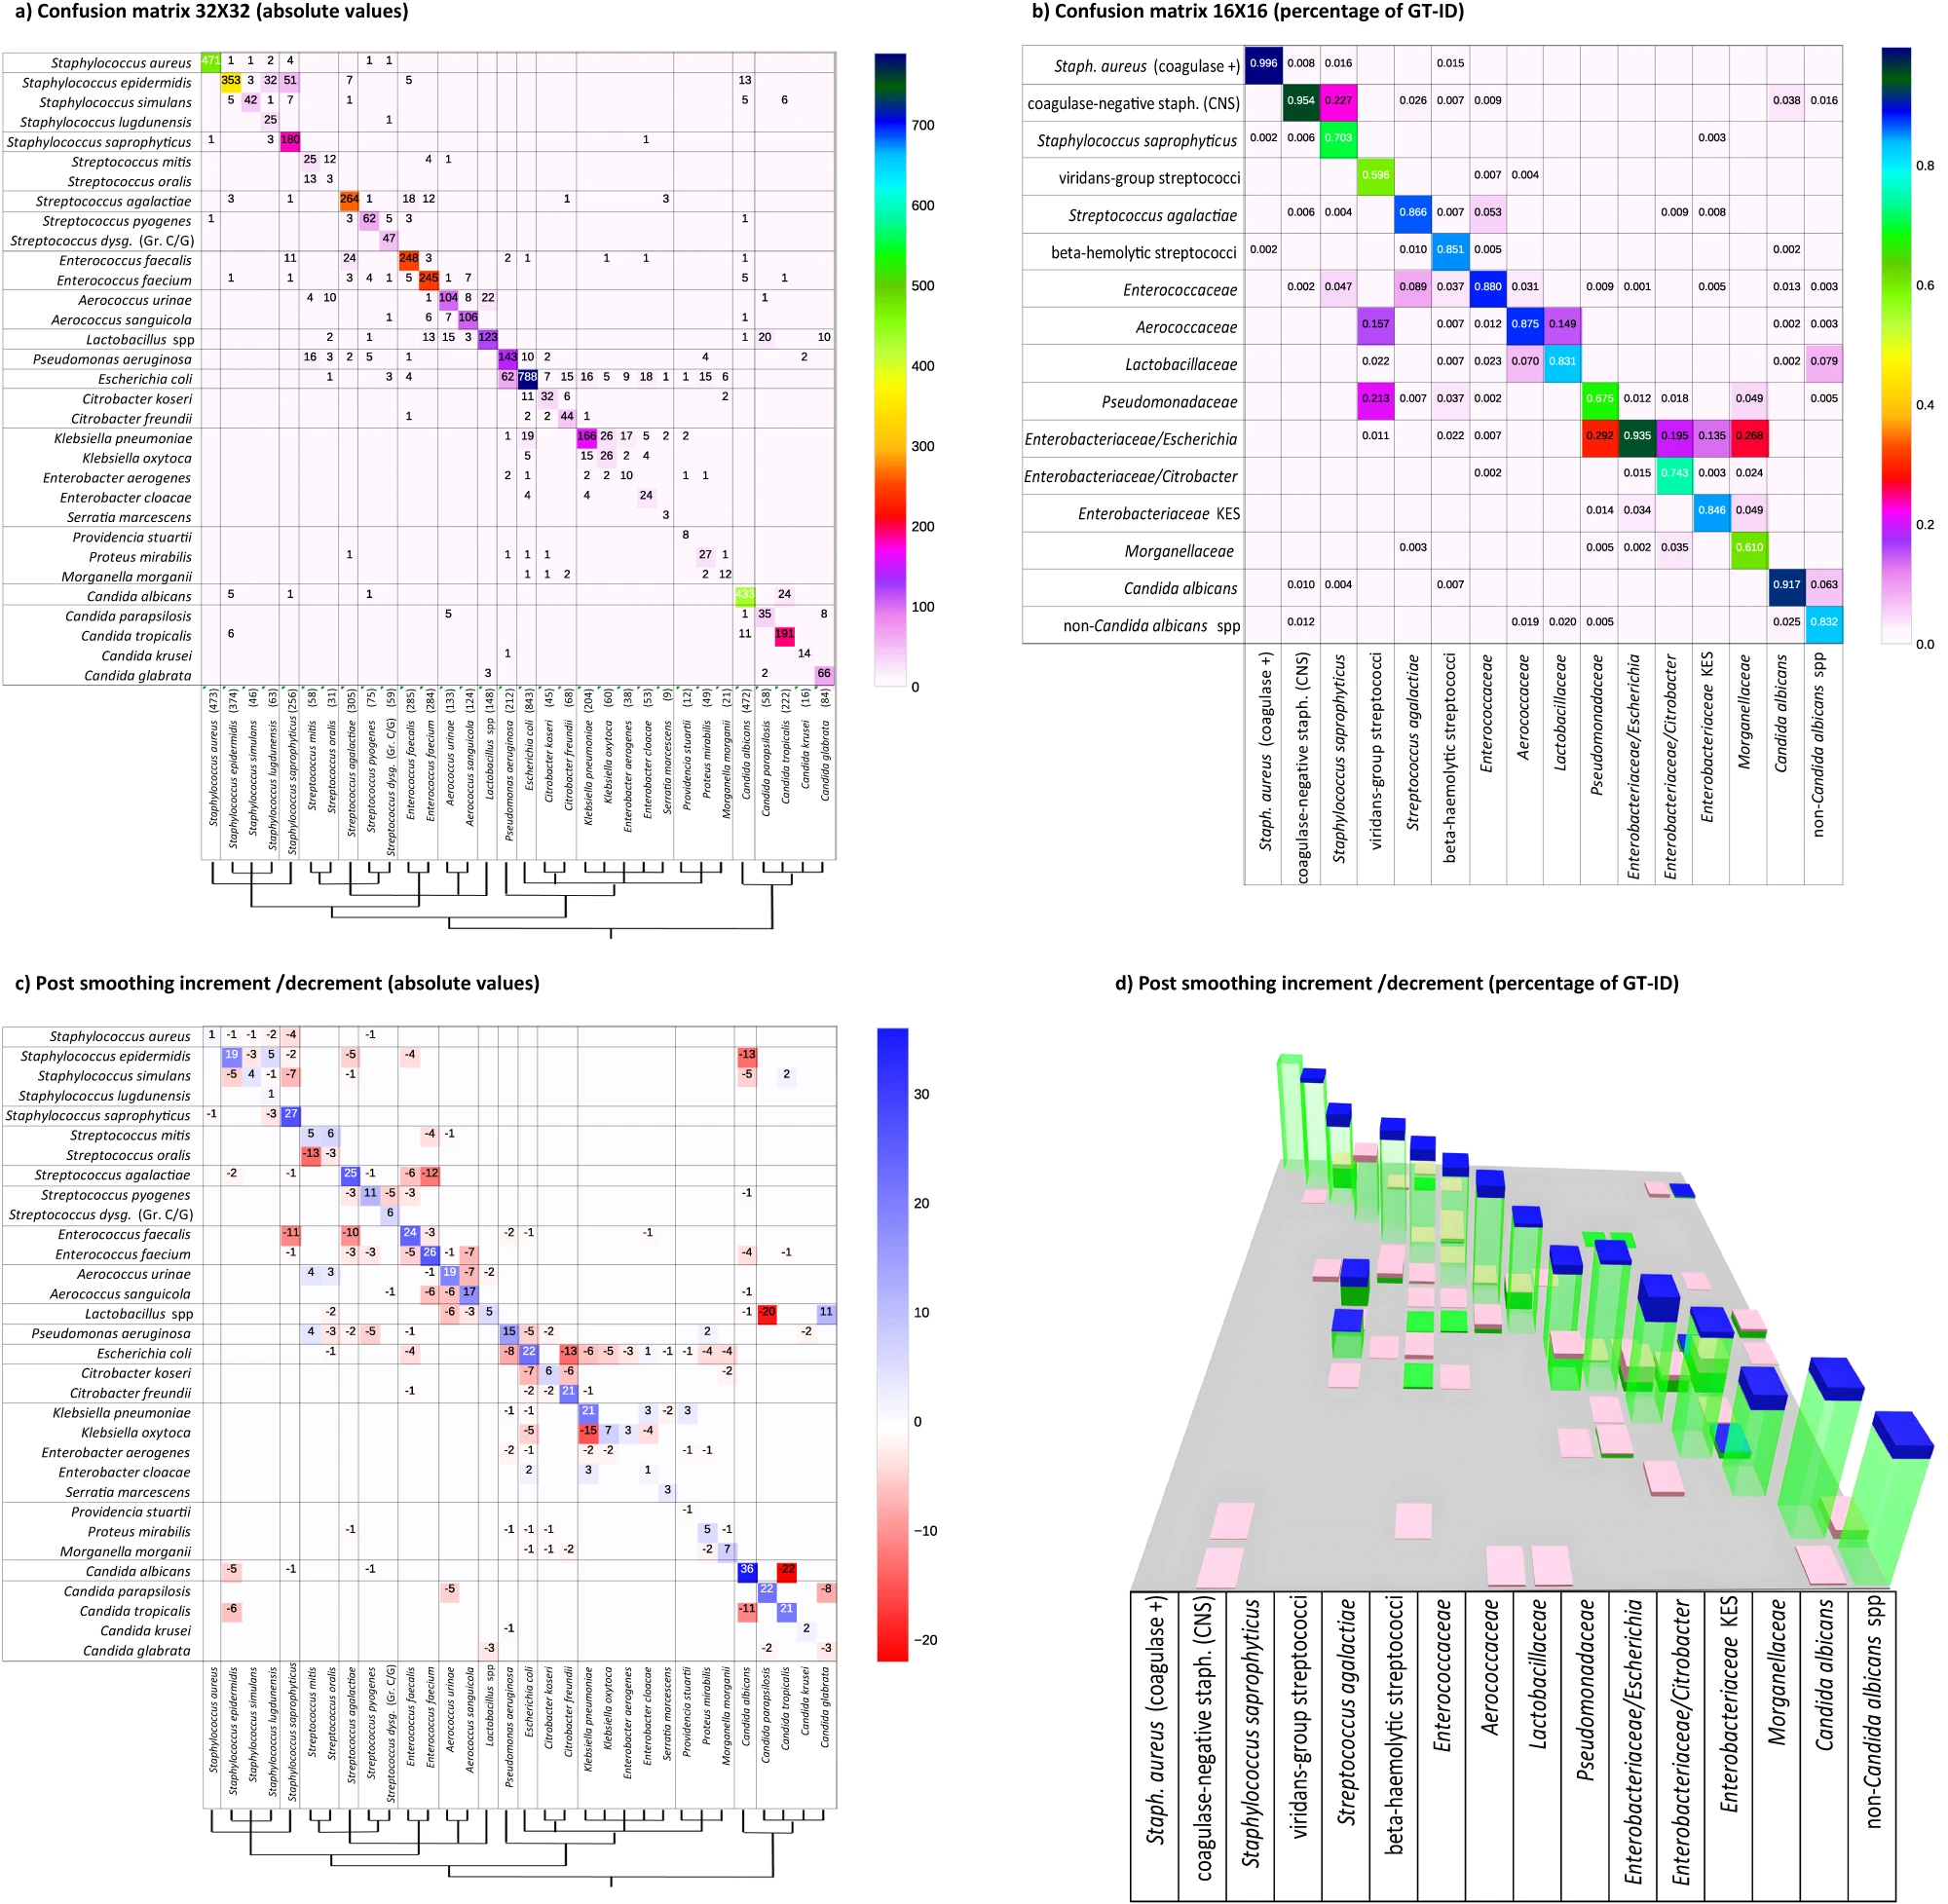
File:Fig3 Signoroni NatComm23 14.png ...ID (in absolute value). Phylogenetic group subdivisions are indicated with black lines. '''b''' 16 × 16 confusion matrix for single colony phylogenic g(2,000 × 1,955 (1.73 MB)) - 17:06, 3 March 2024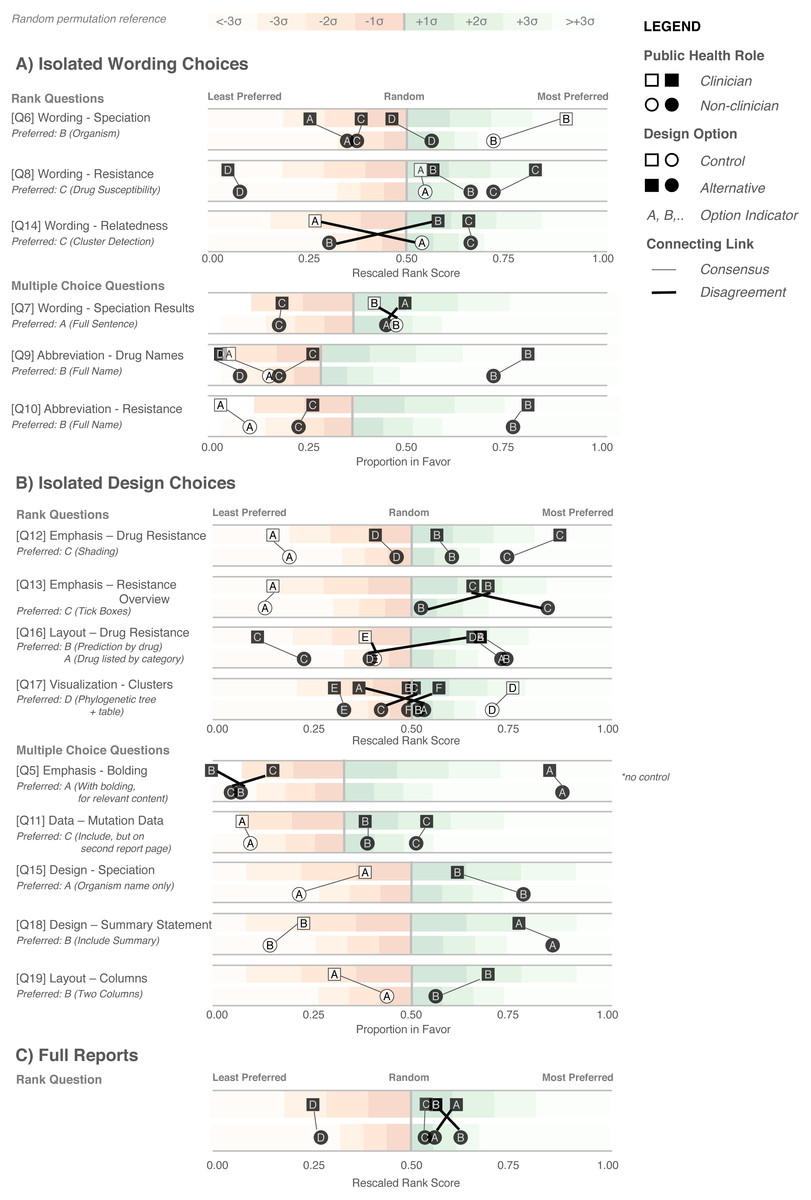
File:Fig6 Crisan PeerJ2018 6.jpg ...inal report (white) or an alternative design devised in the design sprint (black). Lines connect options between clinician and non-clinicians preferences, w(811 × 1,200 (169 KB)) - 20:15, 15 February 2018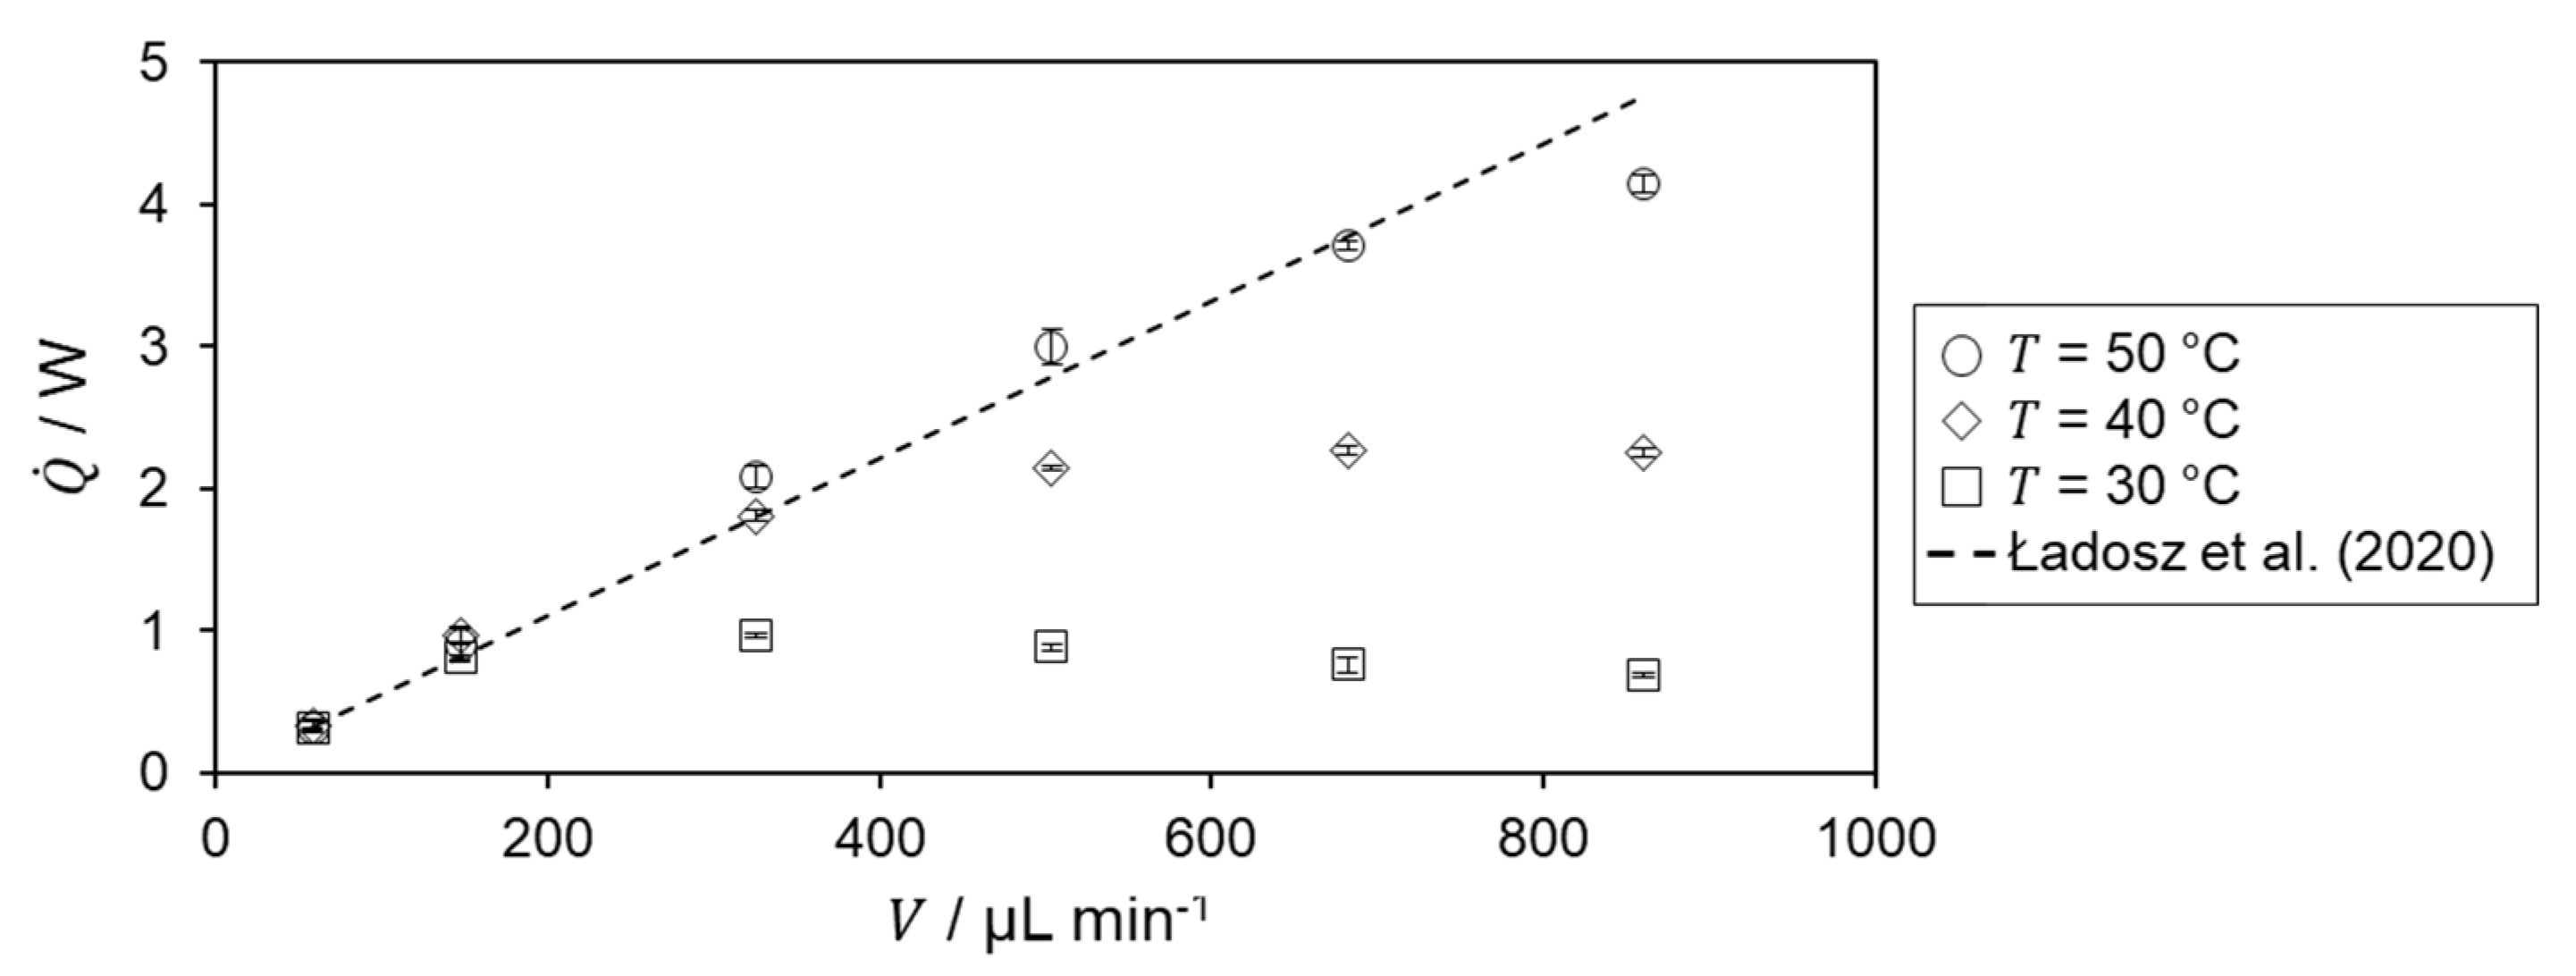
File:Fig6 Frede Processes23 11-1.png ...ic flow rate. Literature value by Ładosz ''et al.'' is indicated by dashed black line.(2,882 × 1,092 (255 KB)) - 20:59, 19 April 2023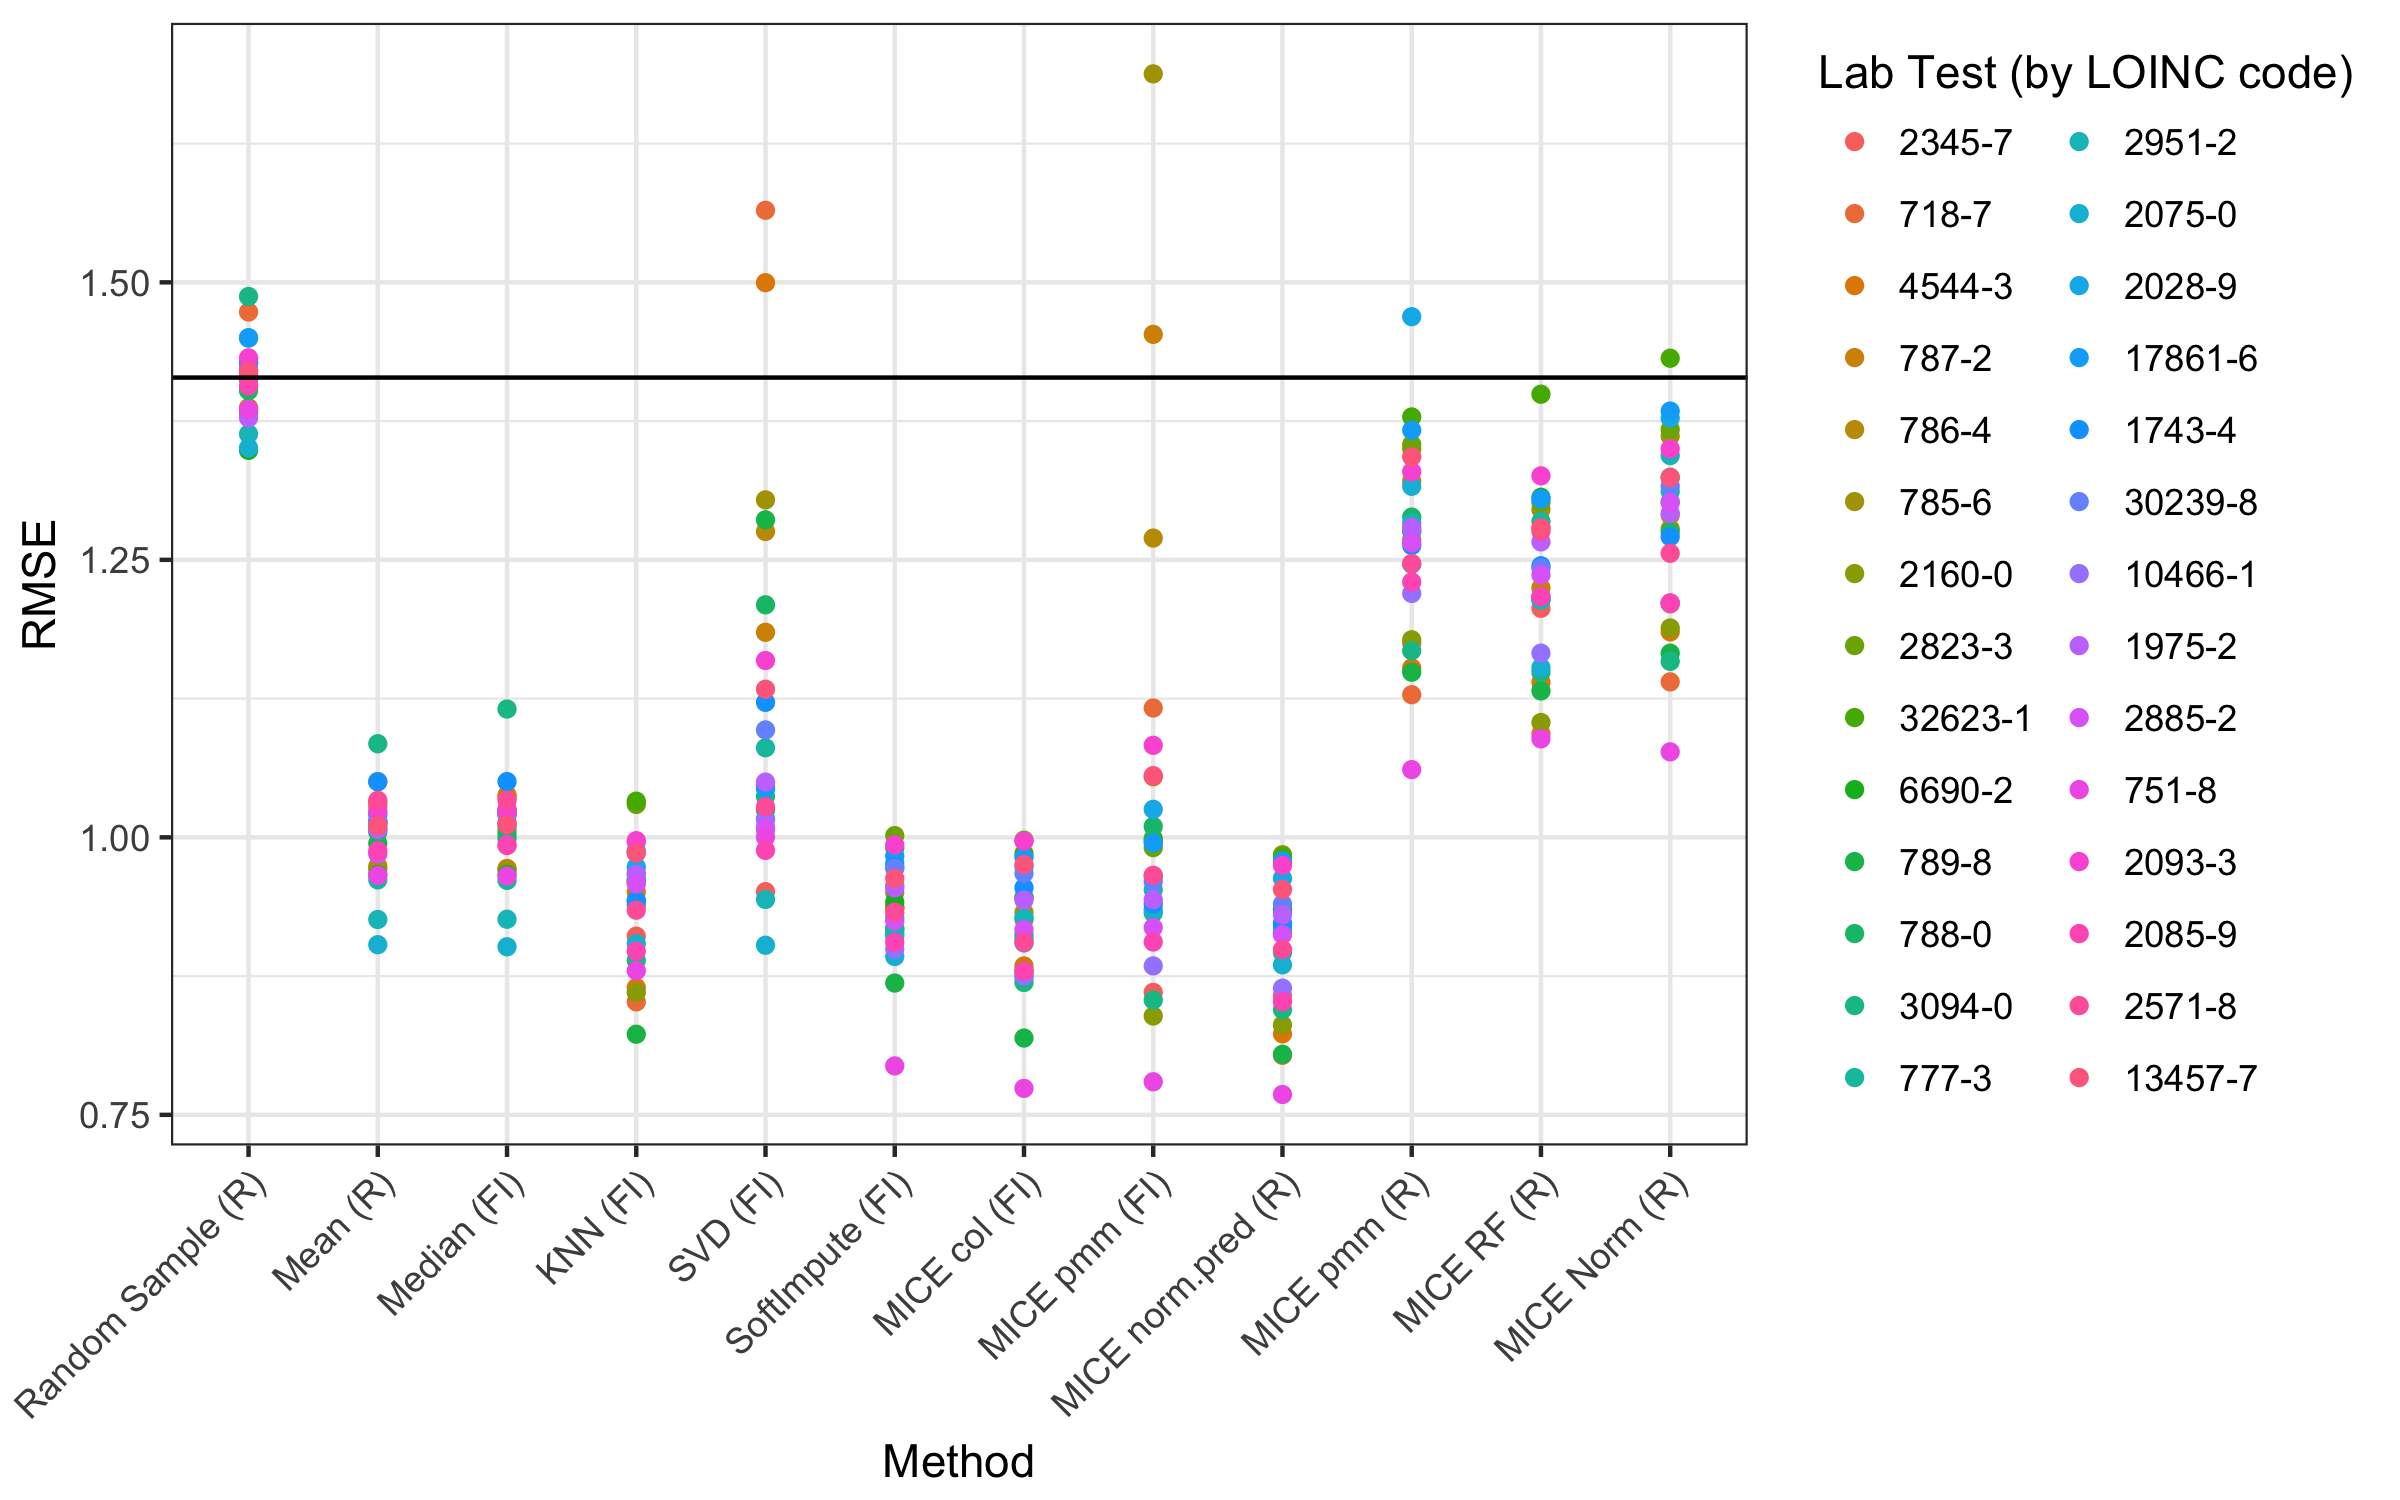
File:Fig5 Beaulieu-JonesJMIRMedInfo2018 6-1.png ...nds to a Logical Observation Identifiers Names and Codes (LOINC) code. The black line shows the theoretical error from random sampling. FI: fancyimpute; KNN(2,400 × 1,500 (330 KB)) - 20:31, 6 March 2018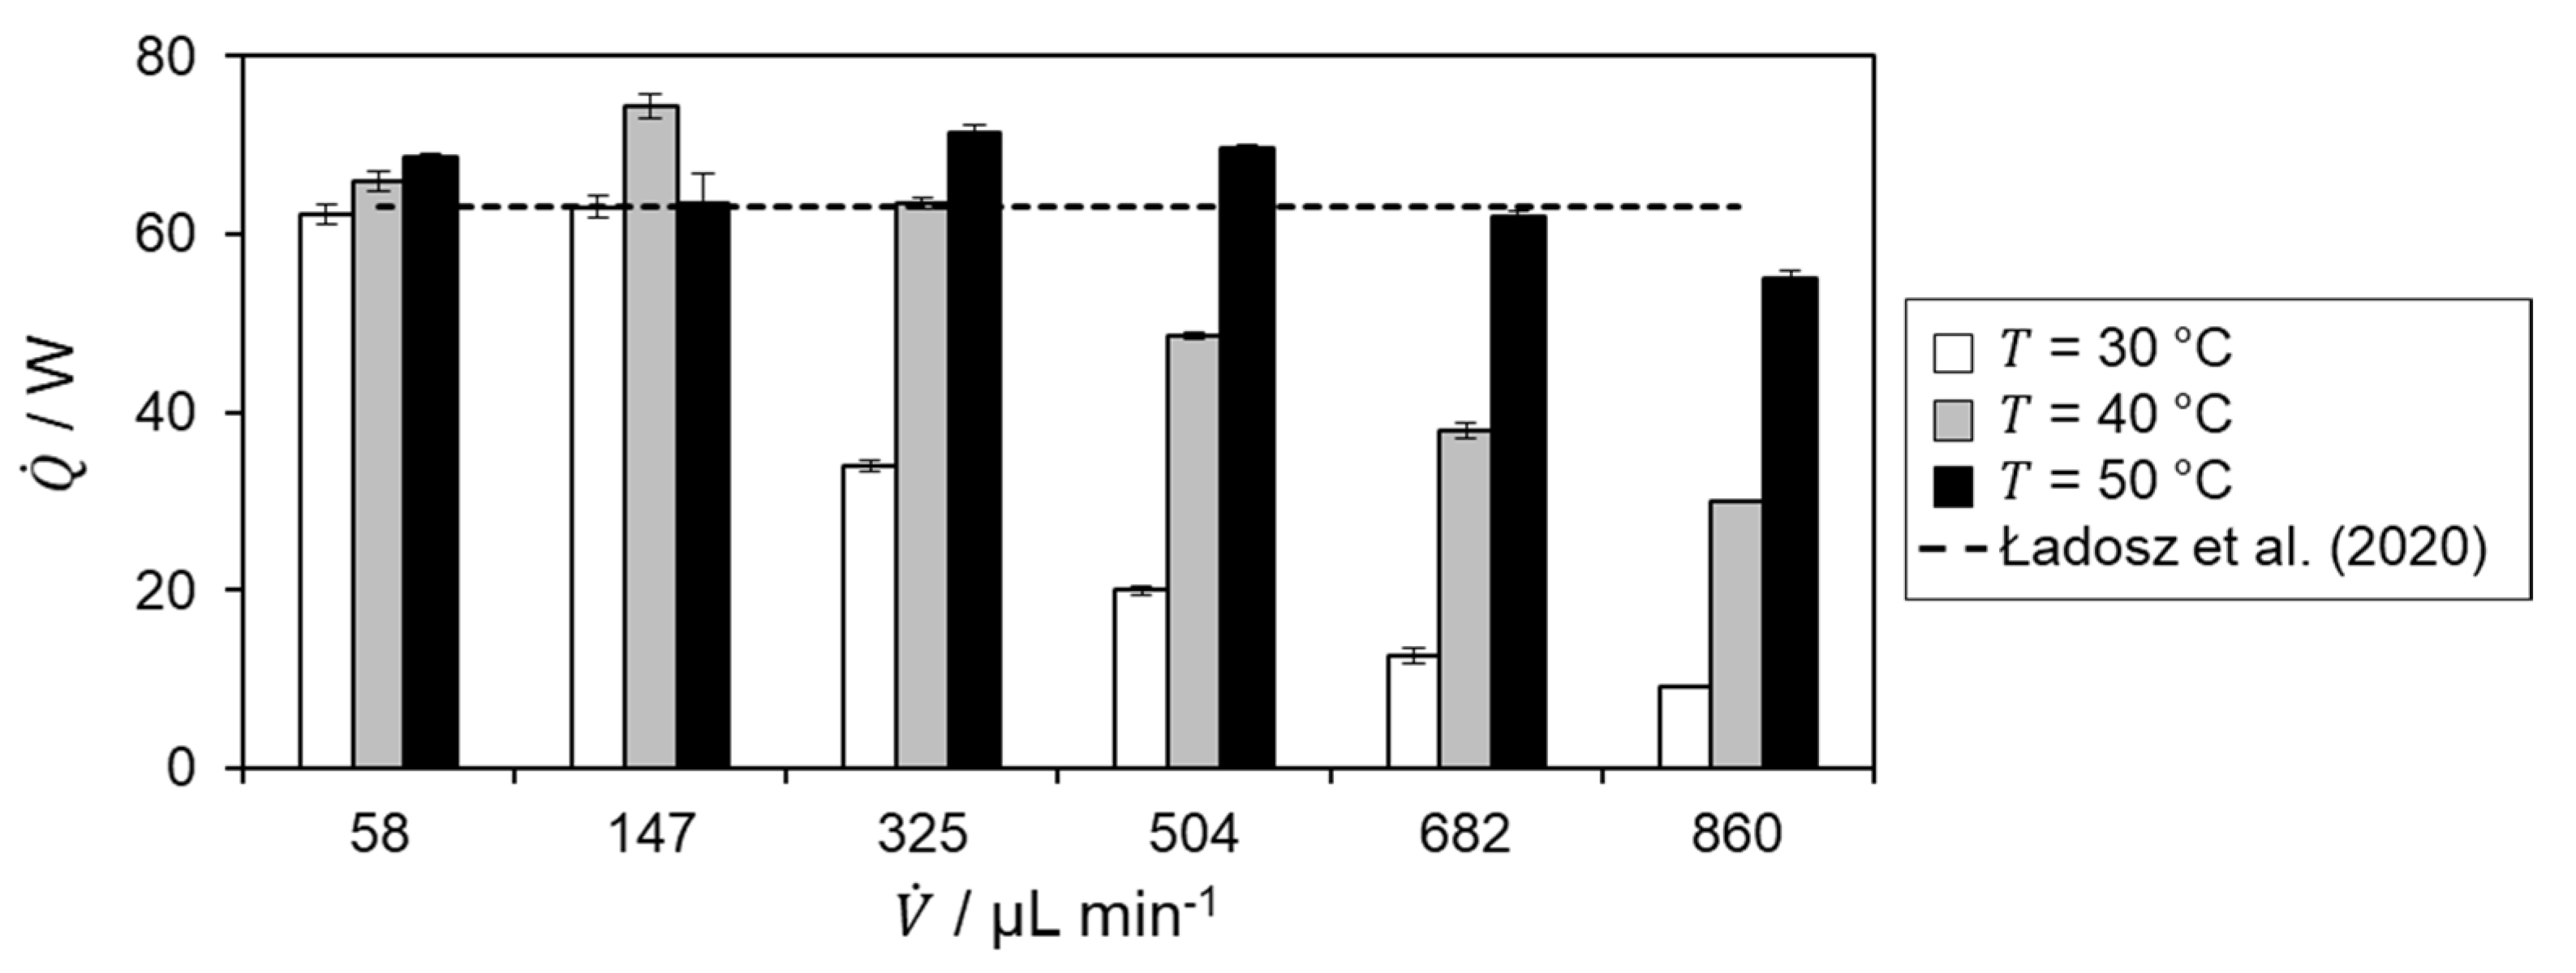
File:Fig8 Frede Processes23 11-1.png ...with literature value by Ładosz ''et al.'', which is indicated by a dashed black line.(3,175 × 1,199 (340 KB)) - 21:15, 19 April 2023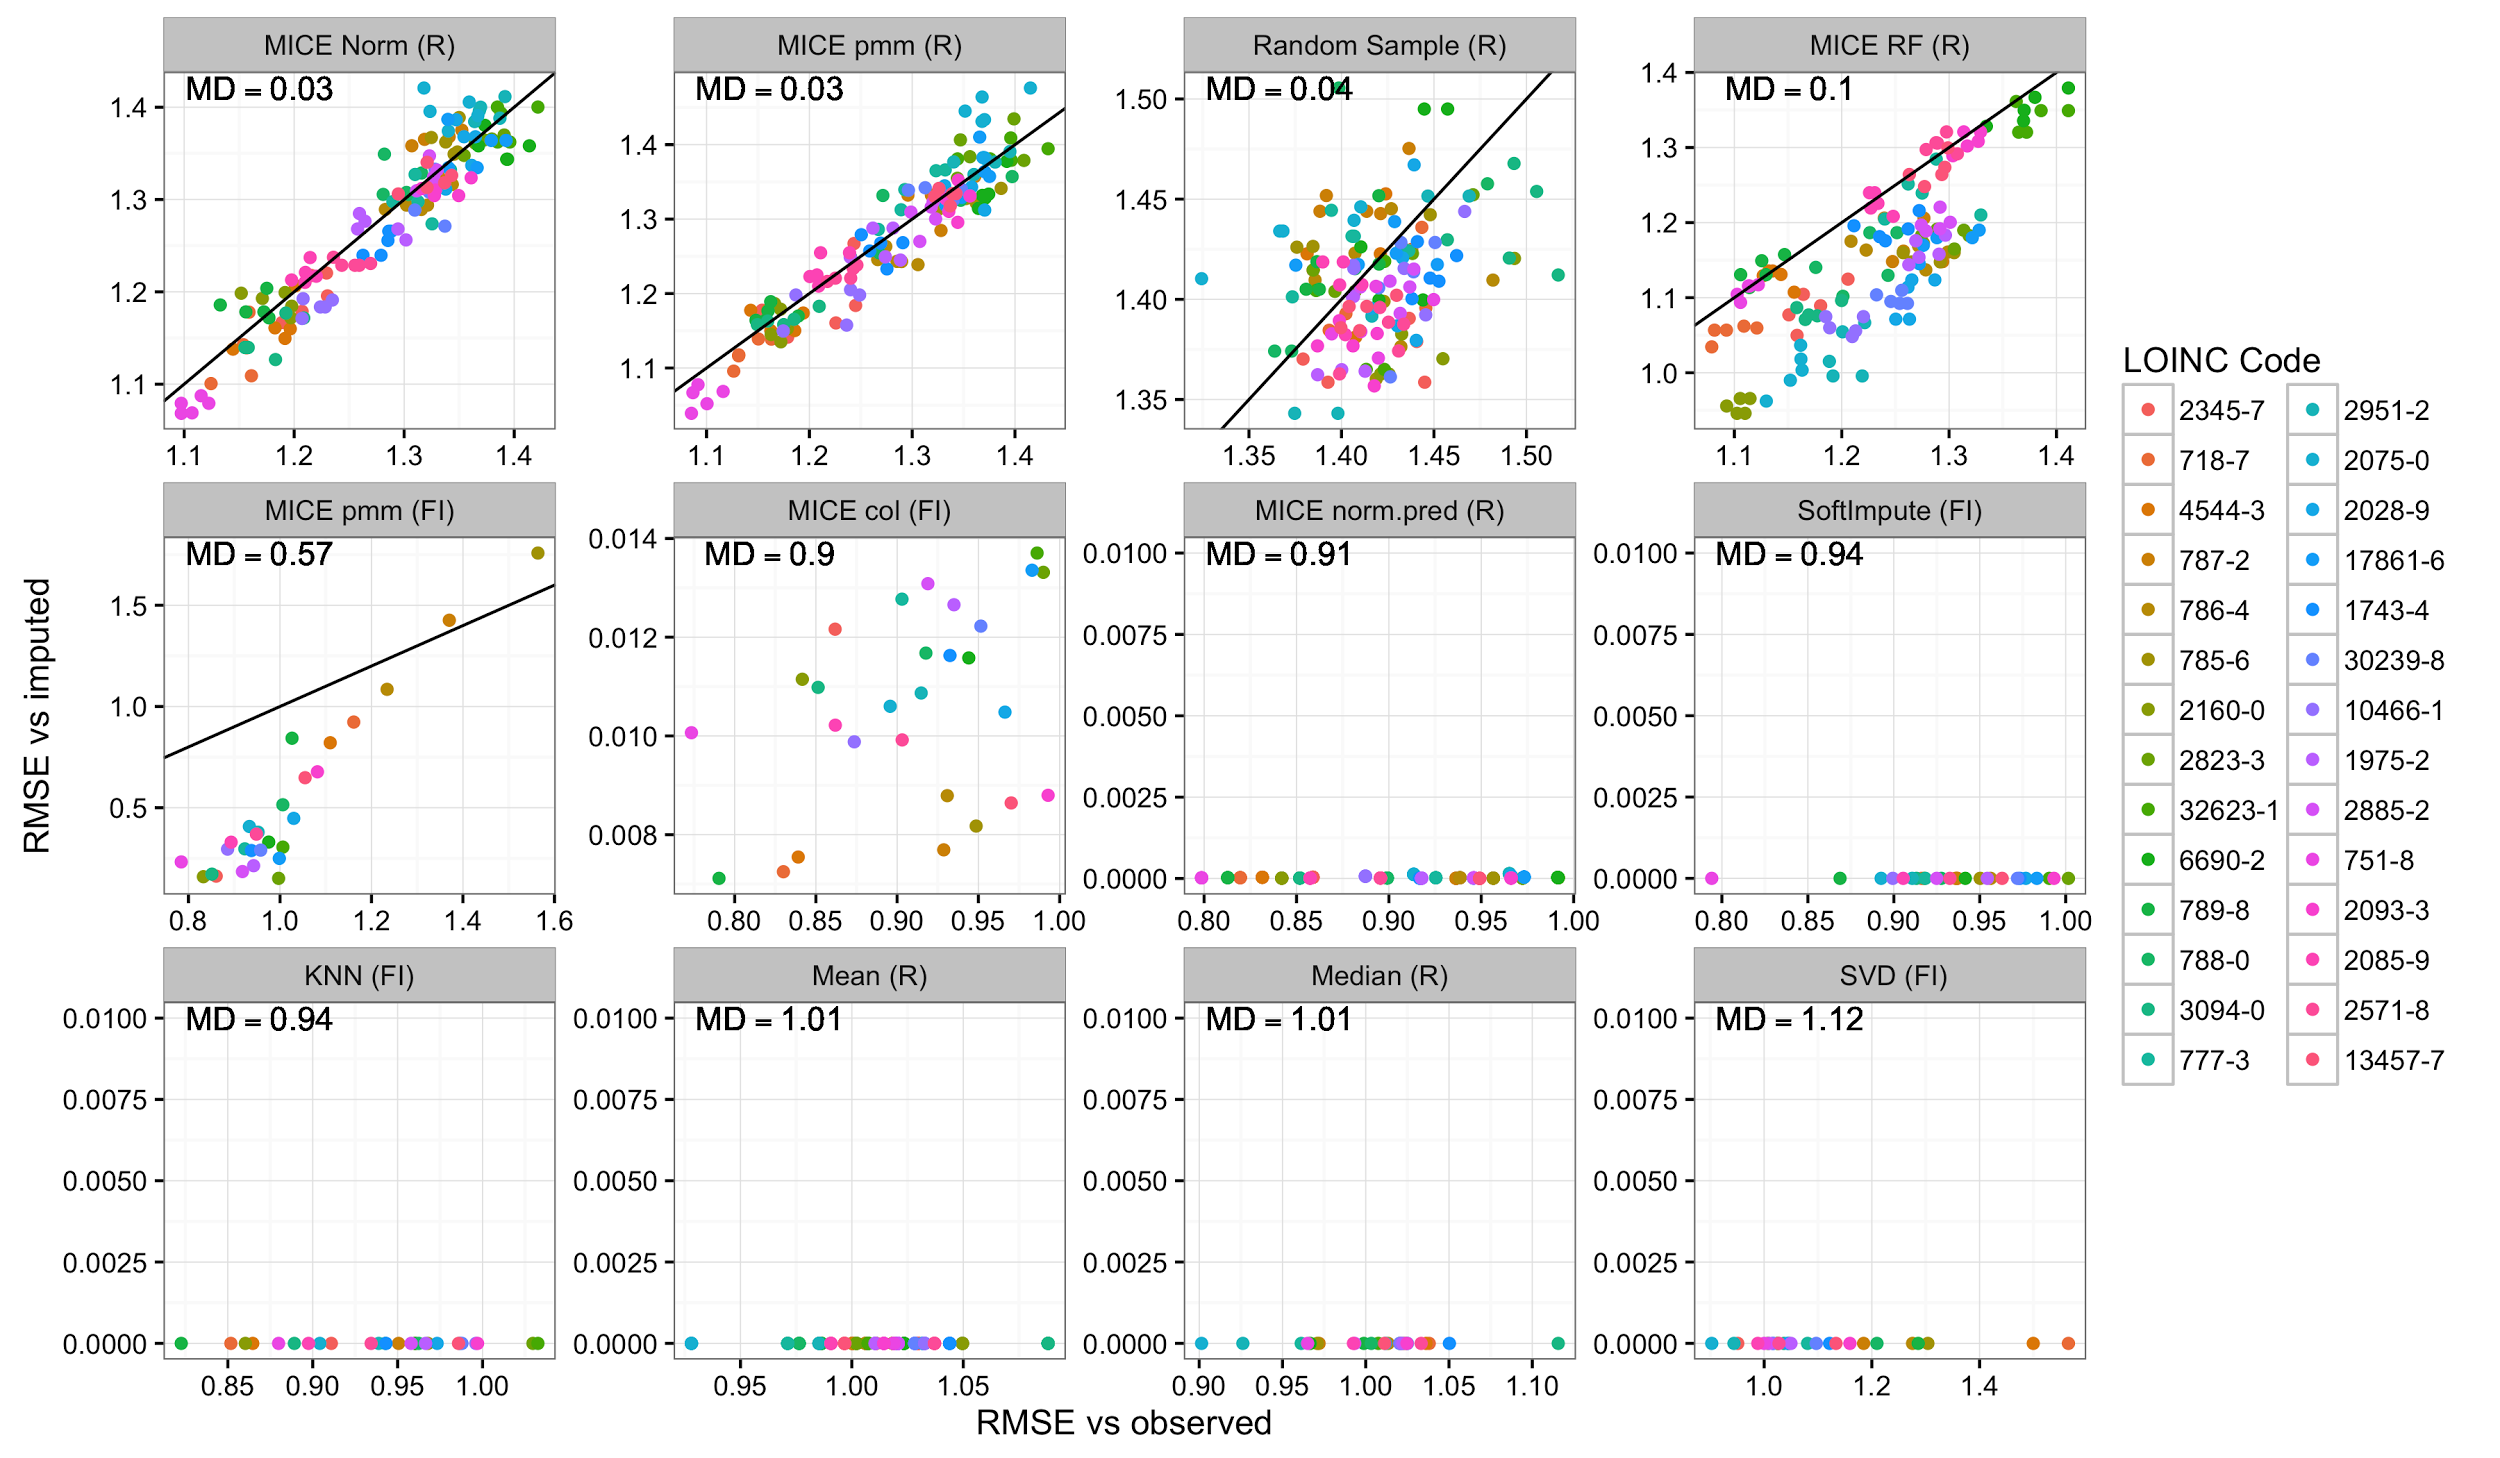
File:Fig6 Beaulieu-JonesJMIRMedInfo2018 6-1.png ...iation. The laboratory tests are indicated by the color of the points. The black diagonal line represents unity (y=x). Panels are ordered by each method’s(2,500 × 1,458 (674 KB)) - 20:49, 6 March 2018


