Search results
From LIMSWiki
Jump to navigationJump to search
Page title matches

File:LIMSpec for Cannabis Testing v1.0.docx (191 KB) - 01:10, 4 January 2024
File:Centers for Medicare and Medicaid Services logo.png Logo for CMS(120 × 87 (4 KB)) - 18:34, 23 March 2014
File:Choosing and Implementing a Cloud-based Service for your Laboratory 135.png (135 × 100 (10 KB)) - 17:58, 24 August 2022
File:Laboratory Informatics Buyers Guide for Medical Diagnostics and Research 135.png (135 × 100 (14 KB)) - 17:59, 24 August 2022File:LIMSpec for Medical Diagnostics and Research Labs v1.1.docx (177 KB) - 20:49, 29 September 2022File:LIMSpec for Food and Beverage Labs v1.0.docx (210 KB) - 20:19, 2 December 2022
File:LIMS Selection Guide for Food Safety and Quality 135.png (135 × 100 (10 KB)) - 16:17, 11 January 2023
File:LIMS Selection Guide for ISO-IEC 17025 Laboratories 135.png (135 × 100 (14 KB)) - 03:05, 25 February 2023File:LIMSpec for Manufacturing-based Labs v1.0.docx (211 KB) - 19:46, 16 May 2023
File:LIMS Selection Guide for Manufacturing Quality Control 135.png (135 × 100 (14 KB)) - 16:26, 14 June 2023


Page text matches
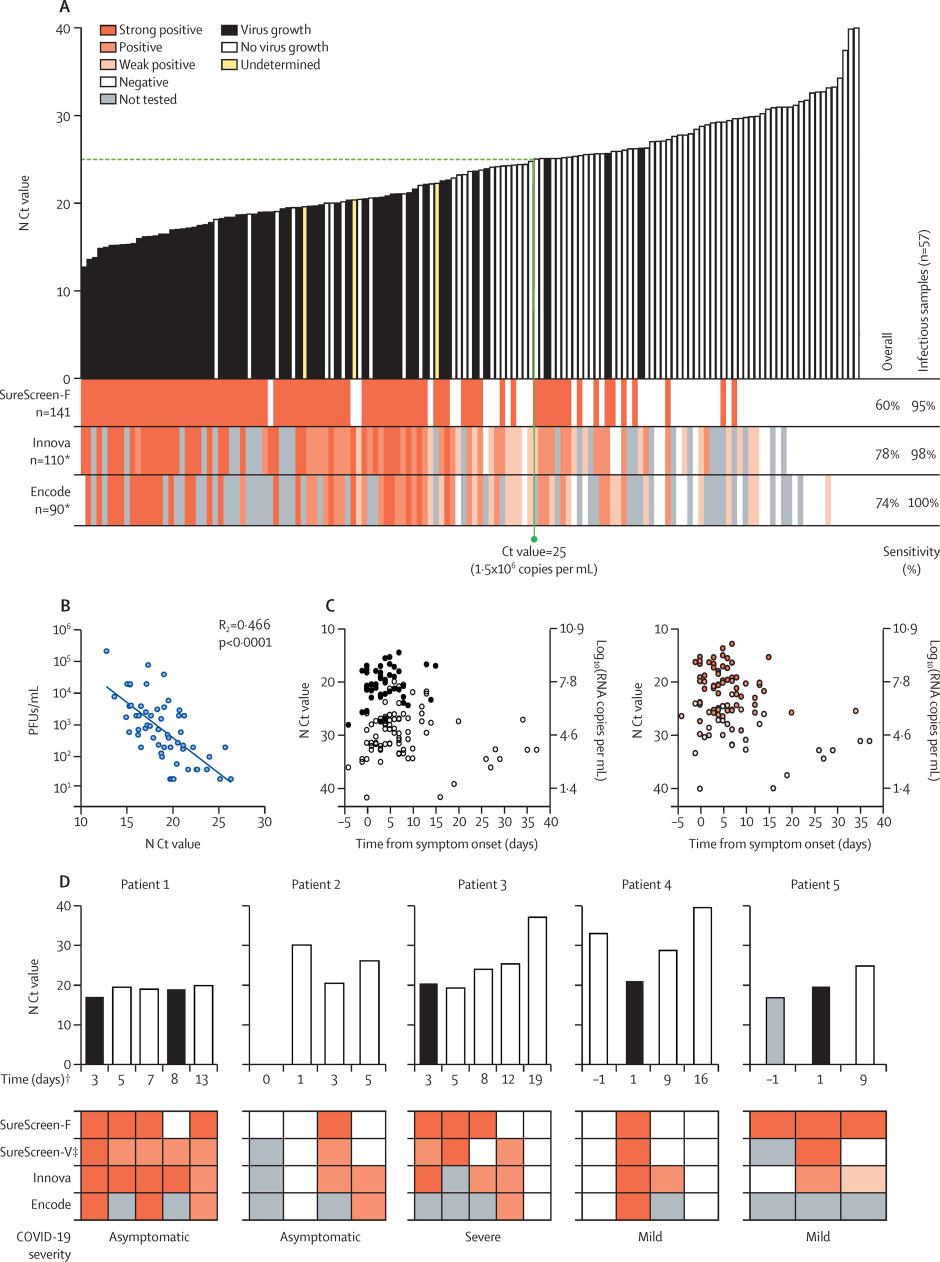
File:Fig2 Pickering LancetMicrobe2021 2-9.jpg ...ample volume and test availability for inclusion in the longitudinal study for completeness of the dataset.(940 × 1,262 (215 KB)) - 17:01, 22 September 2021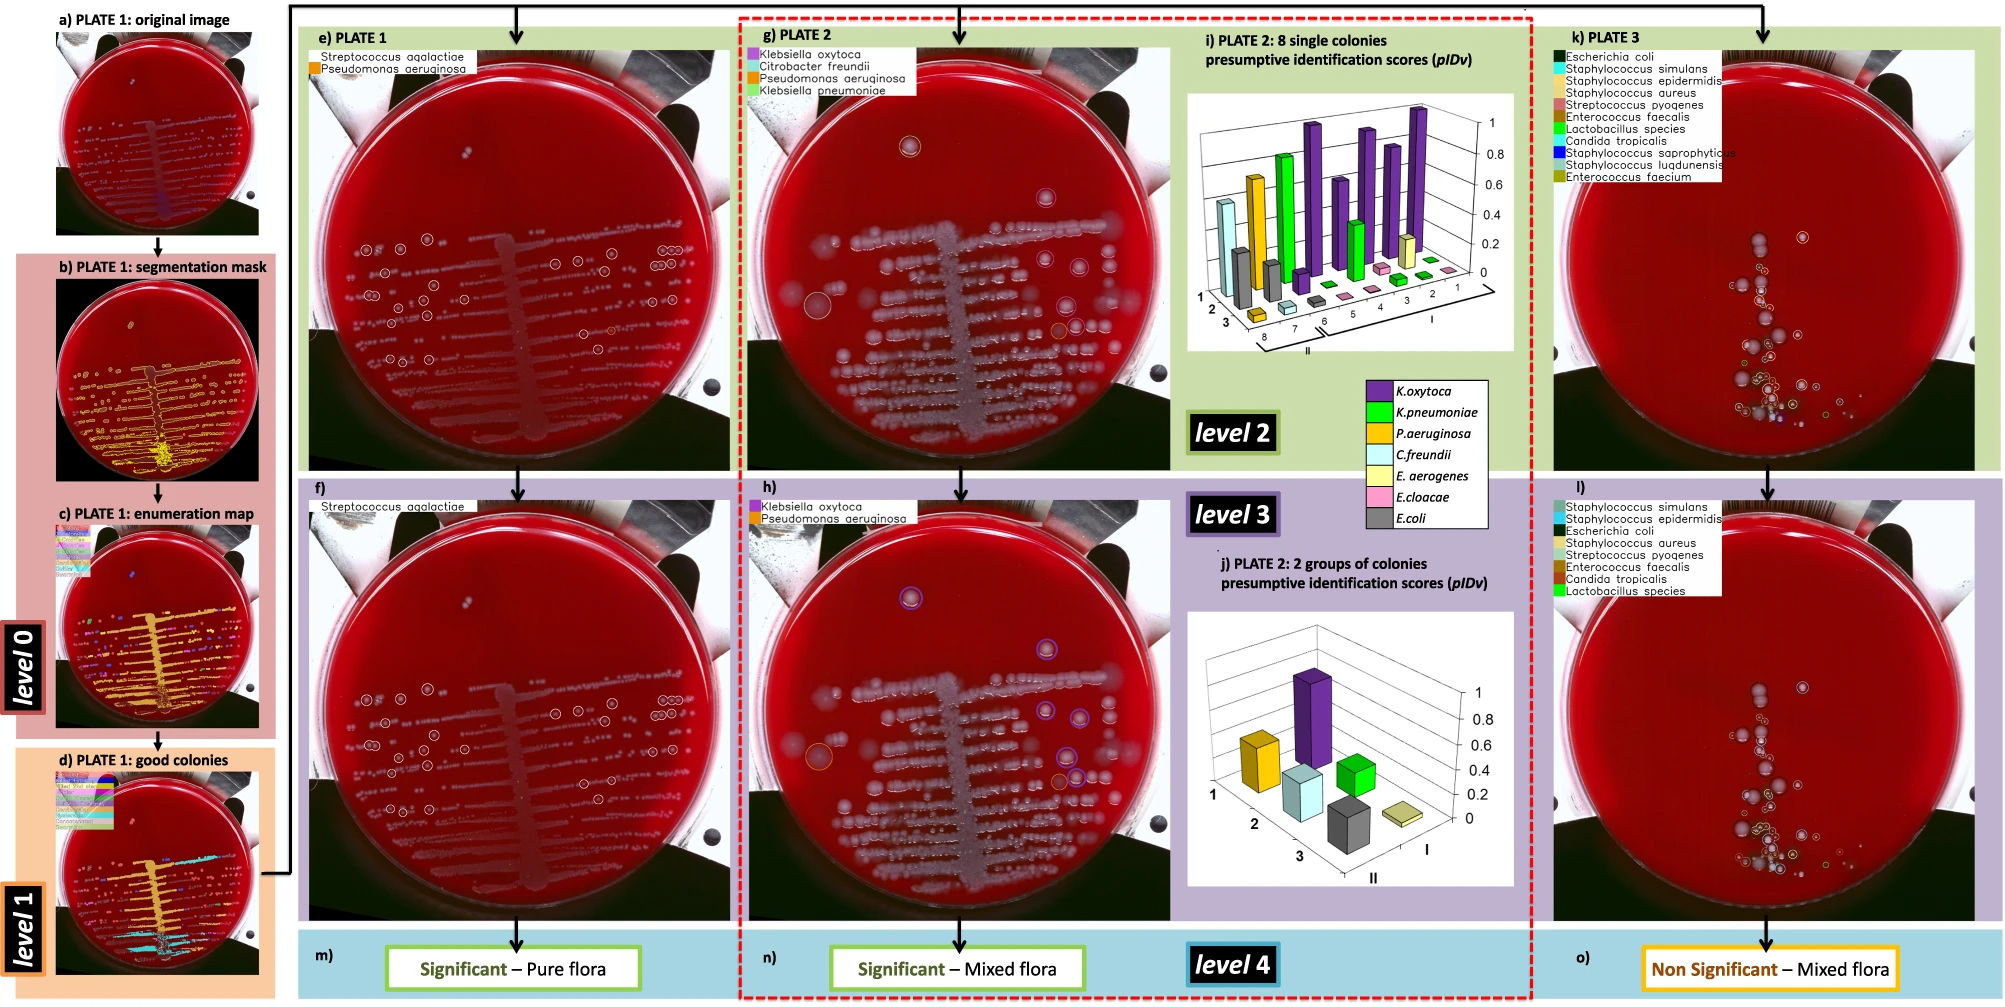
File:Fig4 Signoroni NatComm23 14.png ...s (for this case represented in the block diagram of Fig. 5a). Source data for '''i''' and '''j''' are provided as a Source Data file.(2,005 × 1,007 (2.2 MB)) - 17:36, 3 March 2024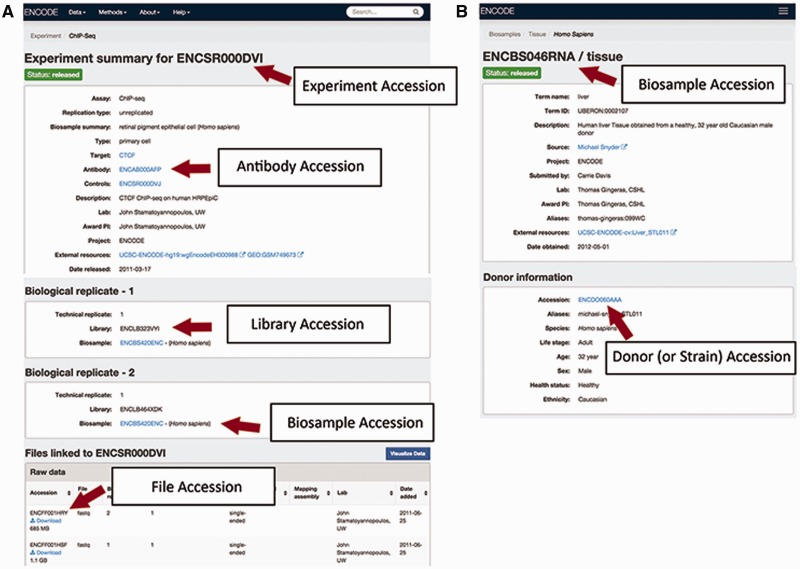
File:Fig2 Hong Database2016 2016.jpg ...file generated by sequencing. (B) A biosample page will contain accessions for the biosample that was used as well as the unique donor (or strain) that pr(800 × 569 (94 KB)) - 21:12, 6 September 2016
File:Fig2 Backman BMCBio2016 17.gif ...(7) gene-wise clustering with a wide range of algorithms; and (8) support for plotting read pileups and variants in the context of genome annotations alo(567 × 576 (187 KB)) - 22:24, 20 August 2018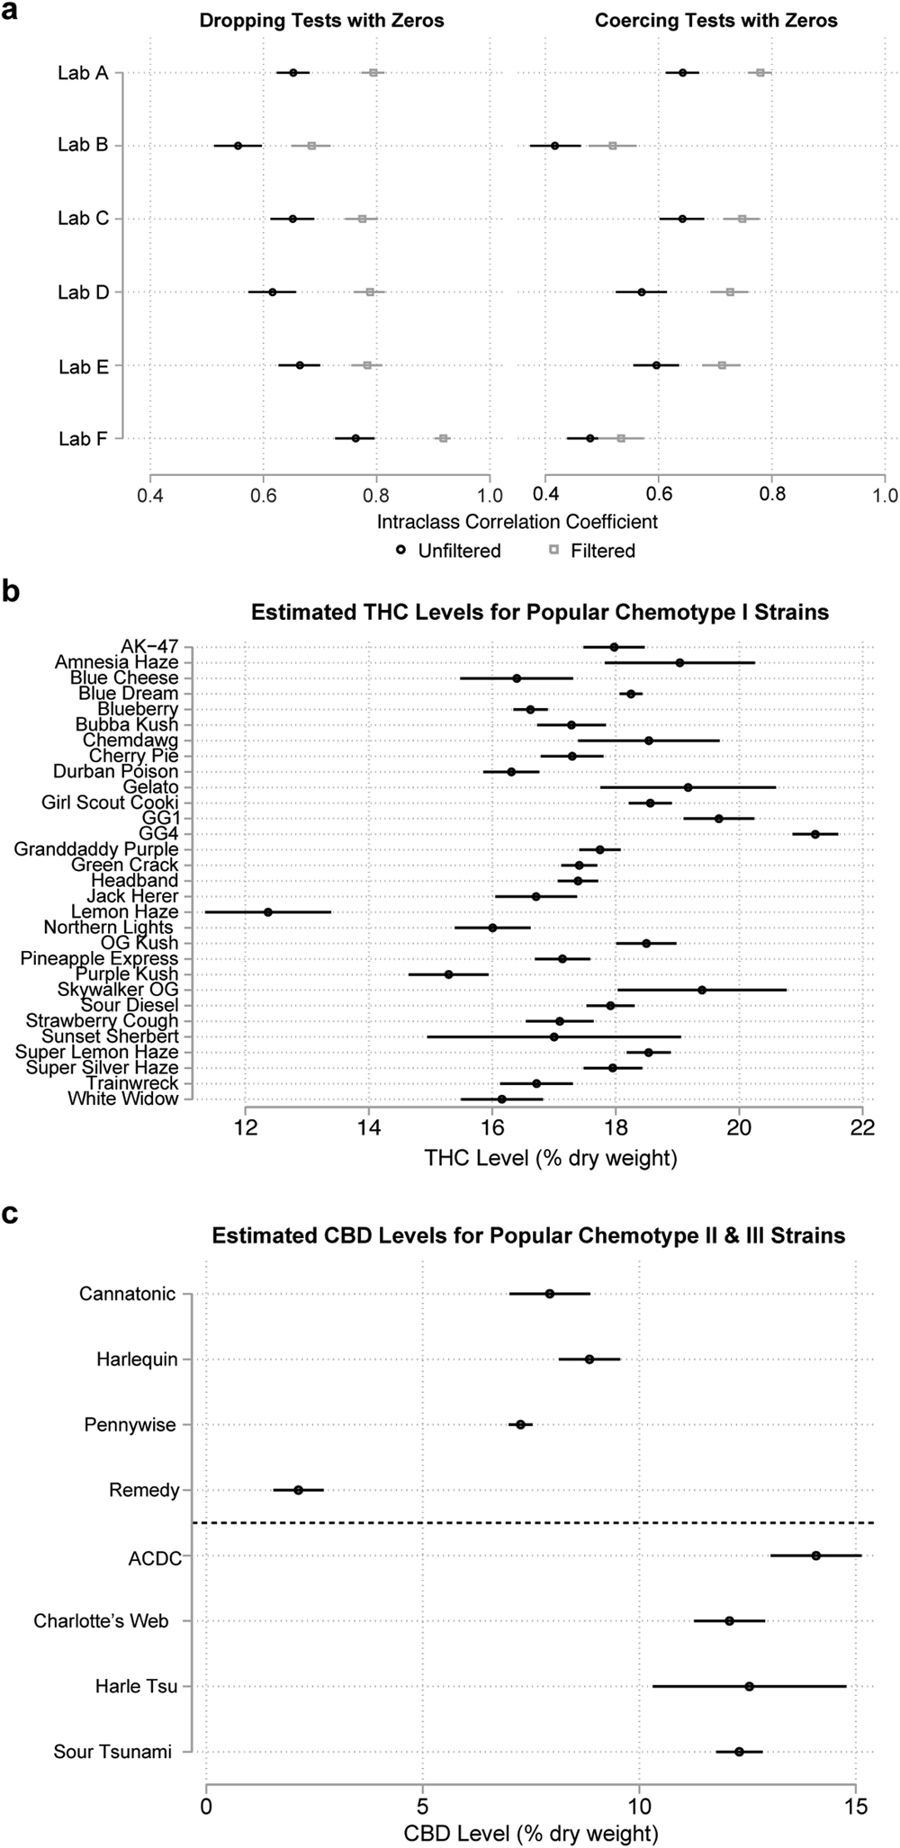
File:Fig8 Jikomes SciReports2018 8.jpg ...ed line) and chemotype III (below dotted line) strain names. Results shown for the lab reporting the lowest mean THC levels. |Source={{cite journal |title(900 × 1,848 (160 KB)) - 22:48, 20 December 2023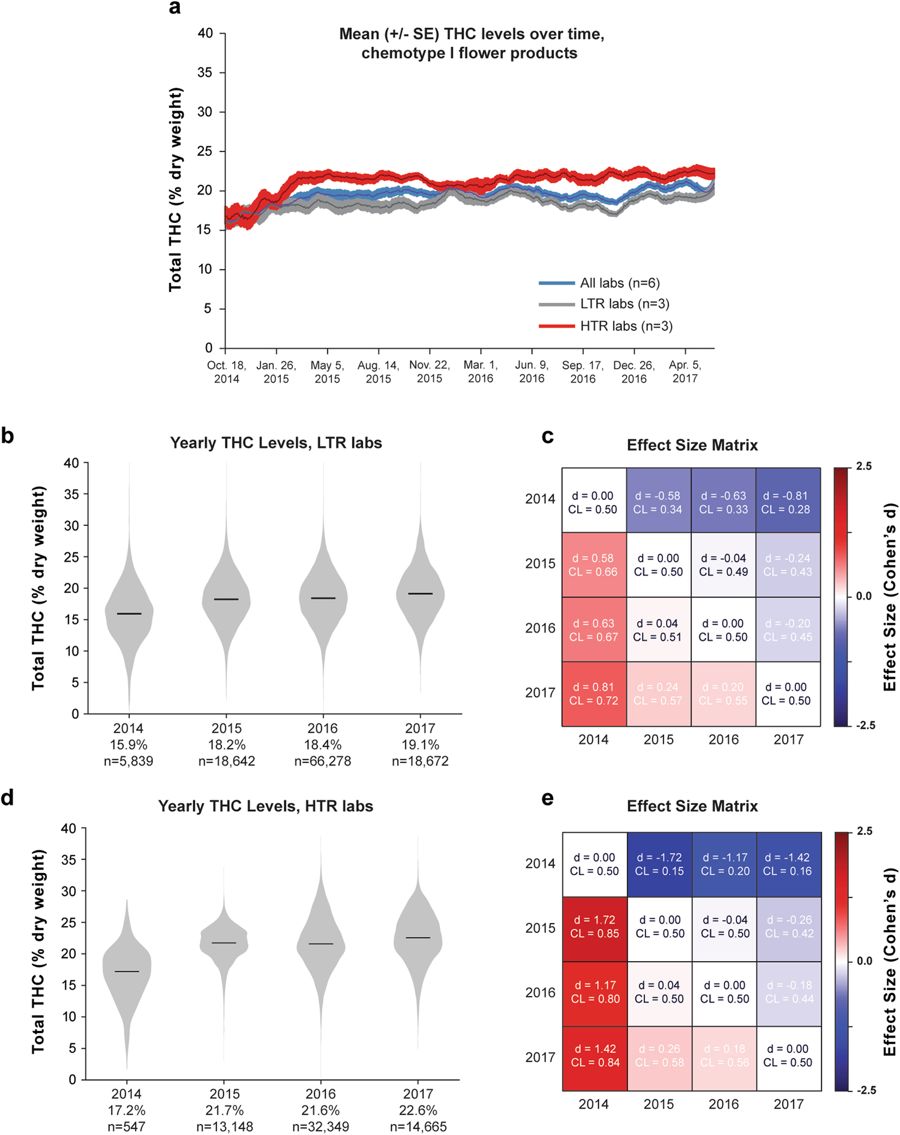
File:Fig5 Jikomes SciReports2018 8.jpg ...oss years for LTR labs. '''(d)''' Distribution of THC levels for each year for high THC reporting (HTR) labs, and '''(e)''' the effect size matrix quantif(900 × 1,135 (100 KB)) - 22:47, 20 December 2023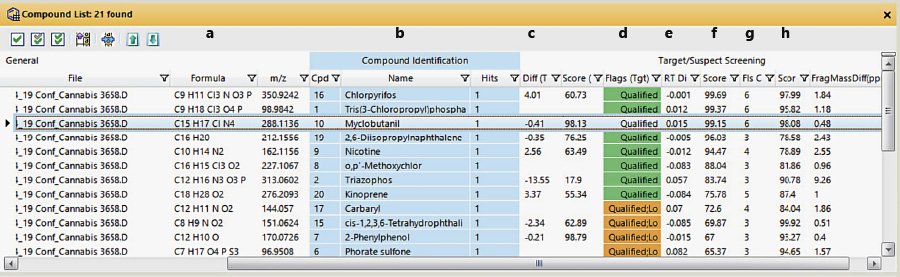
File:Fig3 Wylie MedCannCannab2020 3-1.jpg ...ut of six in this case) ('''g'''), and the average coelution score (0–100) for all qualified ions ('''h'''). |Source={{cite journal |title=Screening for more than 1,000 pesticides and environmental contaminants in cannabis by GC(900 × 277 (72 KB)) - 22:47, 20 December 2023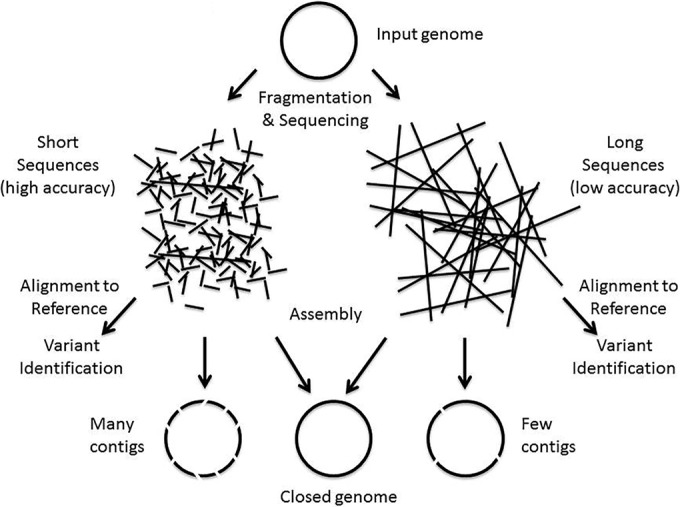
File:Fig1 Goldberg mBio2015 6-6.jpg ...genome (e.g., for identifying virulence or antibiotic resistance genes or for comparative genomic studies), the reads are assembled into genomes using sp ...the leap from research laboratory to clinic: Challenges and opportunities for next-generation sequencing in infectious disease diagnostics |journal=mBio(680 × 507 (63 KB)) - 16:29, 20 September 2016
File:Fig3 Andellini BMCMedInfoDecMak2017 17-1.gif ...d. Each filled triangle represents one measurement of the total time spent for the management of a single patient’s follow-up performed with the BPM met(567 × 341 (30 KB)) - 00:16, 14 November 2017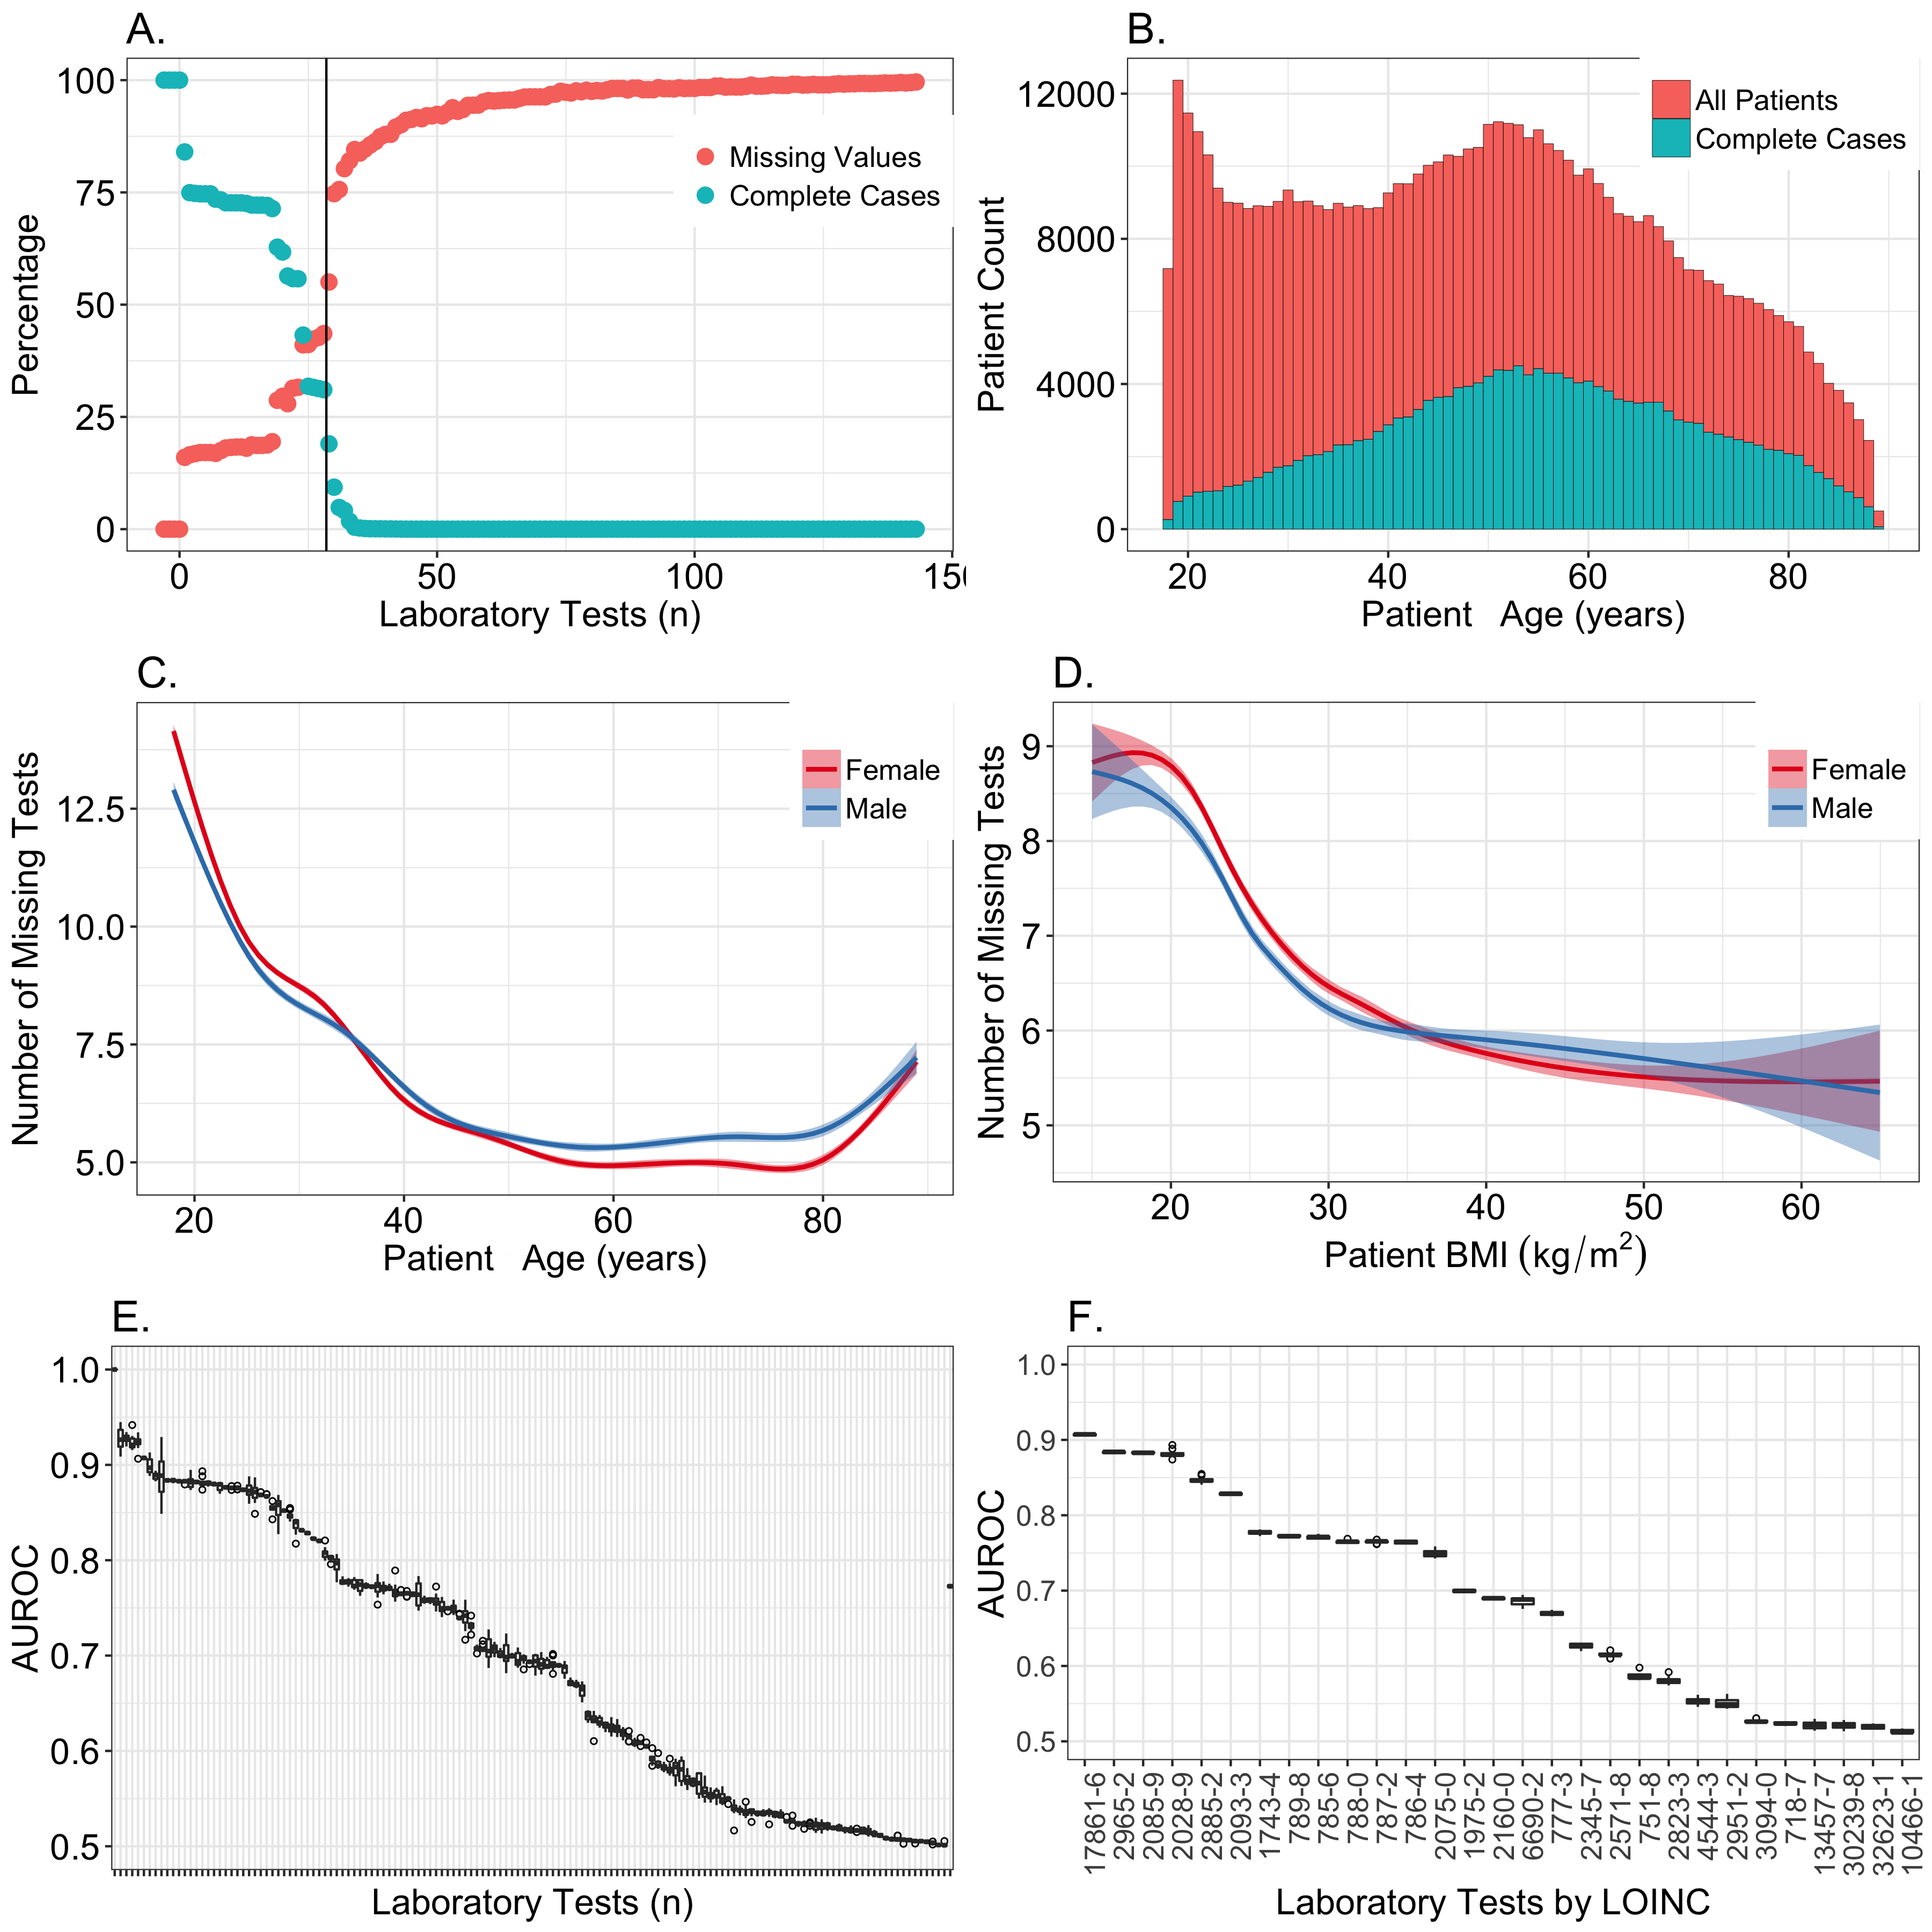
File:Fig2 Beaulieu-JonesJMIRMedInfo2018 6-1.png ...nction of age. '''(D)''' Within the 28 laboratory tests that were selected for imputation, the mean number of missing tests is depicted as a function of b(3,600 × 3,600 (694 KB)) - 19:52, 6 March 2018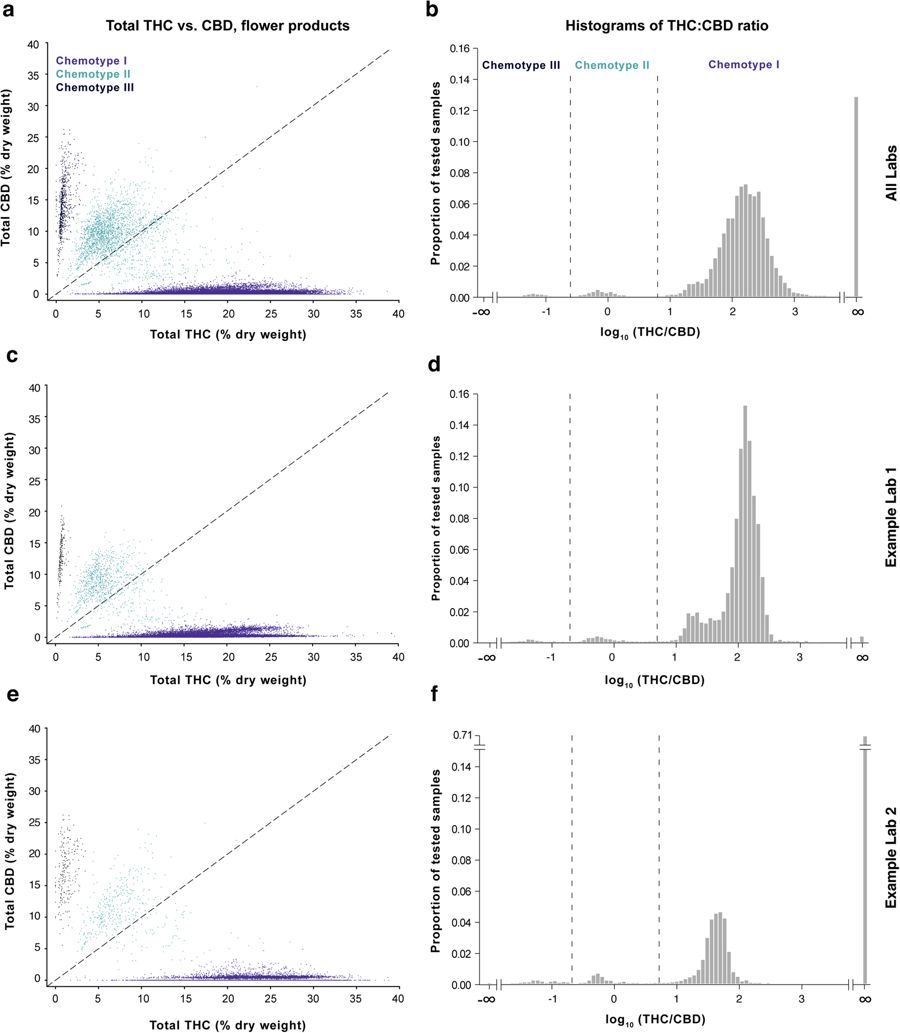
File:Fig1 Jikomes SciReports2018 8.jpg ...els a-b are shown in Figure S1. Panels a and c were subsampled to n=50,000 for visualization purposes. |Source={{cite journal |title= The cannabinoid cont(900 × 1,033 (80 KB)) - 22:46, 20 December 2023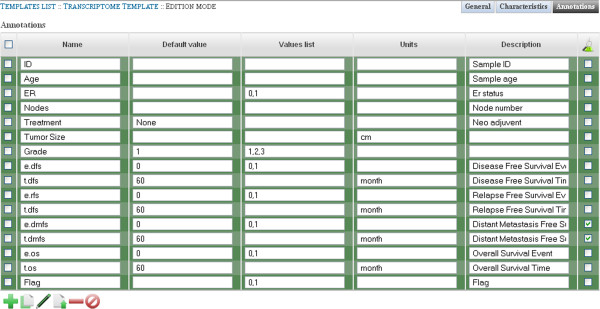
File:Fig4 Stahl BMCResearchNotes2013 6.jpg ...mplate. Two mechanisms have been set up to control values that are allowed for a given annotation. If a default value is specified, this value will be set ...for Joomla!’s Extensible Engine): A research information management system for flexible multi-technology project administration |journal=BMC Research Note(600 × 309 (87 KB)) - 23:45, 11 January 2016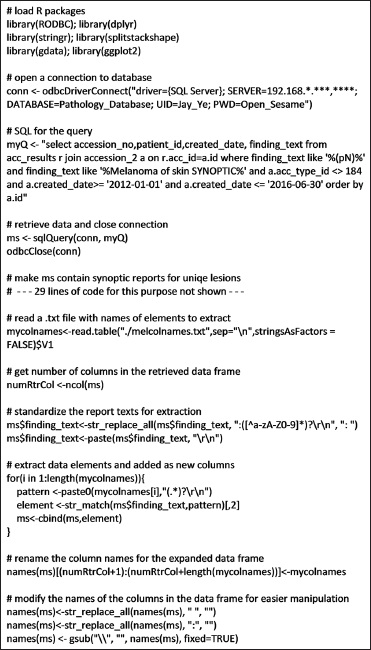
File:Fig1 Ye JofPathInformatics2016 7.jpg ...rts corresponding to unique lesions are omitted. See Materials and Methods for additional description.(371 × 650 (102 KB)) - 22:22, 16 November 2016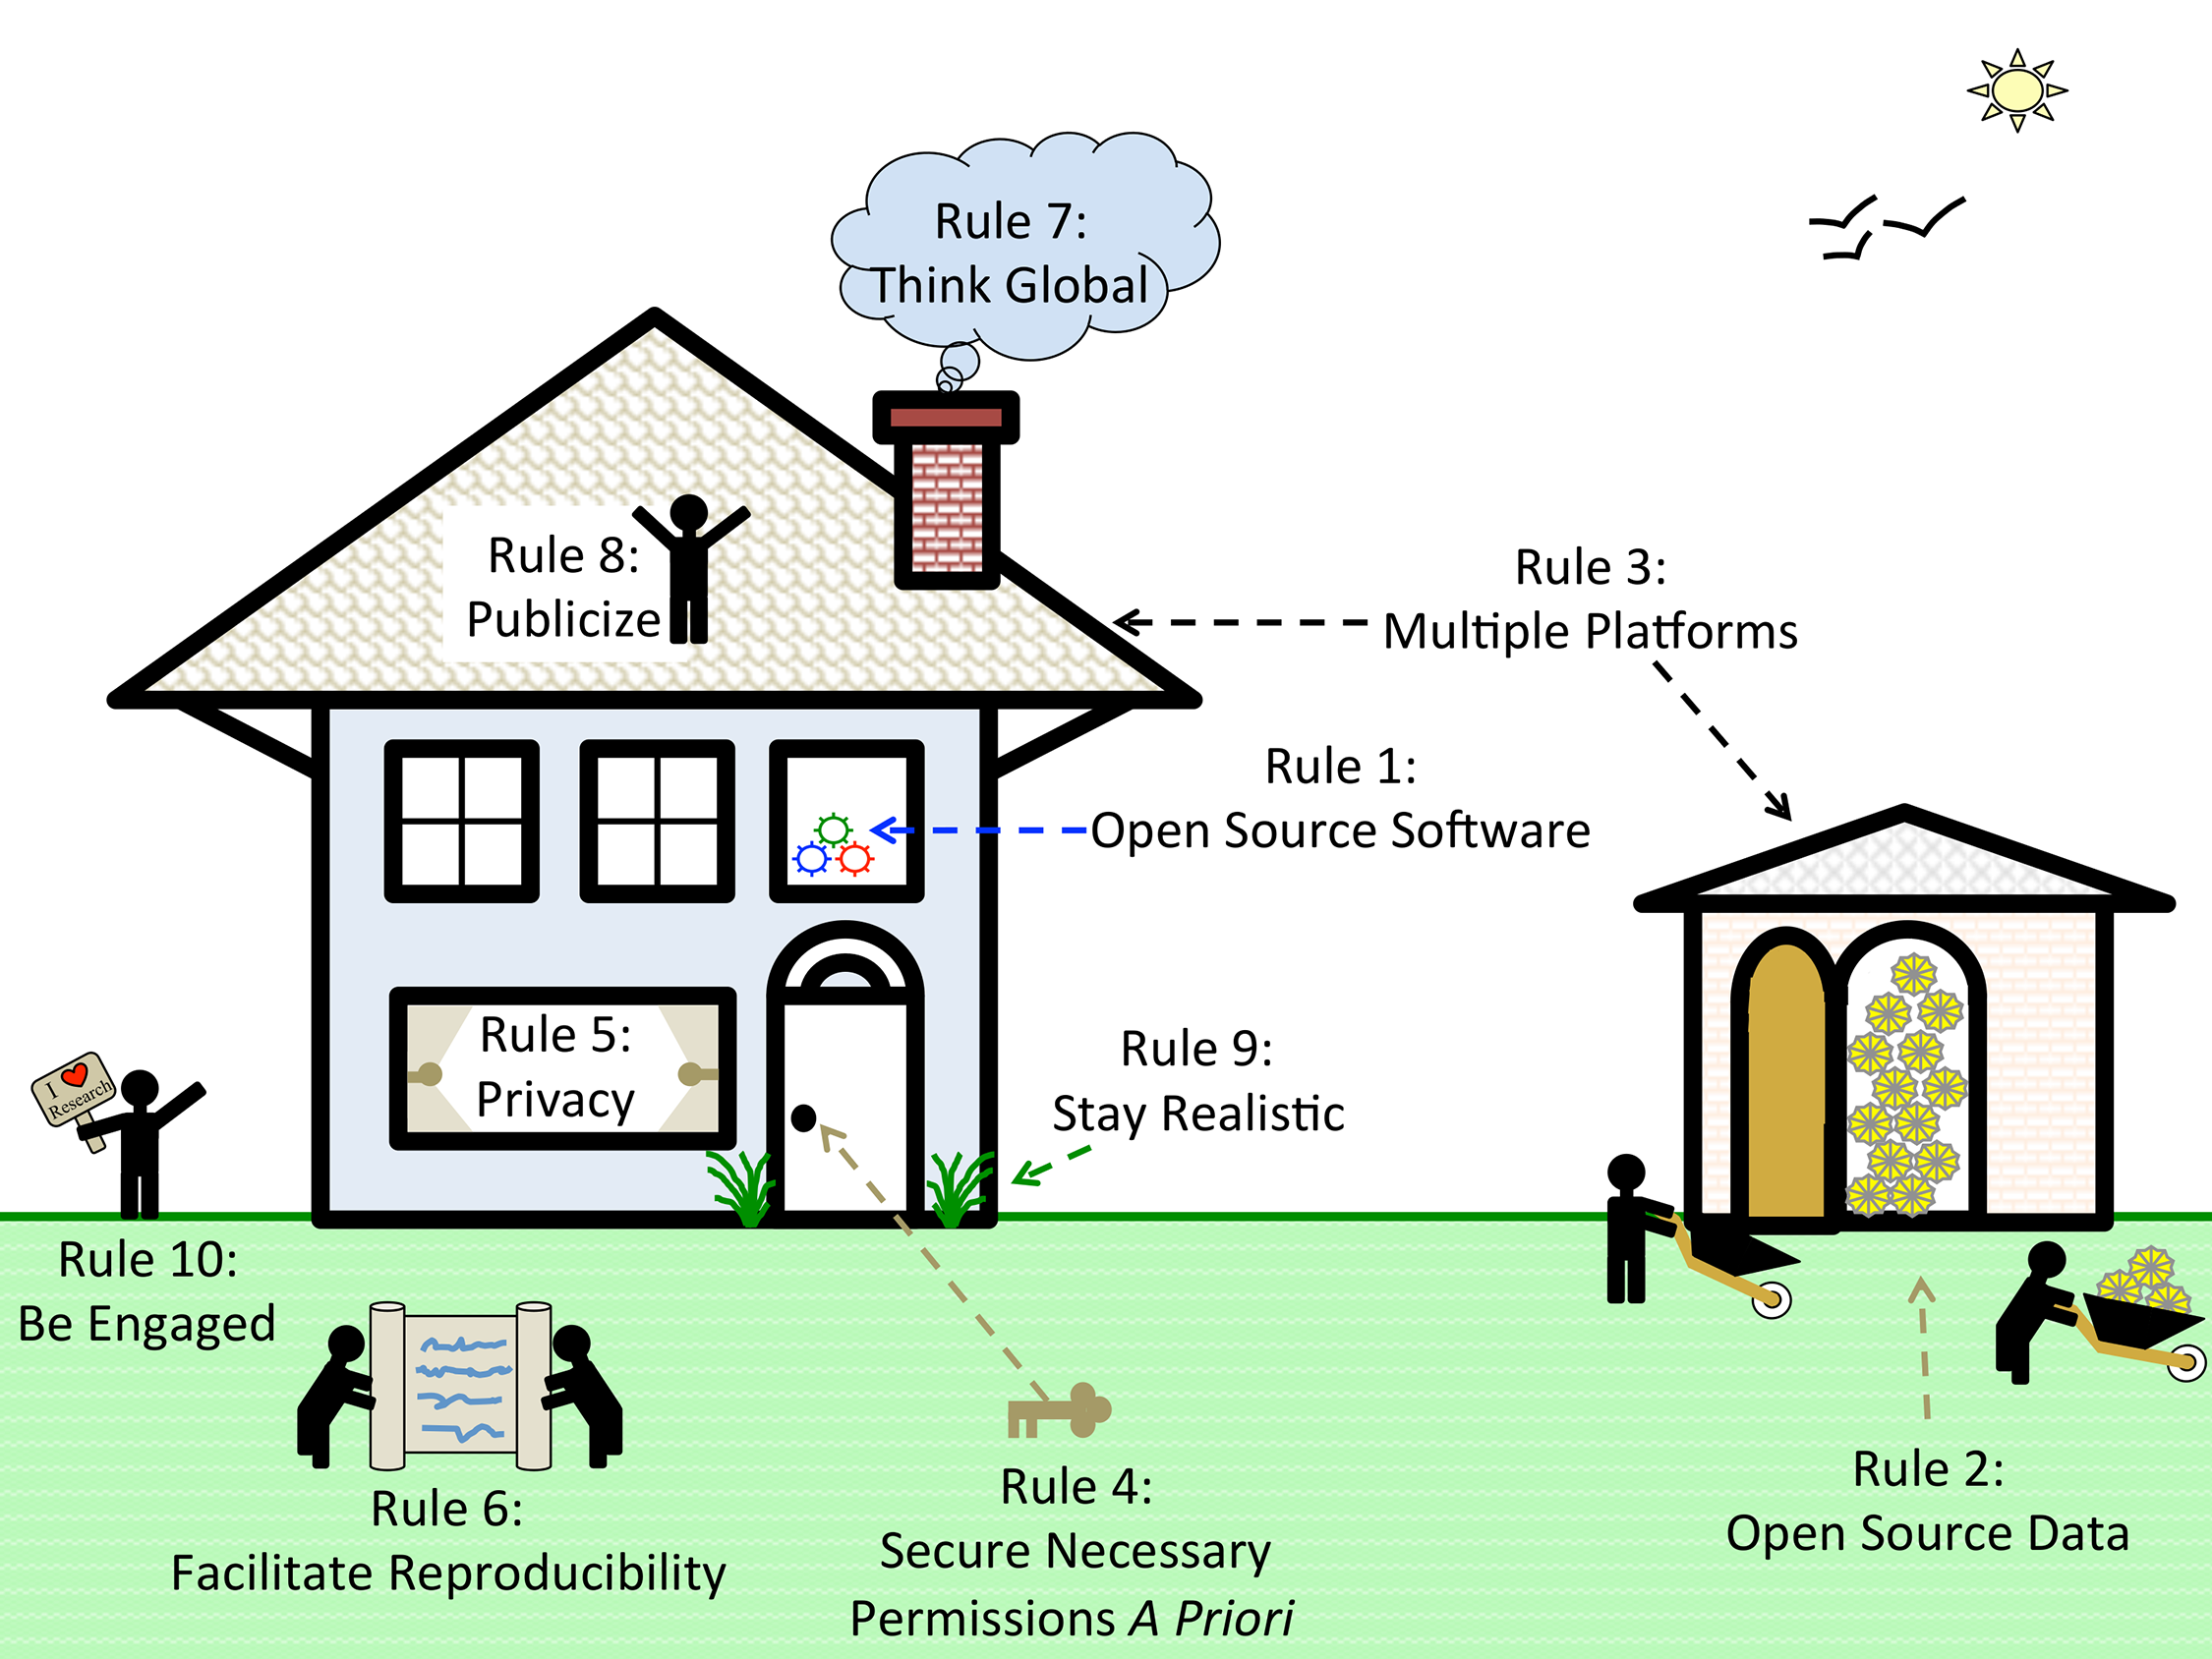
File:Fig1 Boland PLOSCompBio2017 13-1.png ...our research product. '''Rule 9''' is to “stay realistic.” It is important for researchers to “stay grounded” and resist the urge to overstate the cla(2,250 × 1,688 (666 KB)) - 20:37, 13 March 2017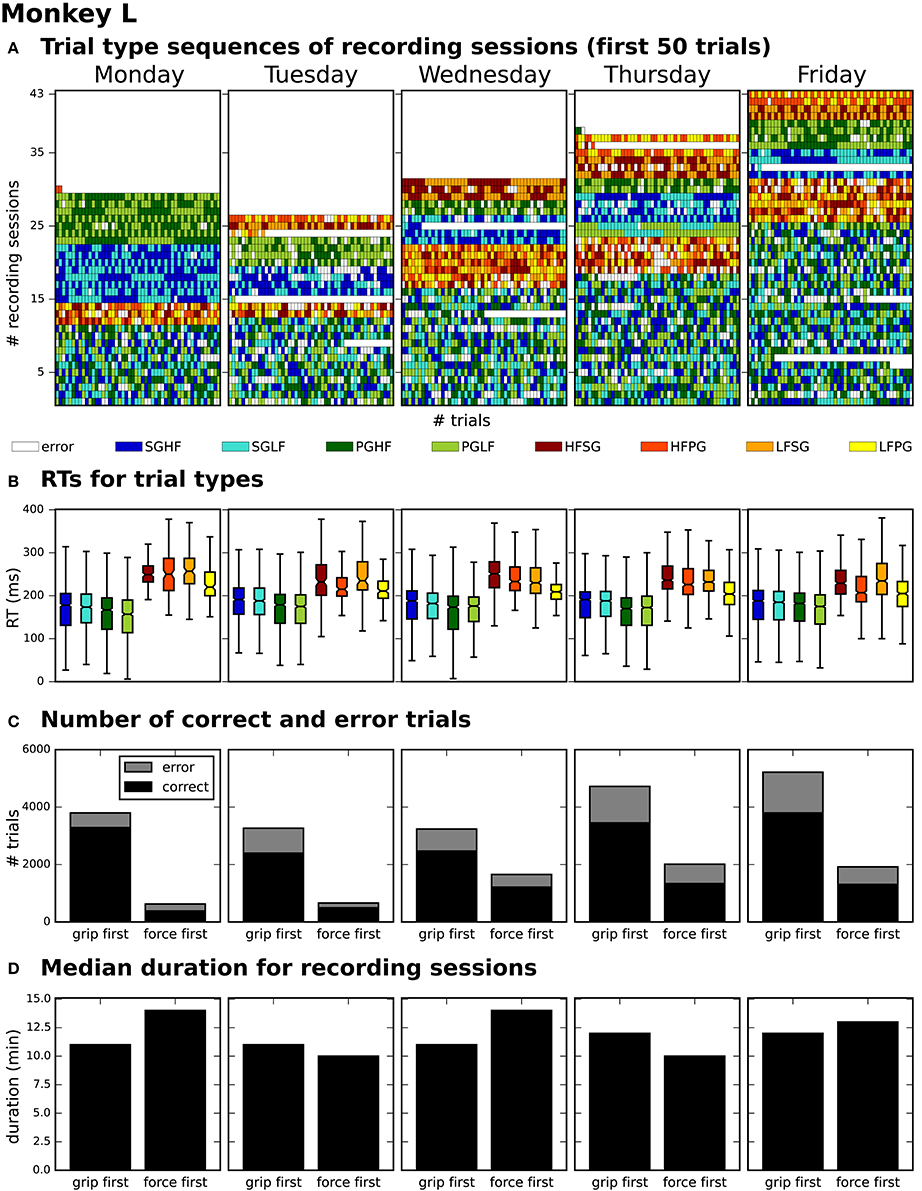
File:Fig3 Zehl FrontInNeuro2016 10.jpg ...first cue informed about the force type (force first). '''(D)''' displays for each weekday the median recording duration of the grip first and force firs(922 × 1,191 (791 KB)) - 00:00, 21 December 2017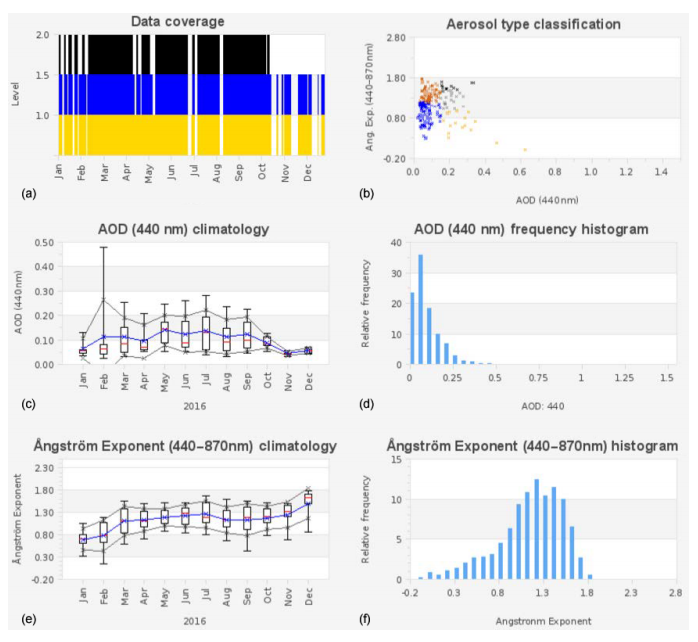
File:Fig11 Fuertes GIMDS2018 7-1.png ...(e)''' AE monthly statistics using box plot; '''(f)''' frequency histogram for AE. |Source={{cite journal |title=CÆLIS: Software for assimilation, management, and processing data of an atmospheric measurement(698 × 642 (198 KB)) - 22:39, 17 August 2018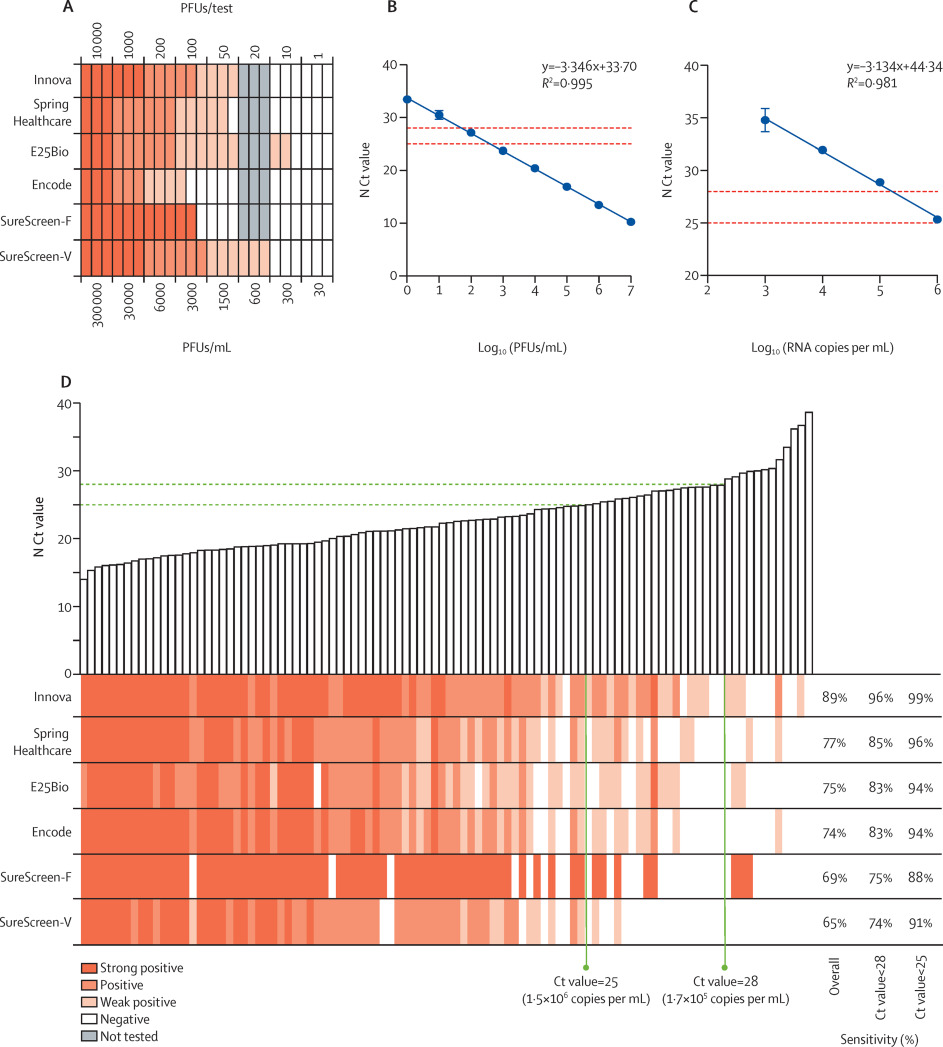
File:Fig1 Pickering LancetMicrobe2021 2-9.jpg ...FUs/mL, respectively, are indicated, with corresponding sensitivity values for each test at each threshold on the right. PFU = plaque-forming unit; SureSc(943 × 1,047 (196 KB)) - 16:48, 22 September 2021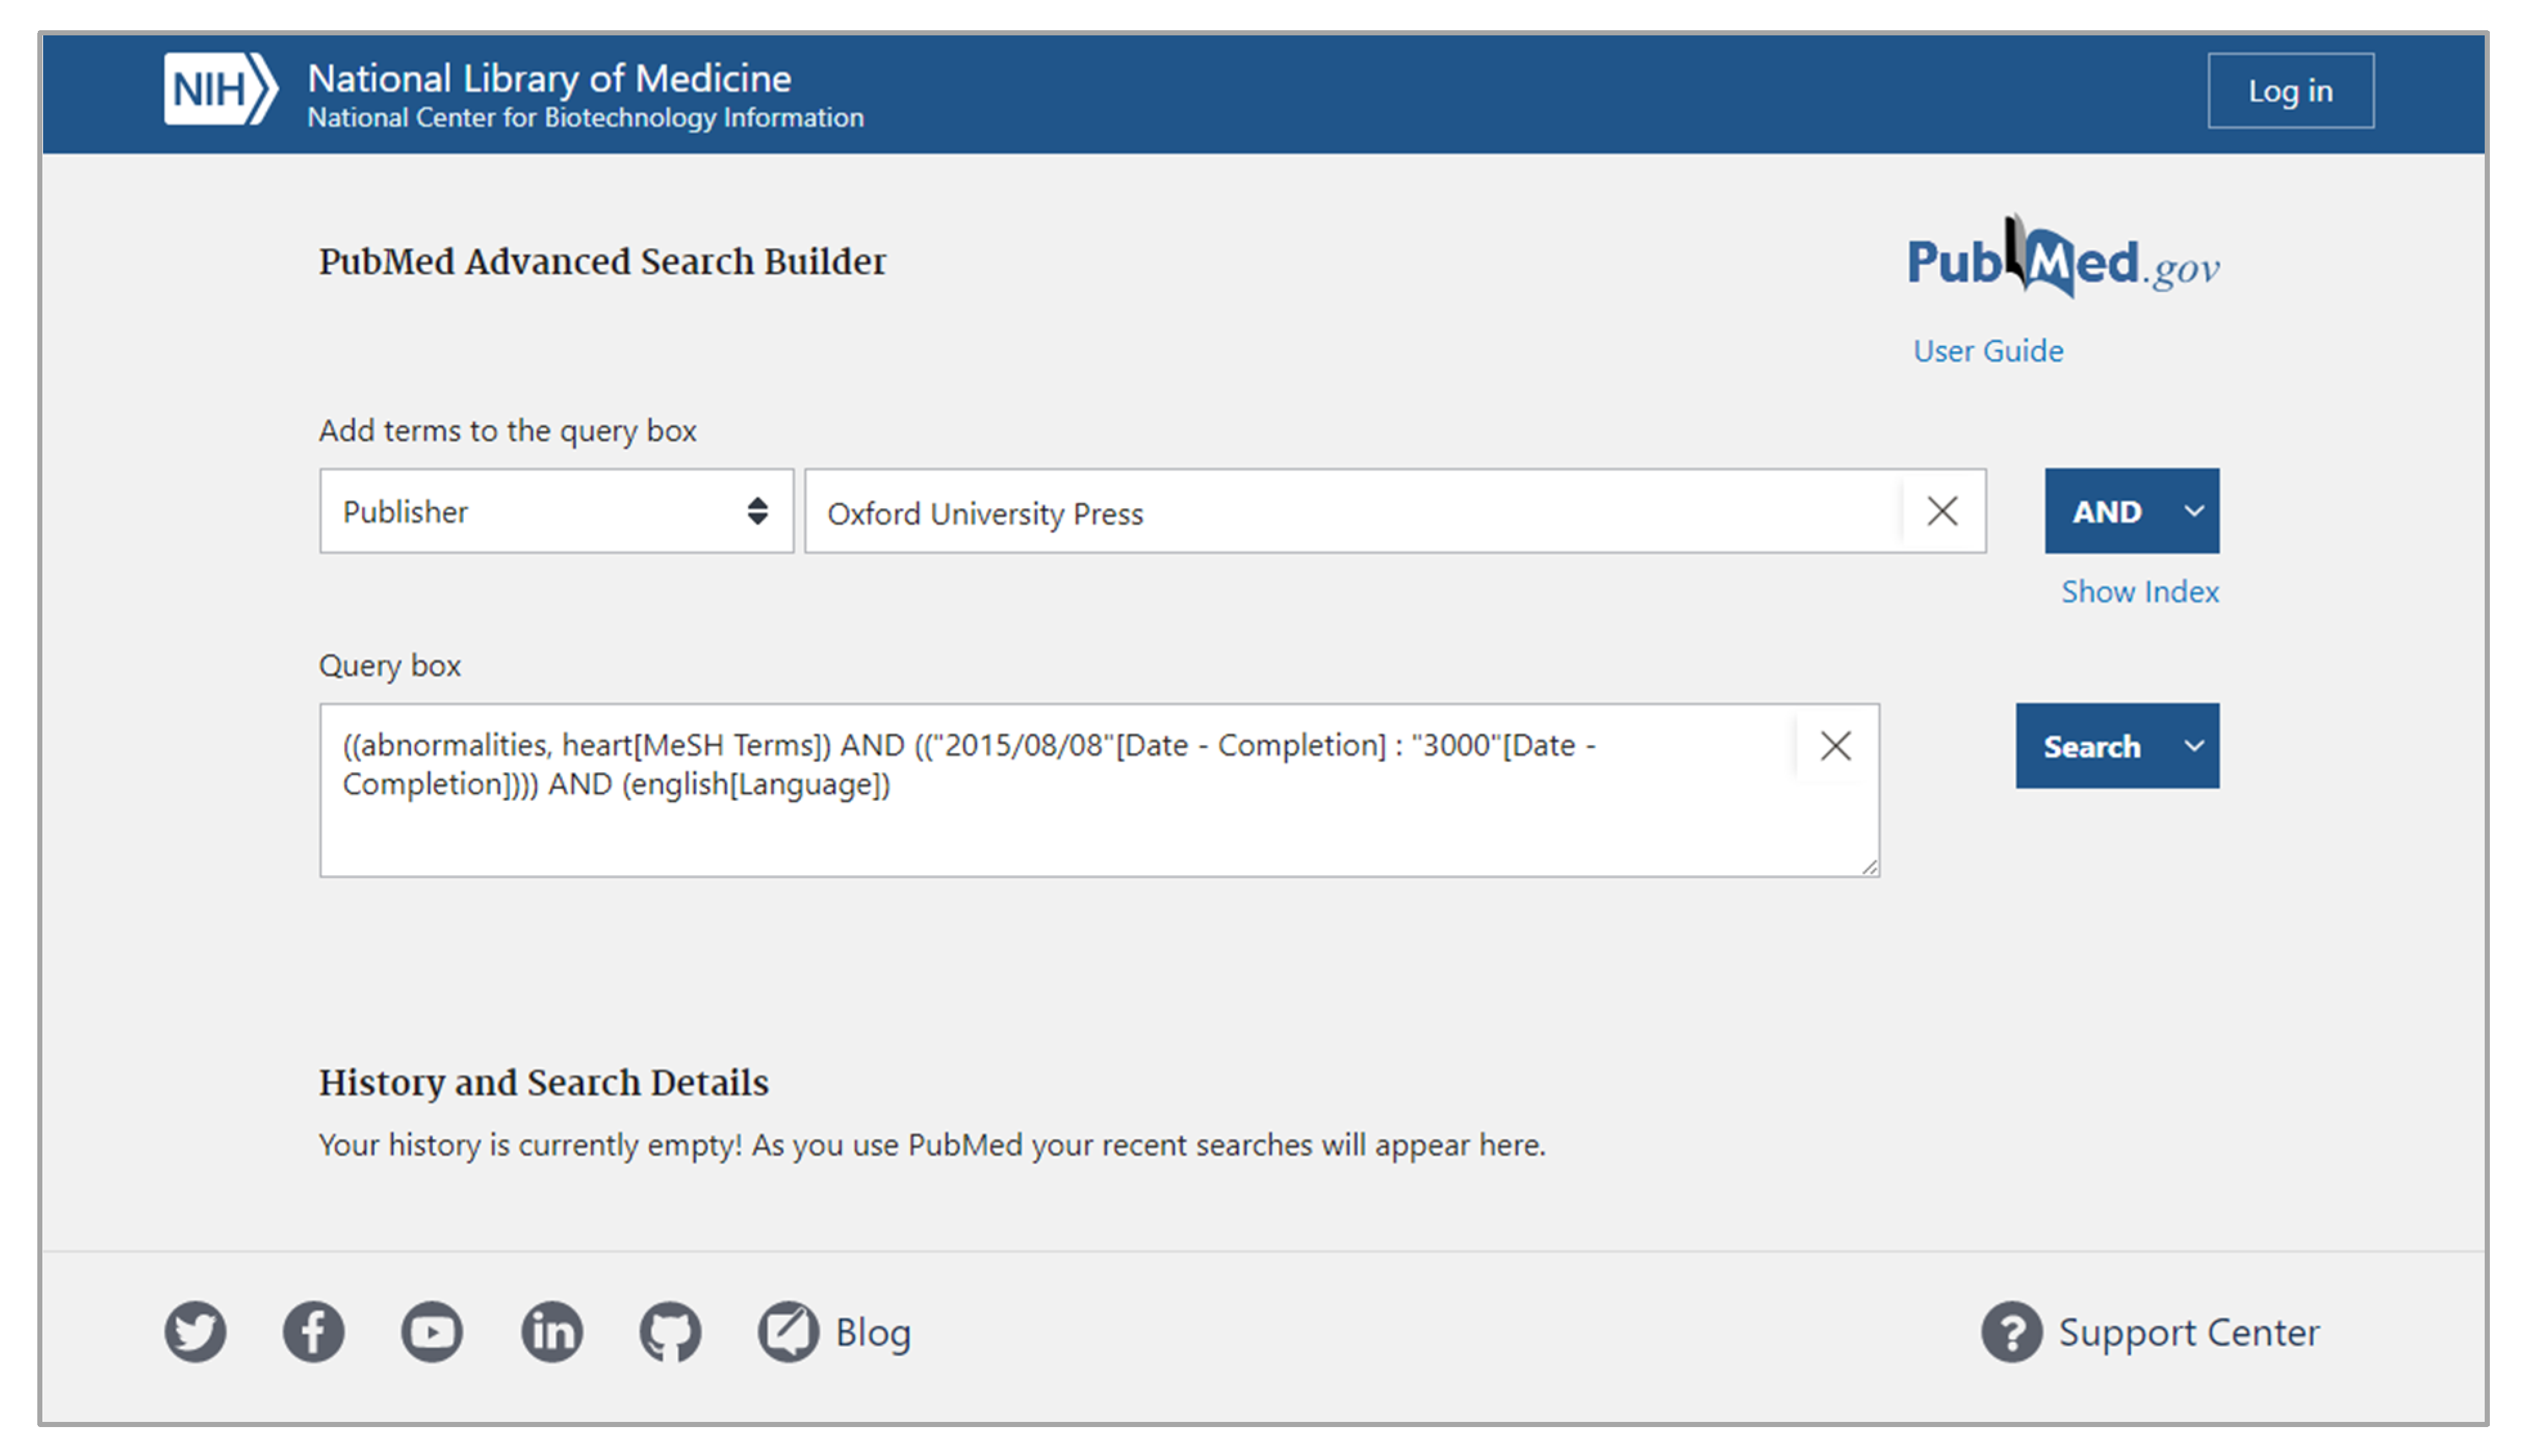
File:Fig1 Demelo Information21 12-8.png ...i.nlm.nih.gov/advanced/ public web portal] provided by the National Center for Biotechnical Information. |Source={{cite journal |title=Design of generalized search interfaces for health informatics |journal=Information |author=Demelo, J.; Sedig, K. |volu(3,921 × 2,264 (1.17 MB)) - 22:12, 23 September 2021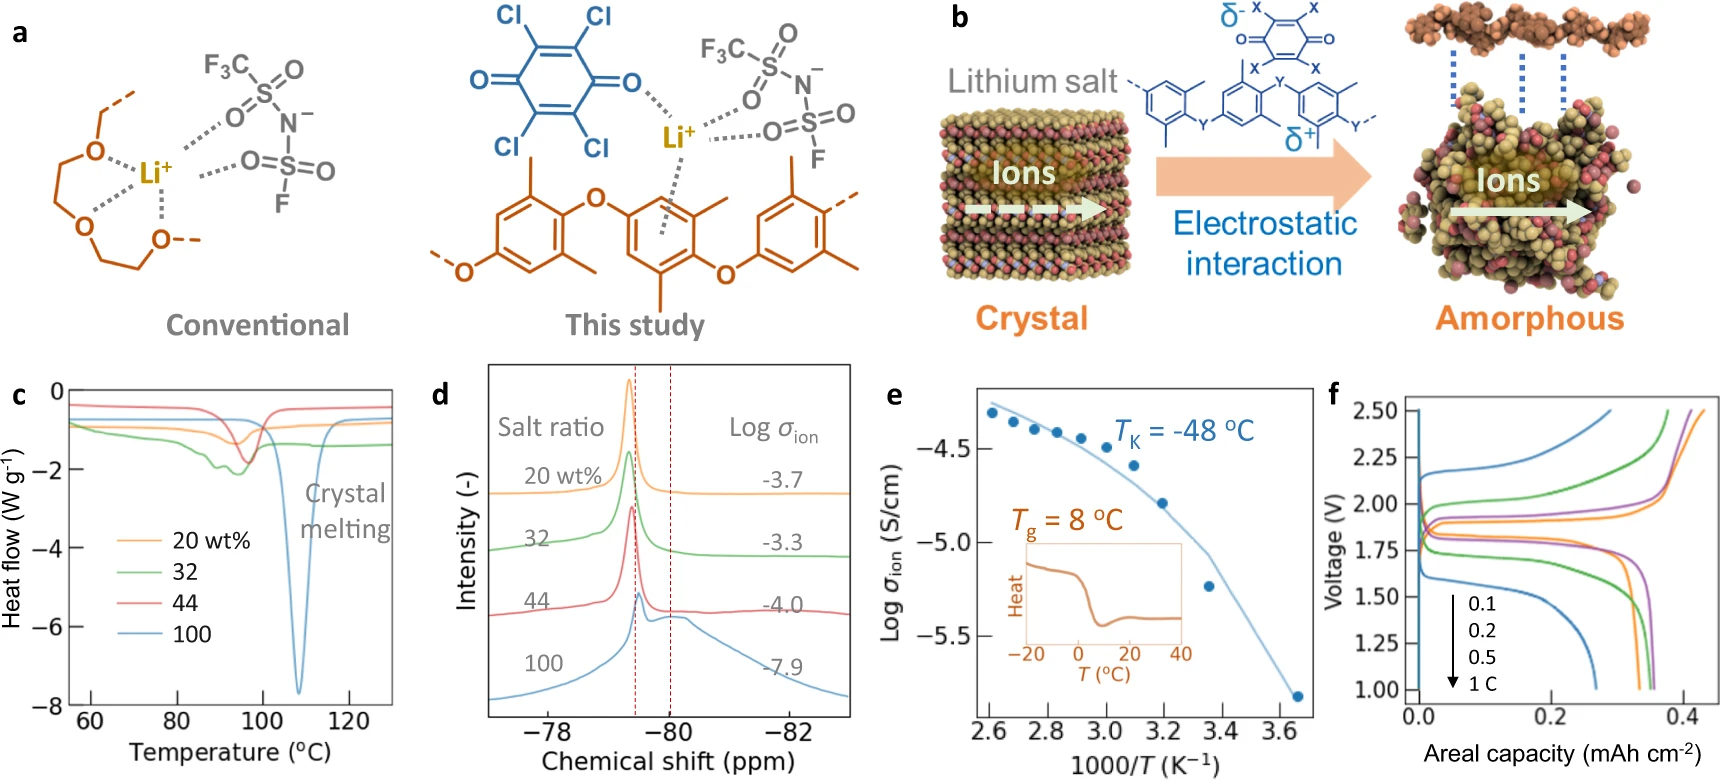
File:Fig4 Hatakeyama-Sato njpCompMat22 8.png ...Inset: DSC for the pristine LiFTFSI salt. '''f''' Charge/discharge curves for a solid-state lithium-ion battery containing PPO/benzoquinone = 8/2 wit(1,721 × 780 (812 KB)) - 22:16, 2 November 2022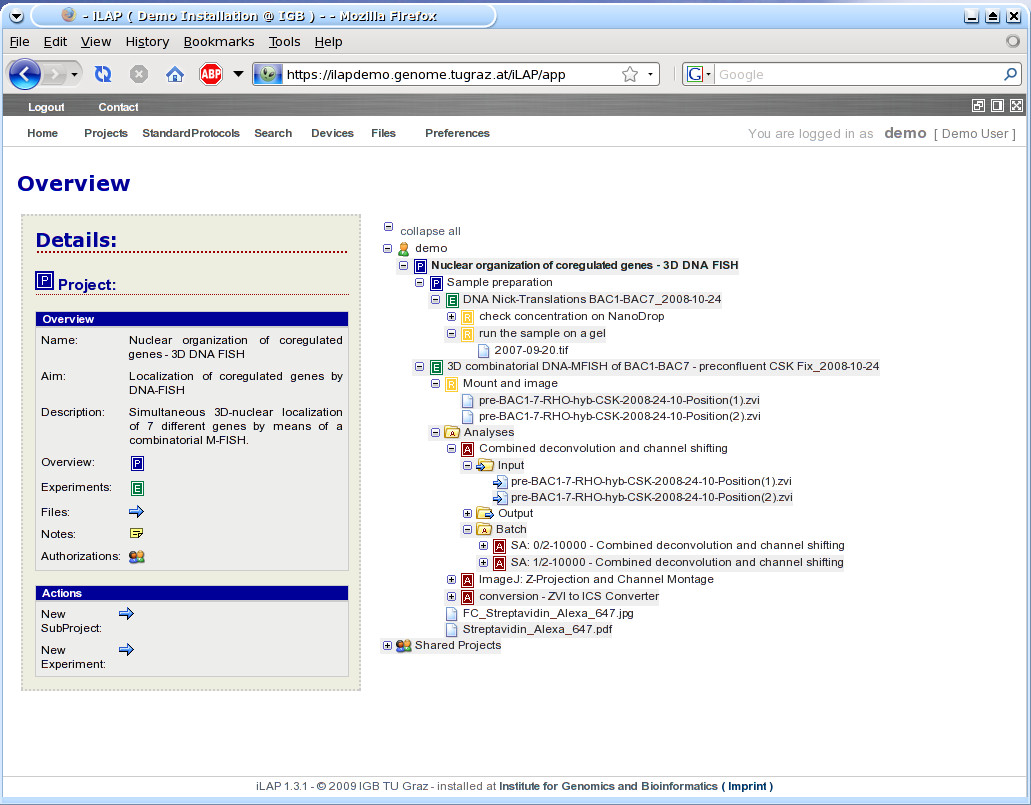
File:Fig3 Stocker BMCBioinformatics2009 10.jpg ...d for projects and sub-projects, the E-icon for experiments and the A-icon for analysis steps. Files attached to protocol steps are considered as raw file ...biomedcentral.com/1471-2105/10/390 |title=iLAP: a workflow-driven software for experimental protocol development, data acquisition and analysis |journal=B(1,031 × 805 (211 KB)) - 16:48, 19 August 2015


