Search results
From LIMSWiki
Jump to navigationJump to search
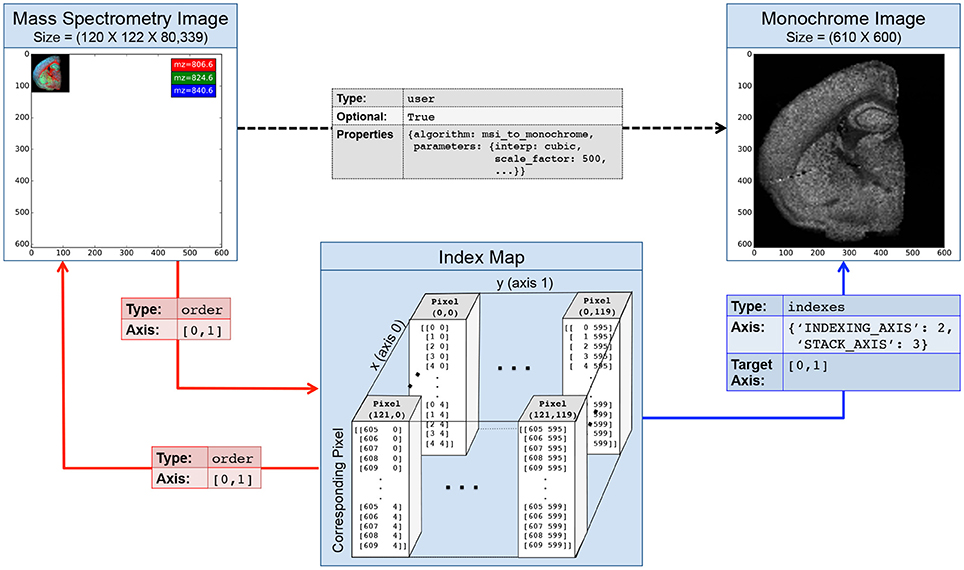
File:Fig4 Rubel FInNeuroinformatics2016 10.jpg ...the inverse mapping between the original and processed image via a second index map relationship. |Source={{cite journal |title=Methods for specifying scientific data standards and modeling relationships with applic(964 × 570 (257 KB)) - 21:47, 20 February 2017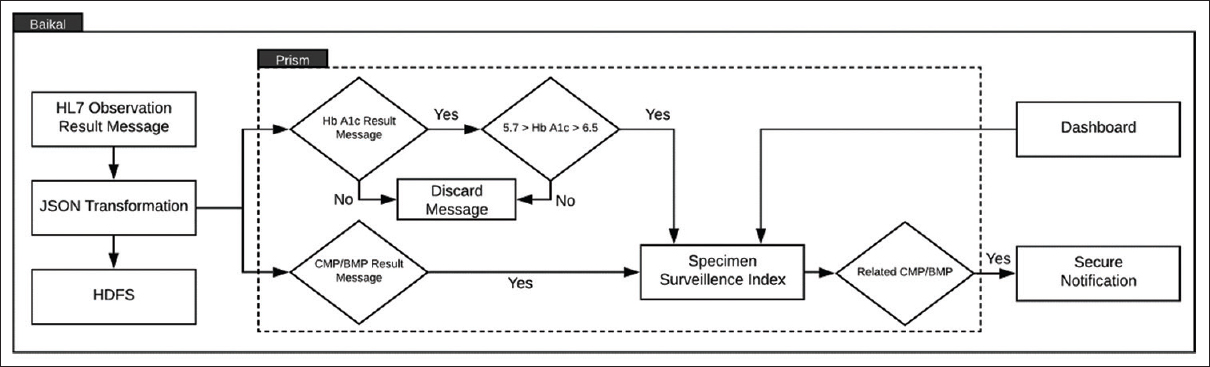
File:Fig4 Durant JofPathInfo2020 11.jpg ...top specimens) are sent to the Prism index. Secure notifications are sent for A1C specimen IDs with related light-green specimen info. BMP: Basic Metabol ...ging the collaboration gap: Real-time identification of clinical specimens for biomedical research |journal=Journal of Pathology Informatics |author=Duran(1,210 × 367 (184 KB)) - 17:10, 2 June 2020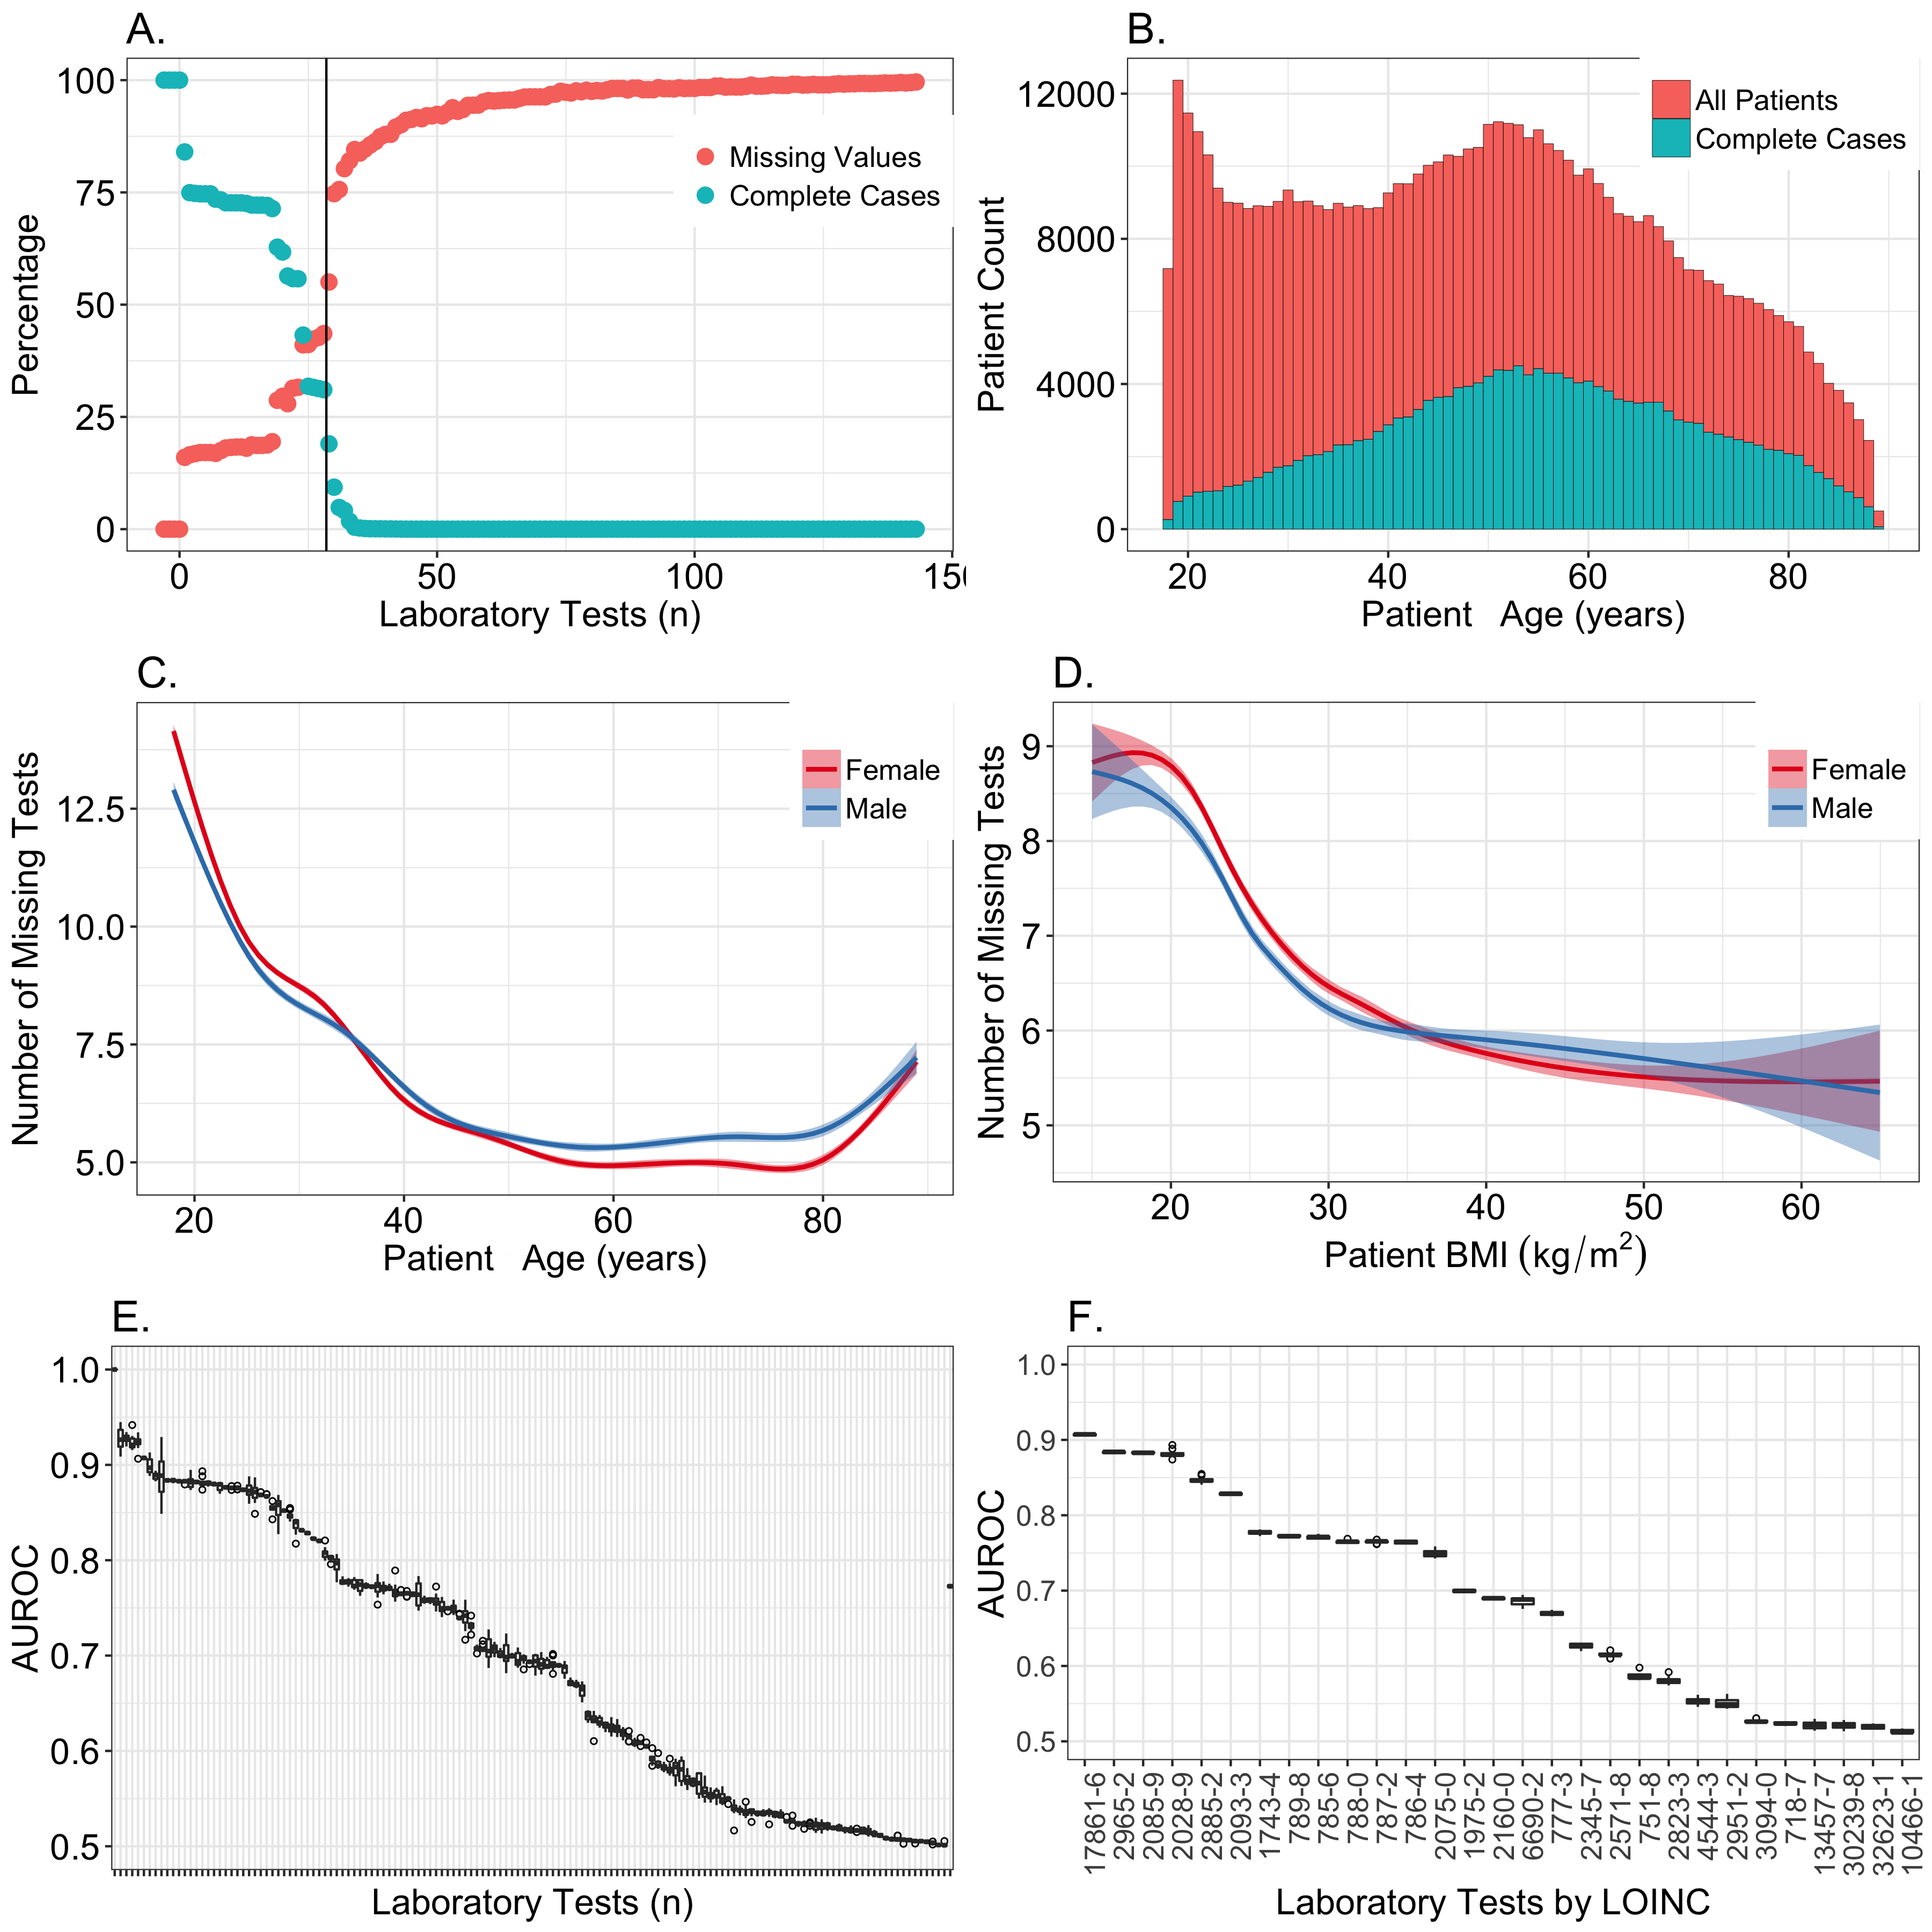
File:Fig2 Beaulieu-JonesJMIRMedInfo2018 6-1.png ...n, the mean number of missing tests is depicted as a function of body mass index (BMI). '''(E)''' Accuracy of a random forest predicting the presence or abs(3,600 × 3,600 (694 KB)) - 19:52, 6 March 2018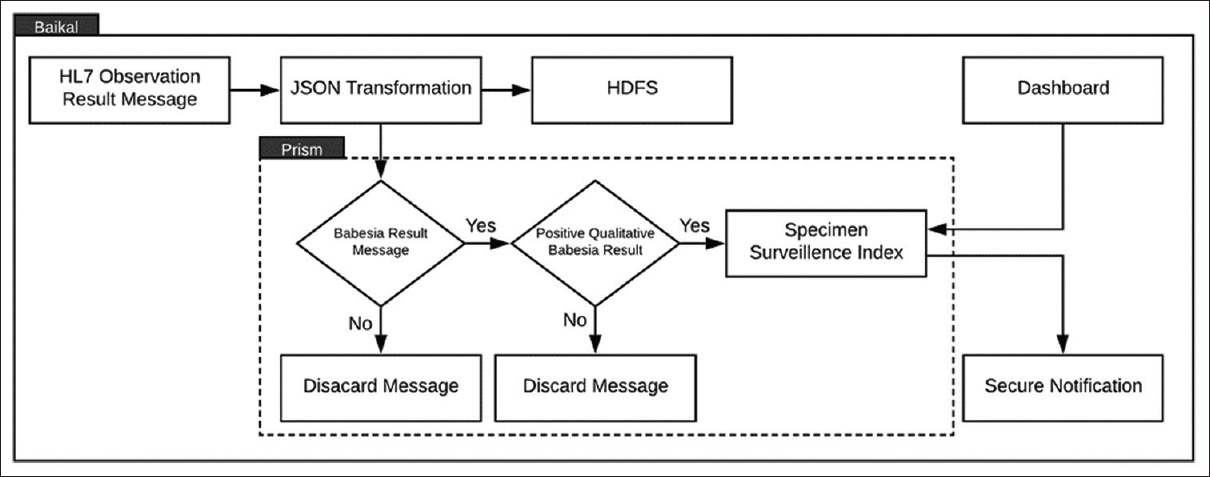
File:Fig2 Durant JofPathInfo2020 11.jpg ...nd filters “Positive” Babesia results to the “Prism” Specimen Surveillance Index from which secure notifications of positive Babesia results are generated. ...ging the collaboration gap: Real-time identification of clinical specimens for biomedical research |journal=Journal of Pathology Informatics |author=Duran(1,210 × 477 (214 KB)) - 16:48, 2 June 2020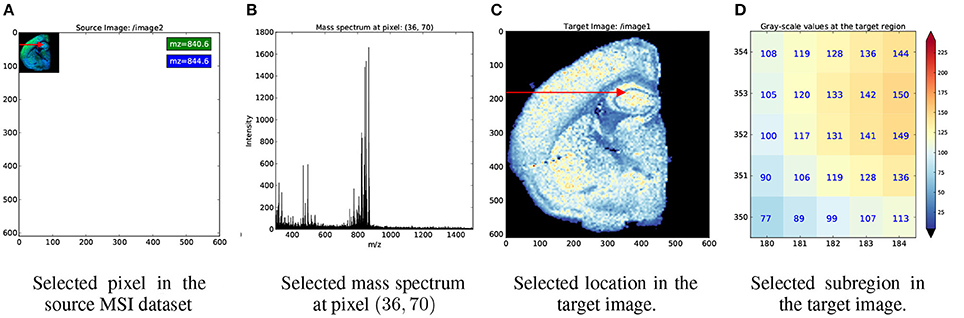
File:Fig5 Rubel FInNeuroinformatics2016 10.jpg ...'''Figure 5.''' Example showing the application of index map relationships for data selection. '''(A)''' First we apply the selection [36, 70] (red arrow) |Source={{cite journal |title=Methods for specifying scientific data standards and modeling relationships with applic(964 × 318 (187 KB)) - 21:51, 20 February 2017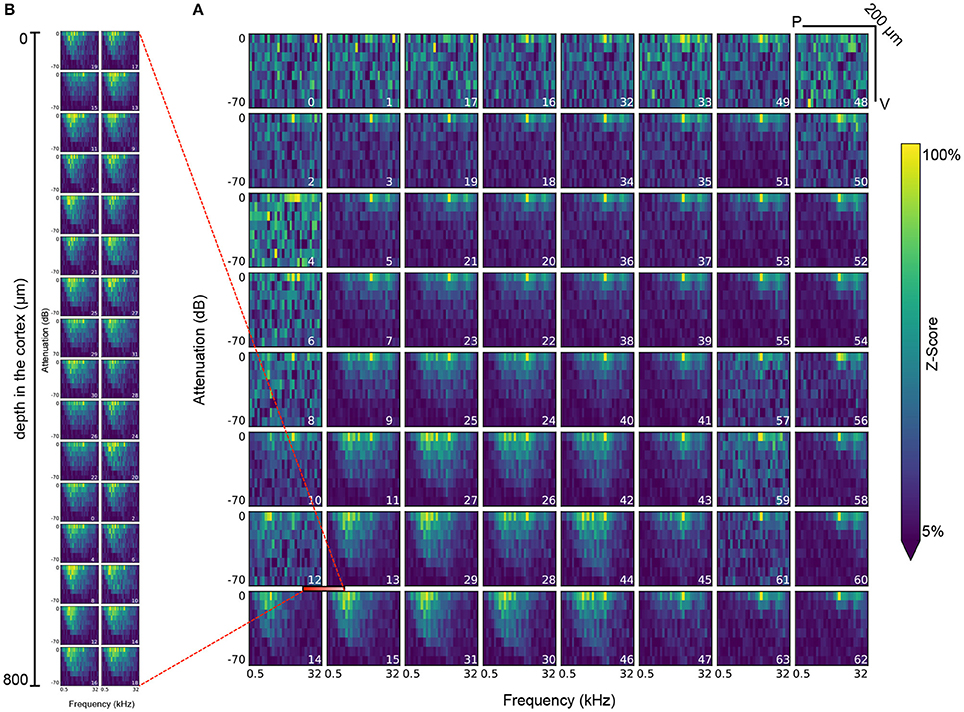
File:Fig8 Rubel FInNeuroinformatics2016 10.jpg ...corresponding amplitude and frequency. Each stimulus is presented 20 times for 300''ms'' each throughout the experiment. |Source={{cite journal |title=Methods for specifying scientific data standards and modeling relationships with applic(964 × 712 (680 KB)) - 22:23, 20 February 2017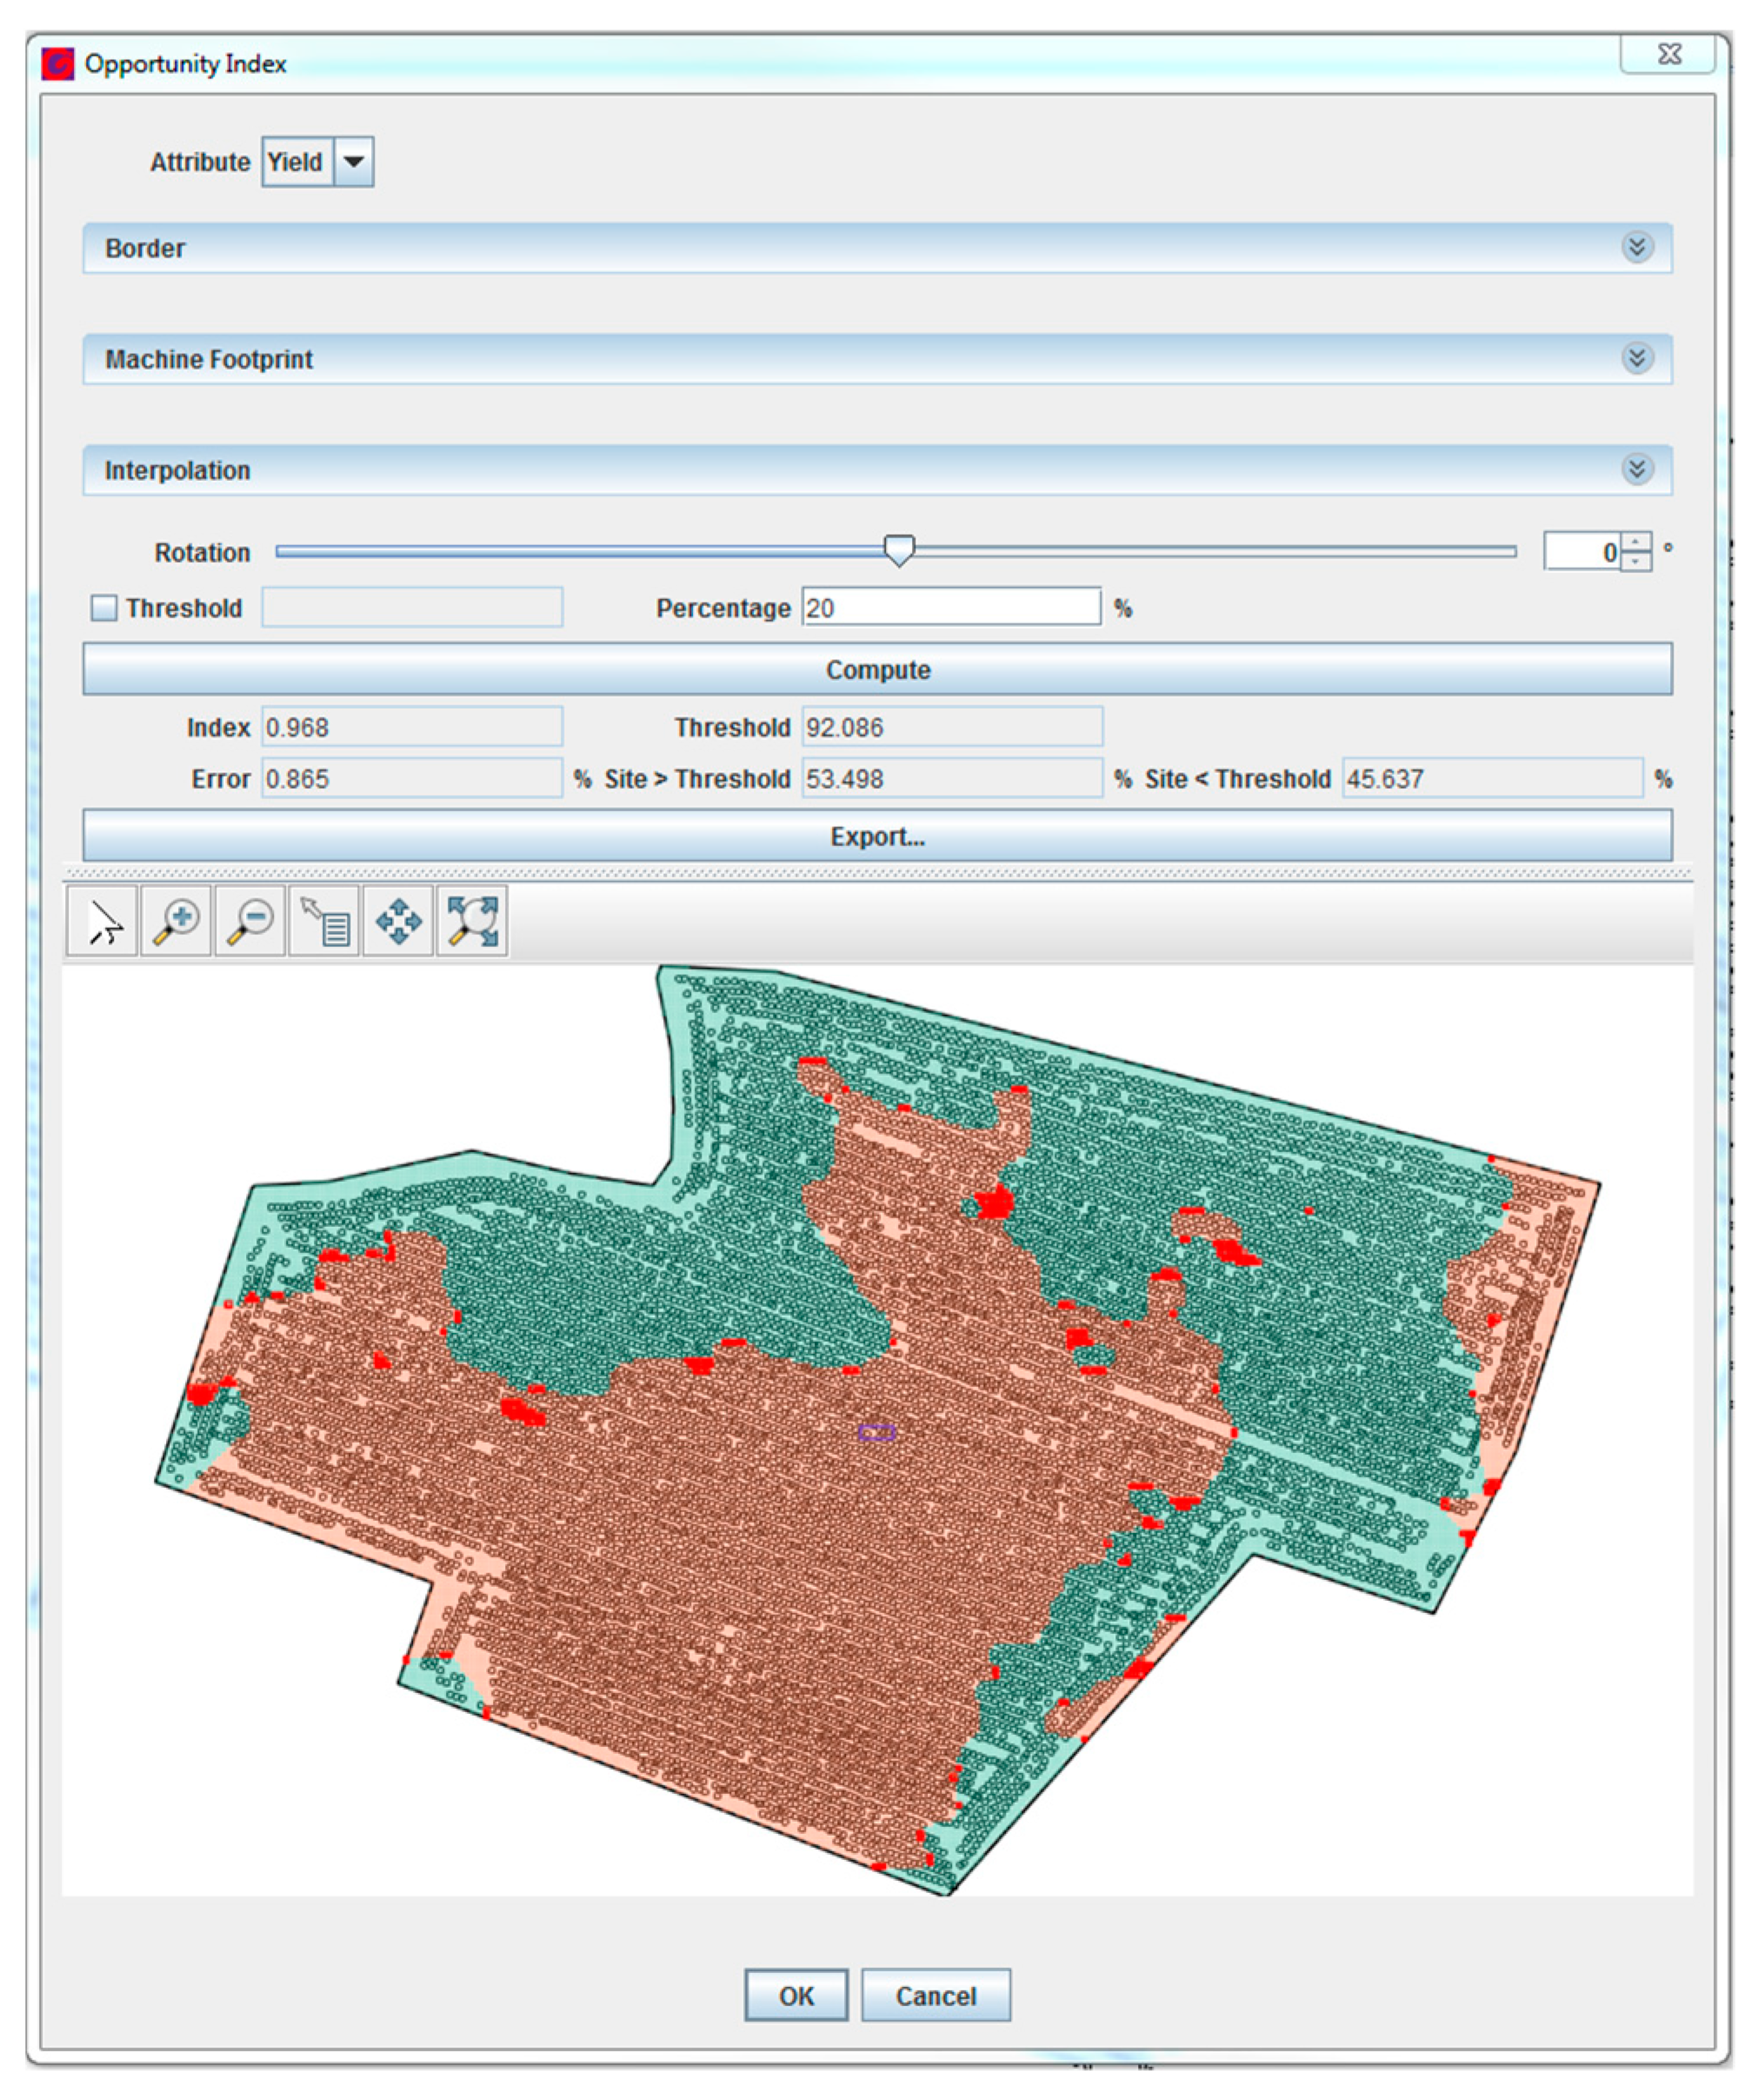
File:Fig7 Leroux Agri2018 8-6.png ...ut from the computation of the Technical Opportunity Index (TOI) in GeoFIS for Field 7 |Source={{cite journal |title=GeoFIS: An open-source decision support tool for precision agriculture data |journal=Agriculture |author=Leroux, C.; Jones,(2,029 × 2,415 (2.7 MB)) - 21:44, 10 July 2018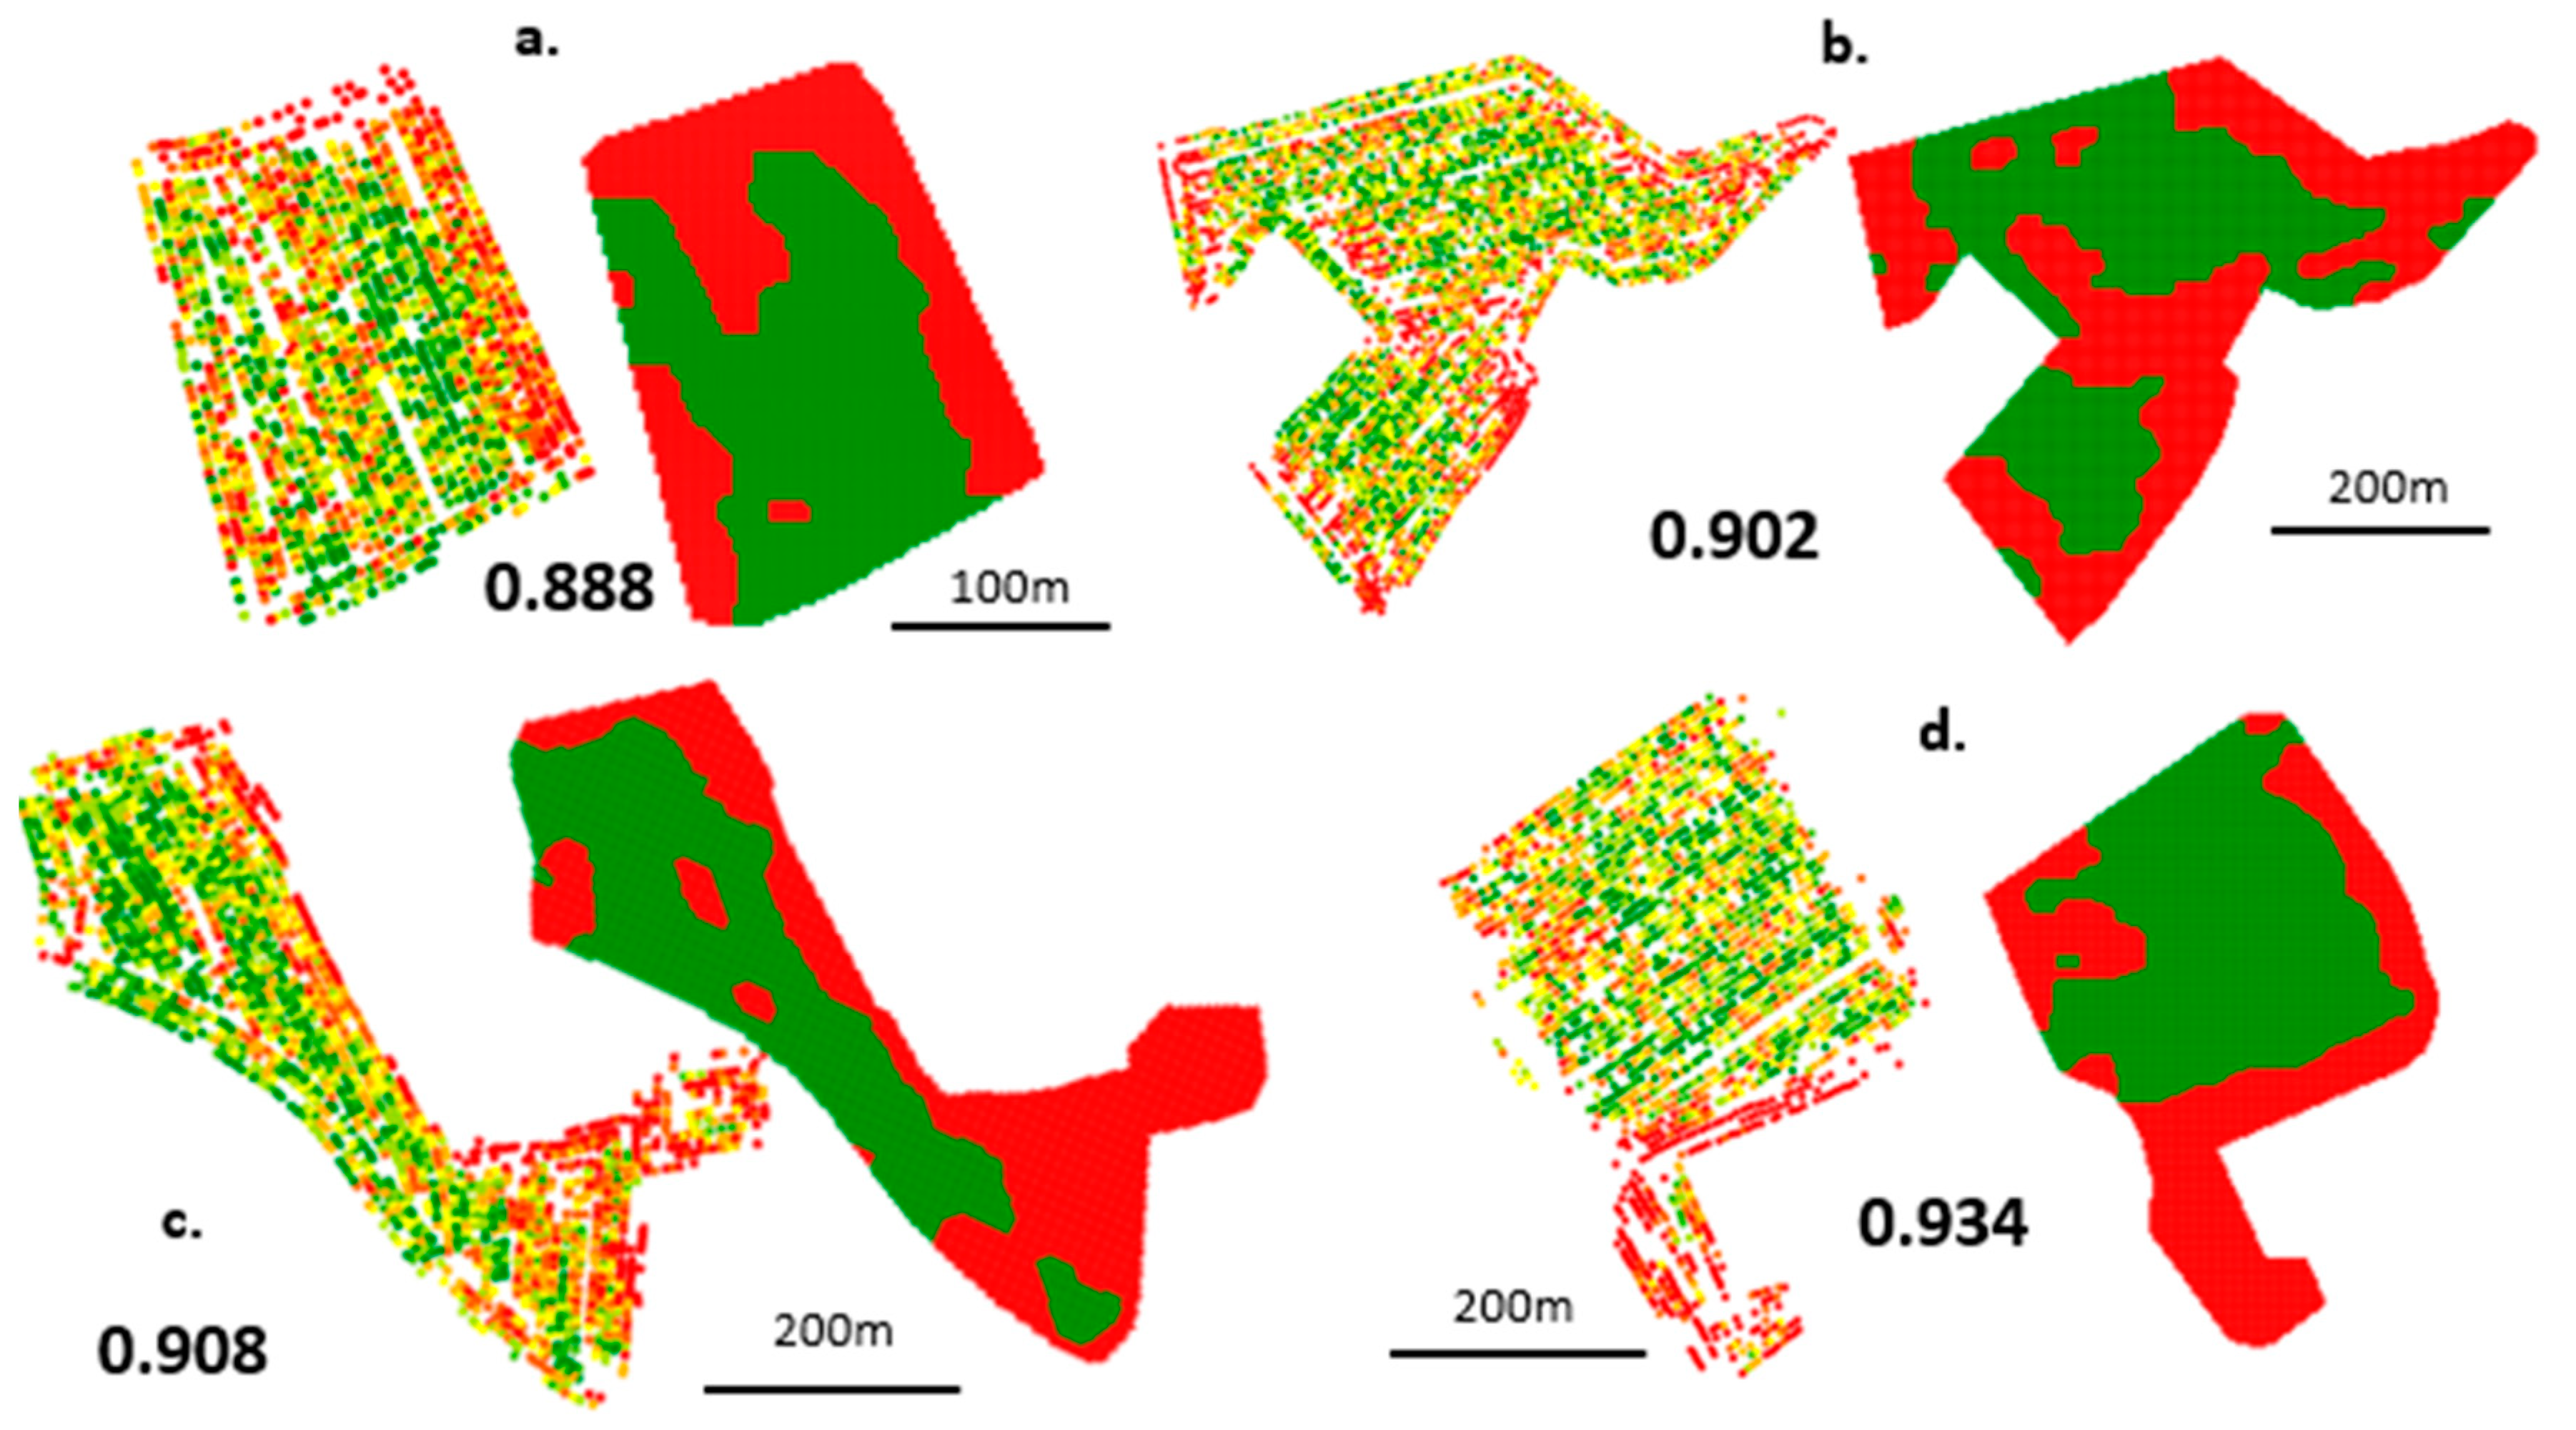
File:Fig8 Leroux Agri2018 8-6.png ...ication maps are also displayed for each field. TOI: technical opportunity index |Source={{cite journal |title=GeoFIS: An open-source decision support tool for precision agriculture data |journal=Agriculture |author=Leroux, C.; Jones,(3,604 × 2,000 (2.88 MB)) - 21:49, 10 July 2018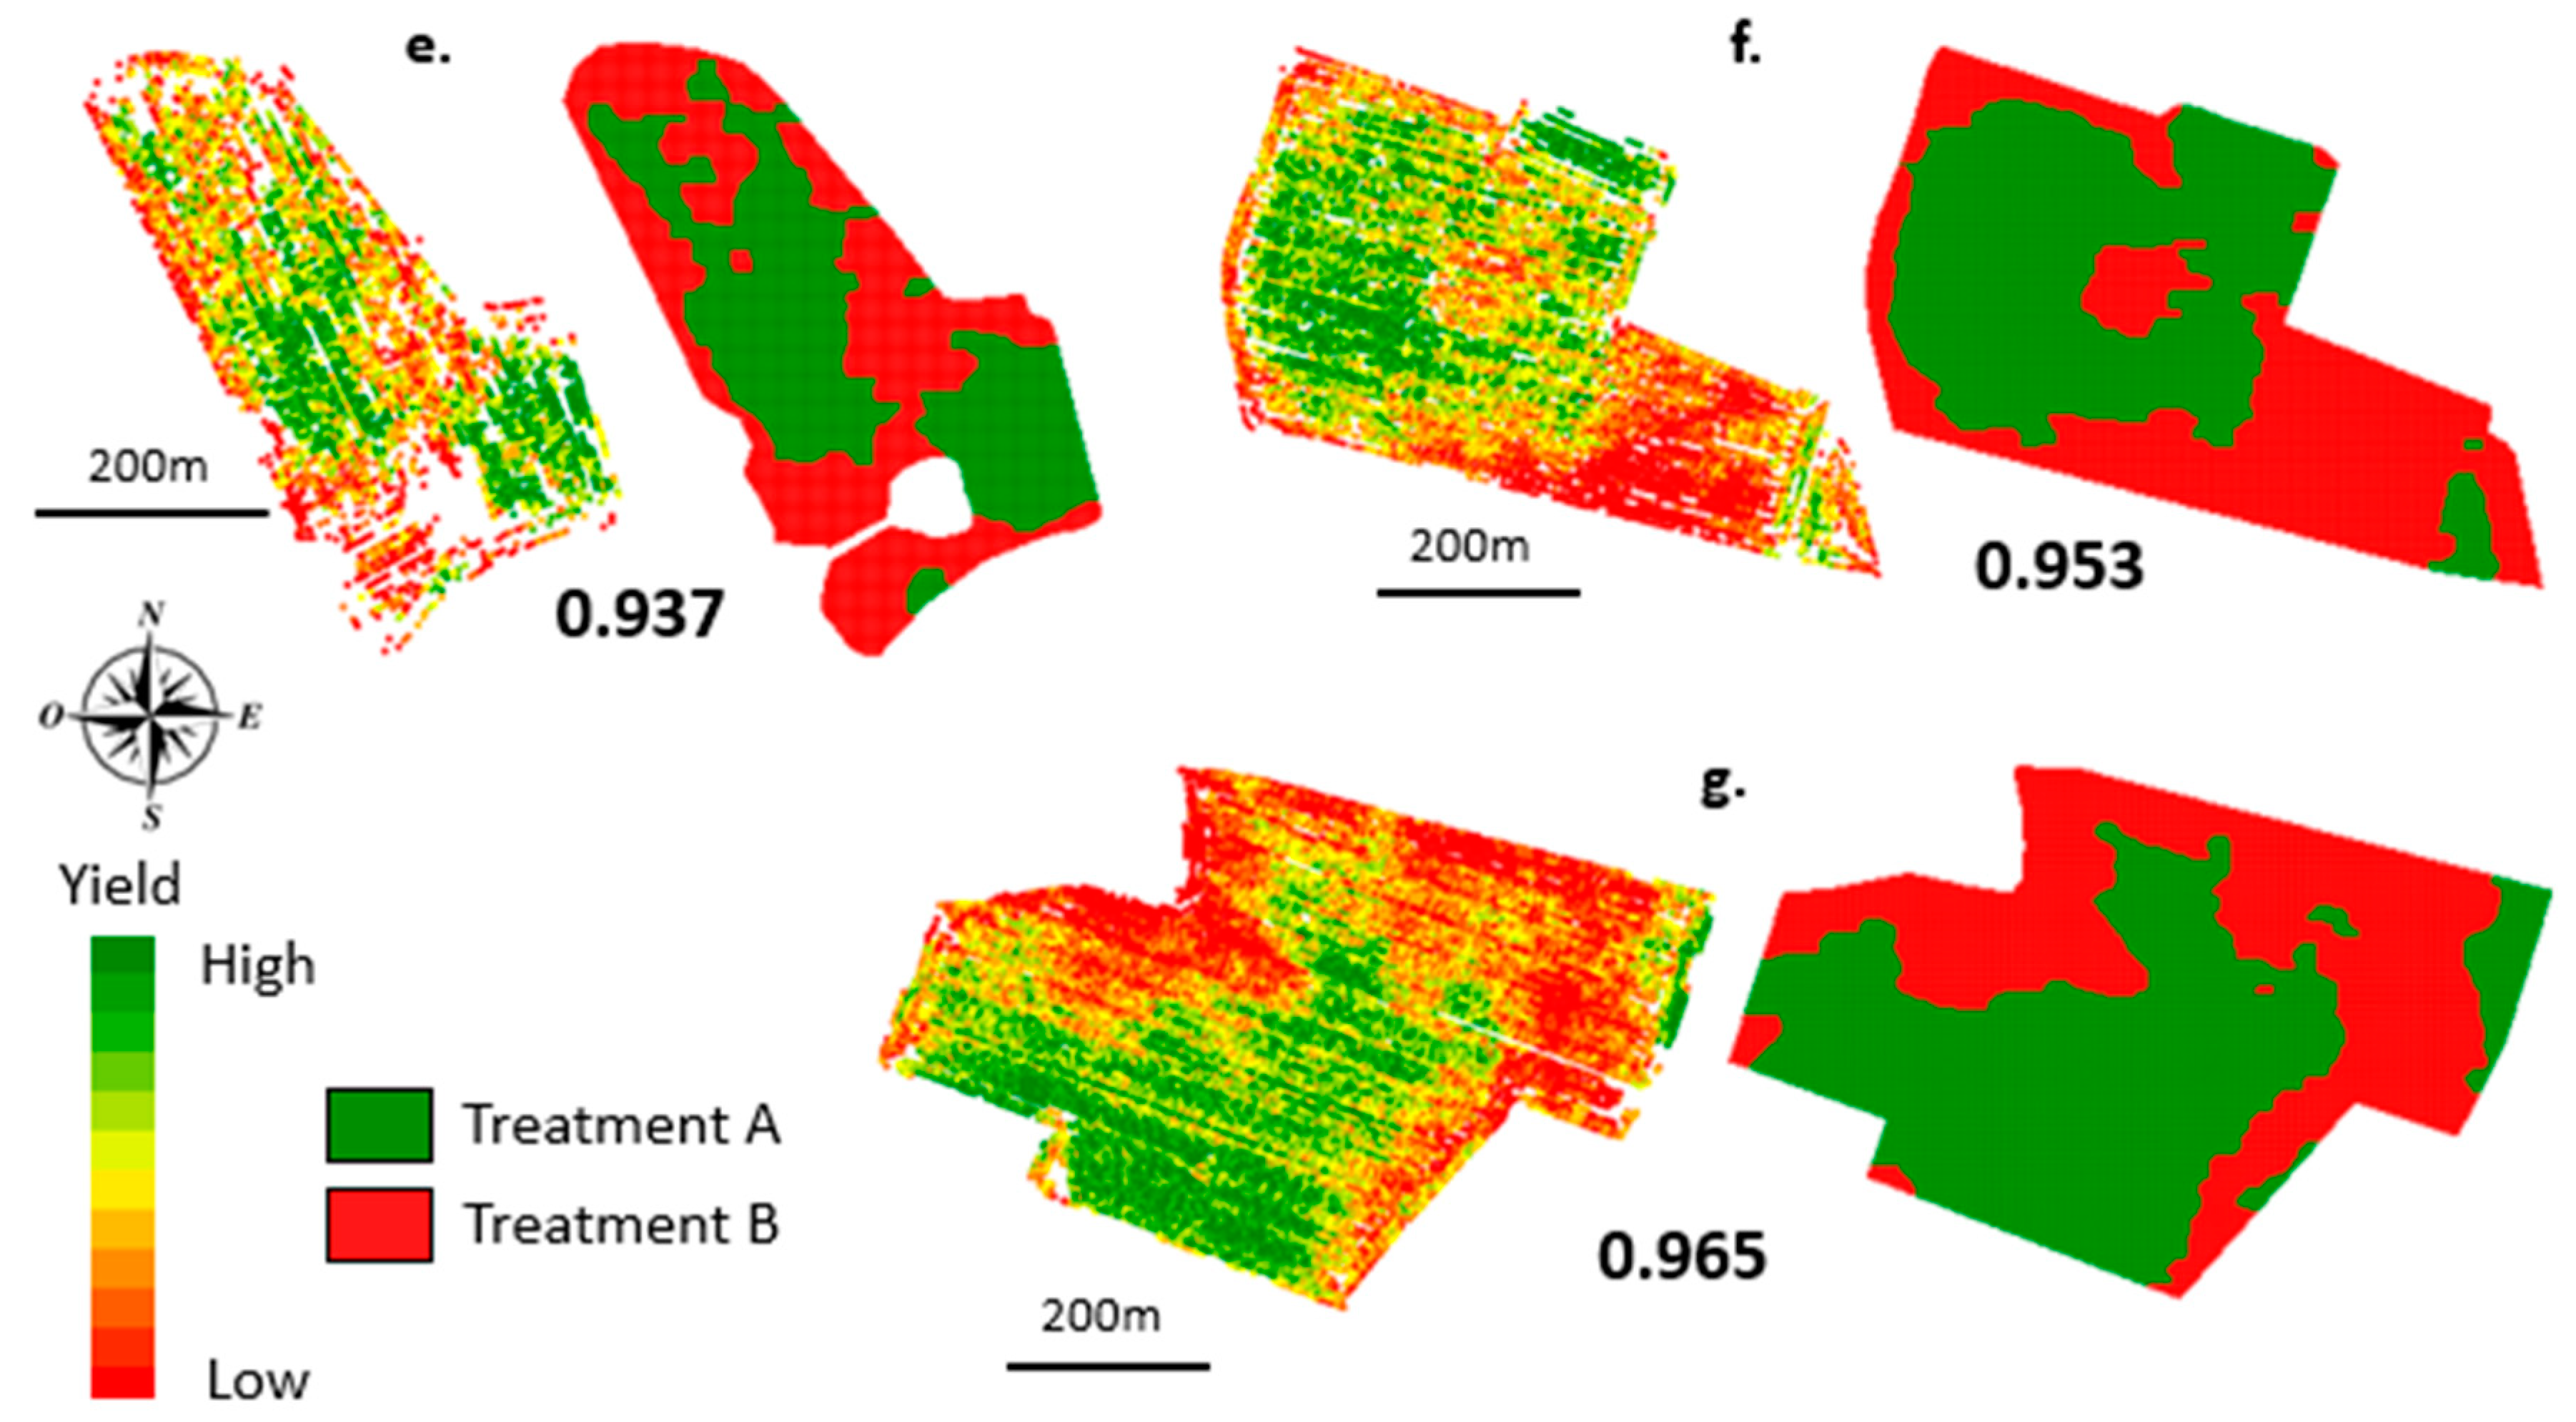
File:Fig8b Leroux Agri2018 8-6.png ...ication maps are also displayed for each field. TOI: technical opportunity index |Source={{cite journal |title=GeoFIS: An open-source decision support tool for precision agriculture data |journal=Agriculture |author=Leroux, C.; Jones,(3,604 × 1,990 (2.35 MB)) - 21:53, 10 July 2018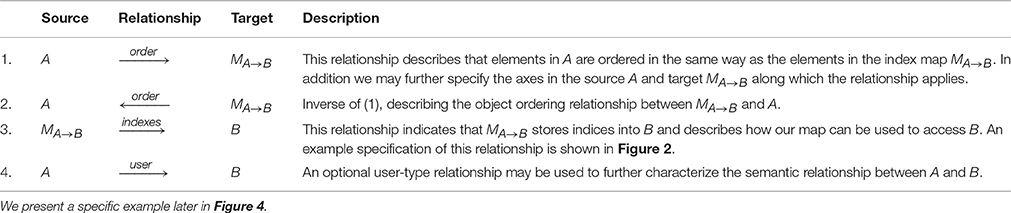
File:Tab1 Rubel FInNeuroinformatics2016 10.jpg ...='''Table 1.''' Overview of the relationships used to define an advanced ''index map relationship'' |Source={{cite journal |title=Methods for specifying scientific data standards and modeling relationships with applic(1,011 × 213 (123 KB)) - 21:27, 20 February 2017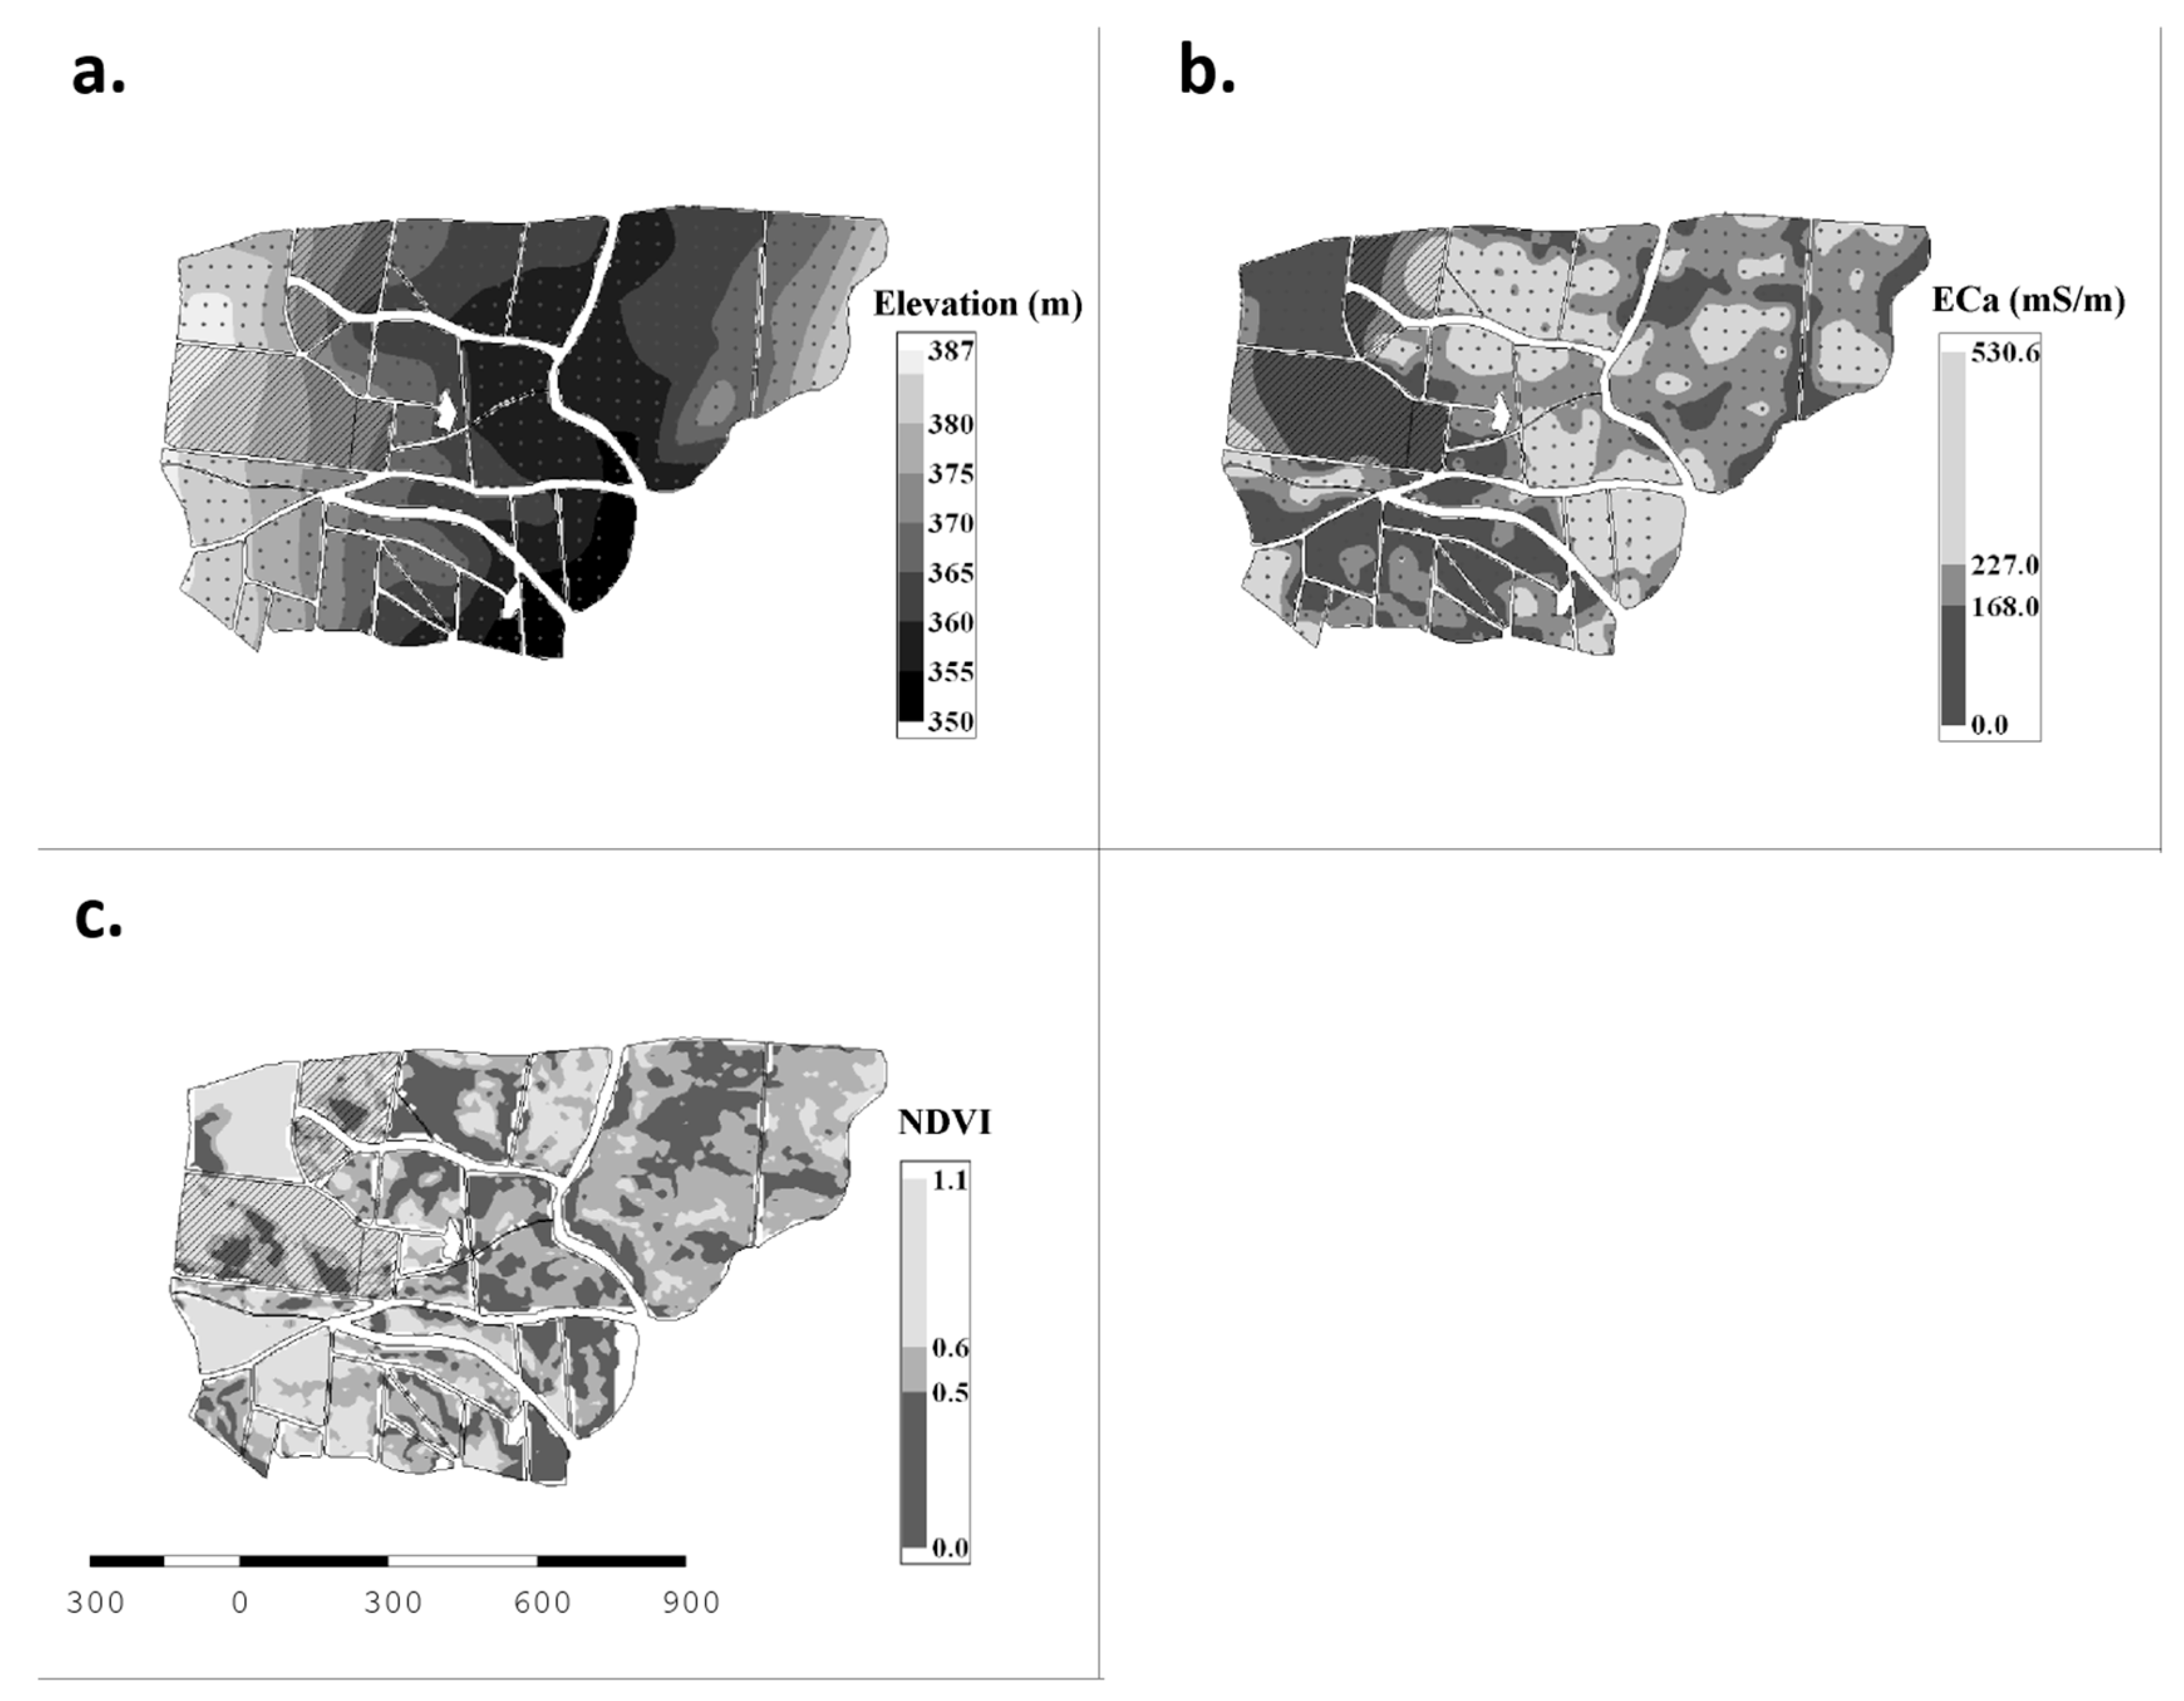
File:Fig9 Leroux Agri2018 8-6.png ...Ca); and ('''c''') vegetative expression (normalized difference vegetation index (NDVI)). Points in ('''a''', '''b''') indicate sampling locations (''n'' = |Source={{cite journal |title=GeoFIS: An open-source decision support tool for precision agriculture data |journal=Agriculture |author=Leroux, C.; Jones,(3,480 × 2,710 (963 KB)) - 22:08, 10 July 2018
File:Fig4 Oyashi GeospatialHlth2019 14-1.png ...esh (N 23.823, E 90.414); '''(B)''' Normalized Difference Vegetation Index for cropland around Kisum, Kenya (S 0.122, E 34.293).(950 × 450 (200 KB)) - 17:09, 6 August 2019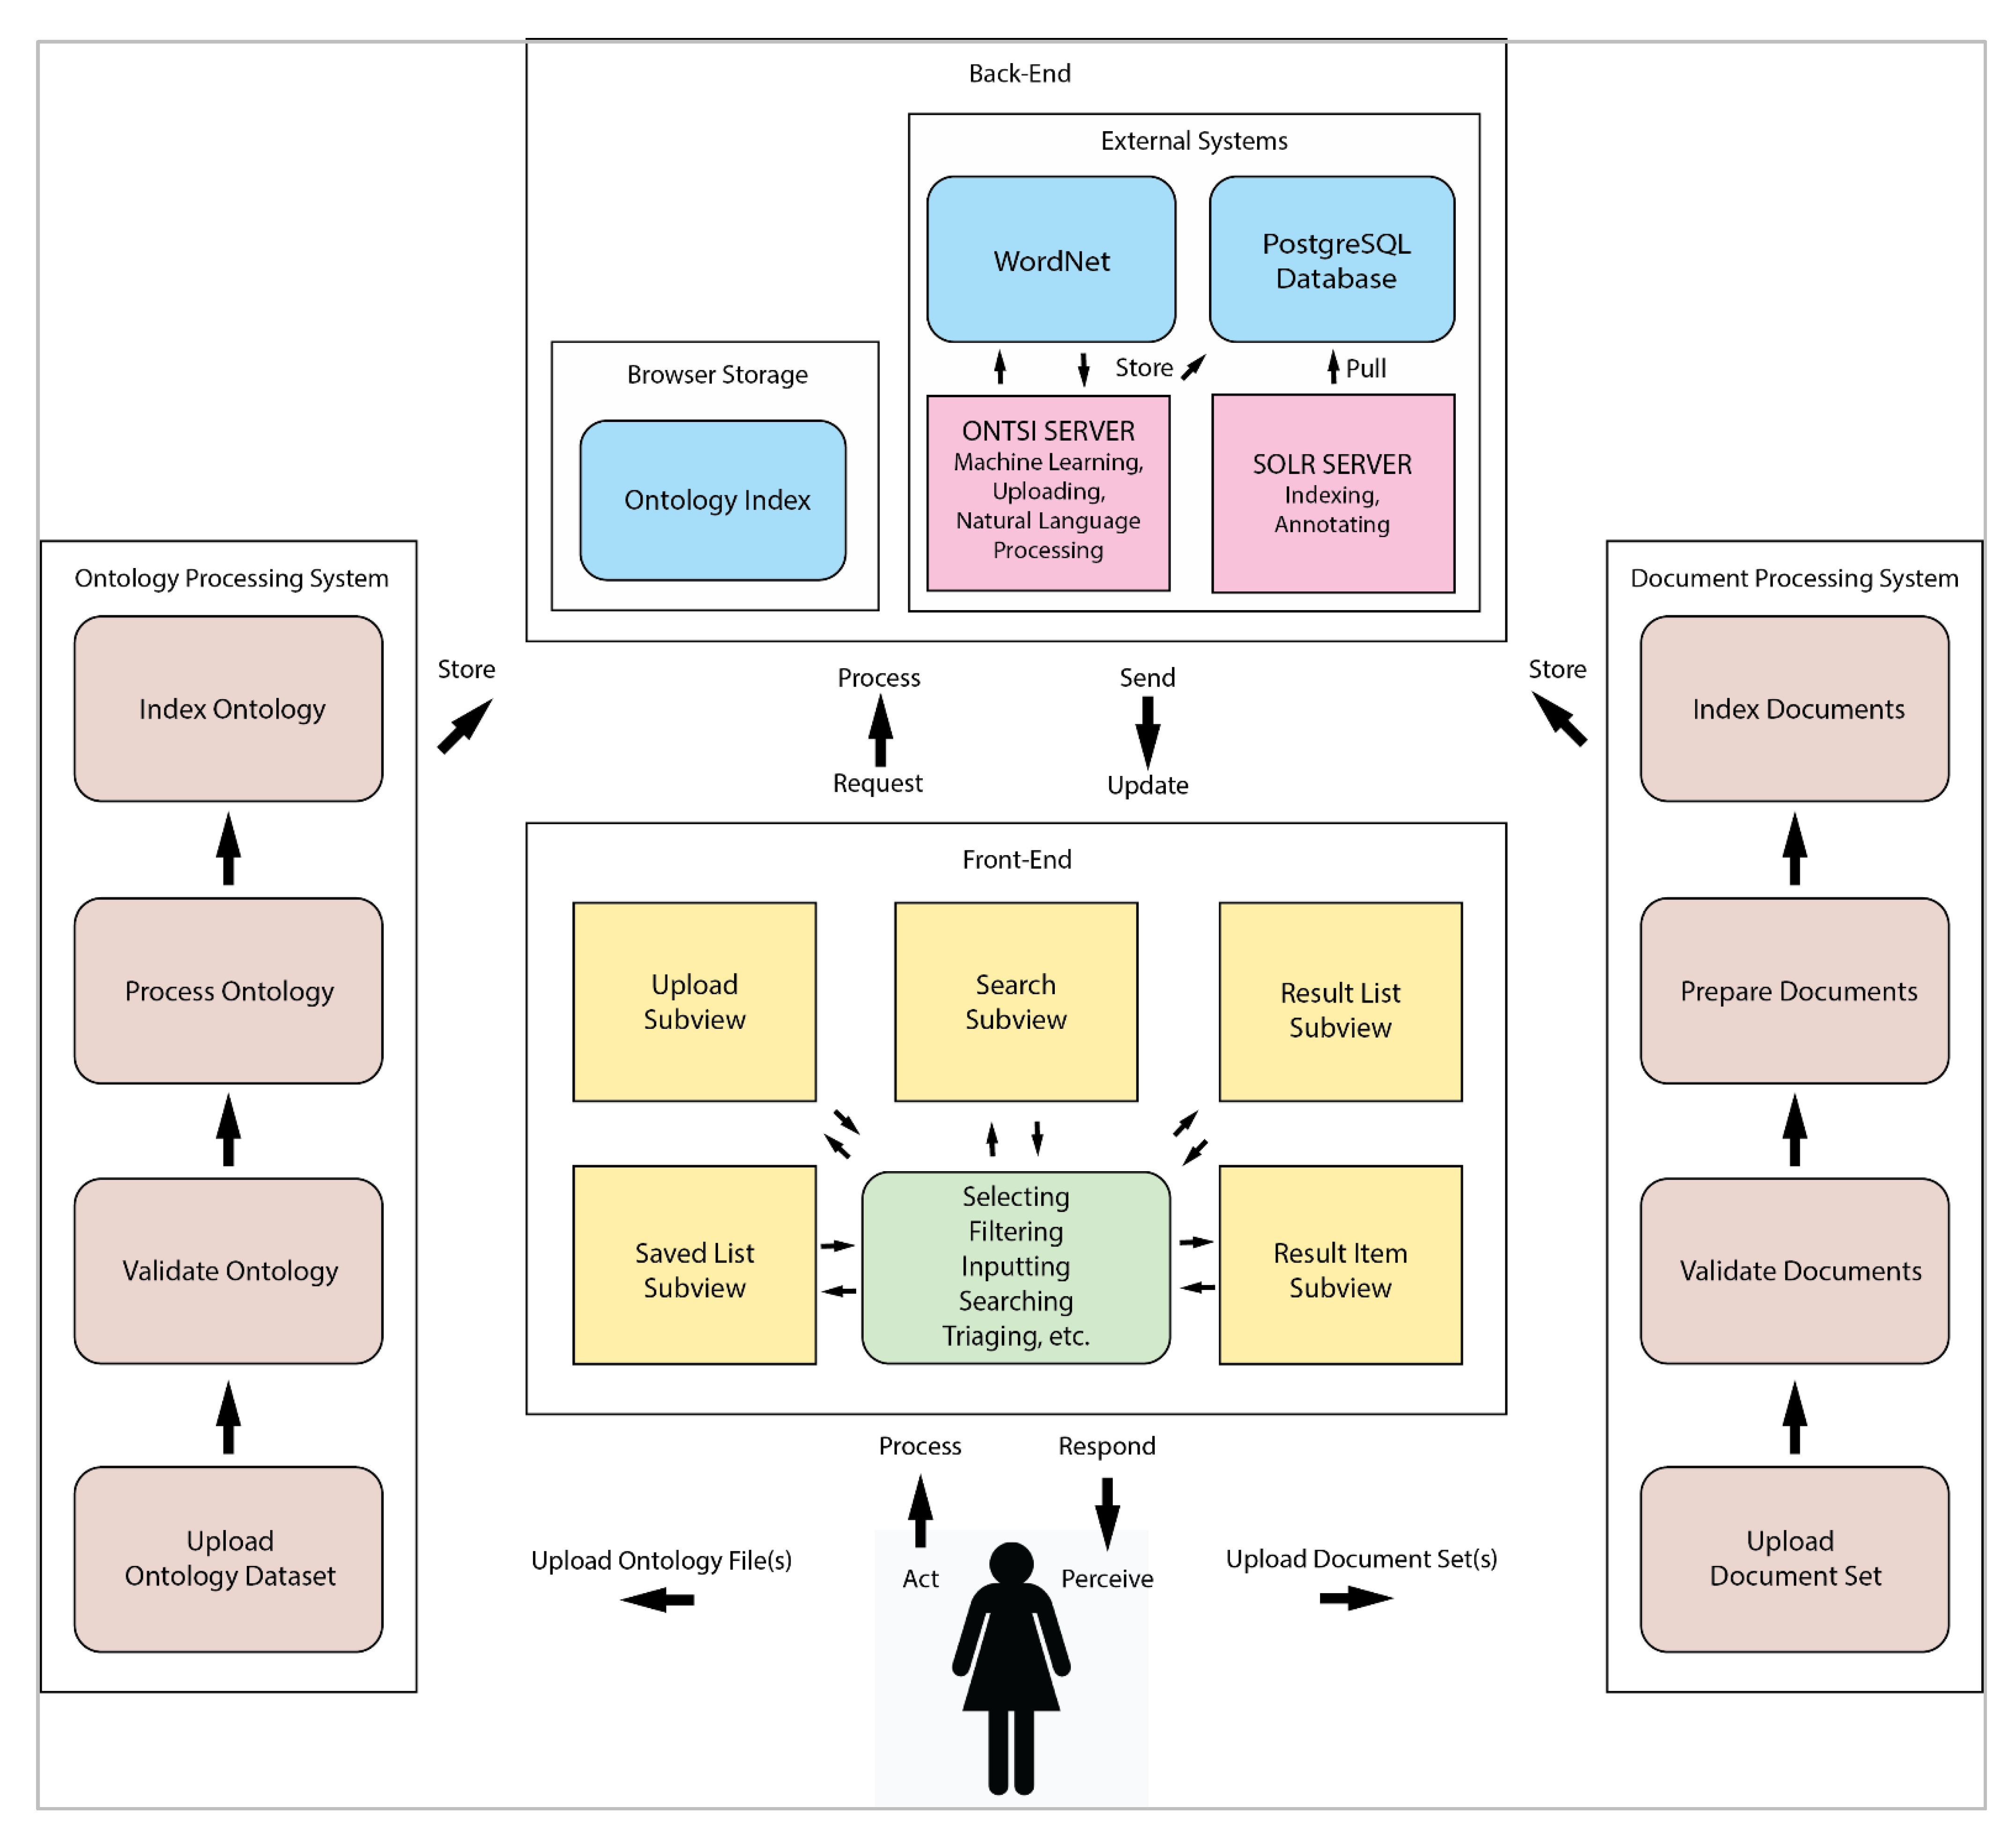
File:Fig4 Demelo Information21 12-8.png ...es represent the object types that persist within the browser and external index database storage. Pink boxes represent the back-end computational systems o |Source={{cite journal |title=Design of generalized search interfaces for health informatics |journal=Information |author=Demelo, J.; Sedig, K. |volu(4,304 × 3,925 (1.27 MB)) - 23:10, 23 September 2021


