Search results
From LIMSWiki
Jump to navigationJump to search
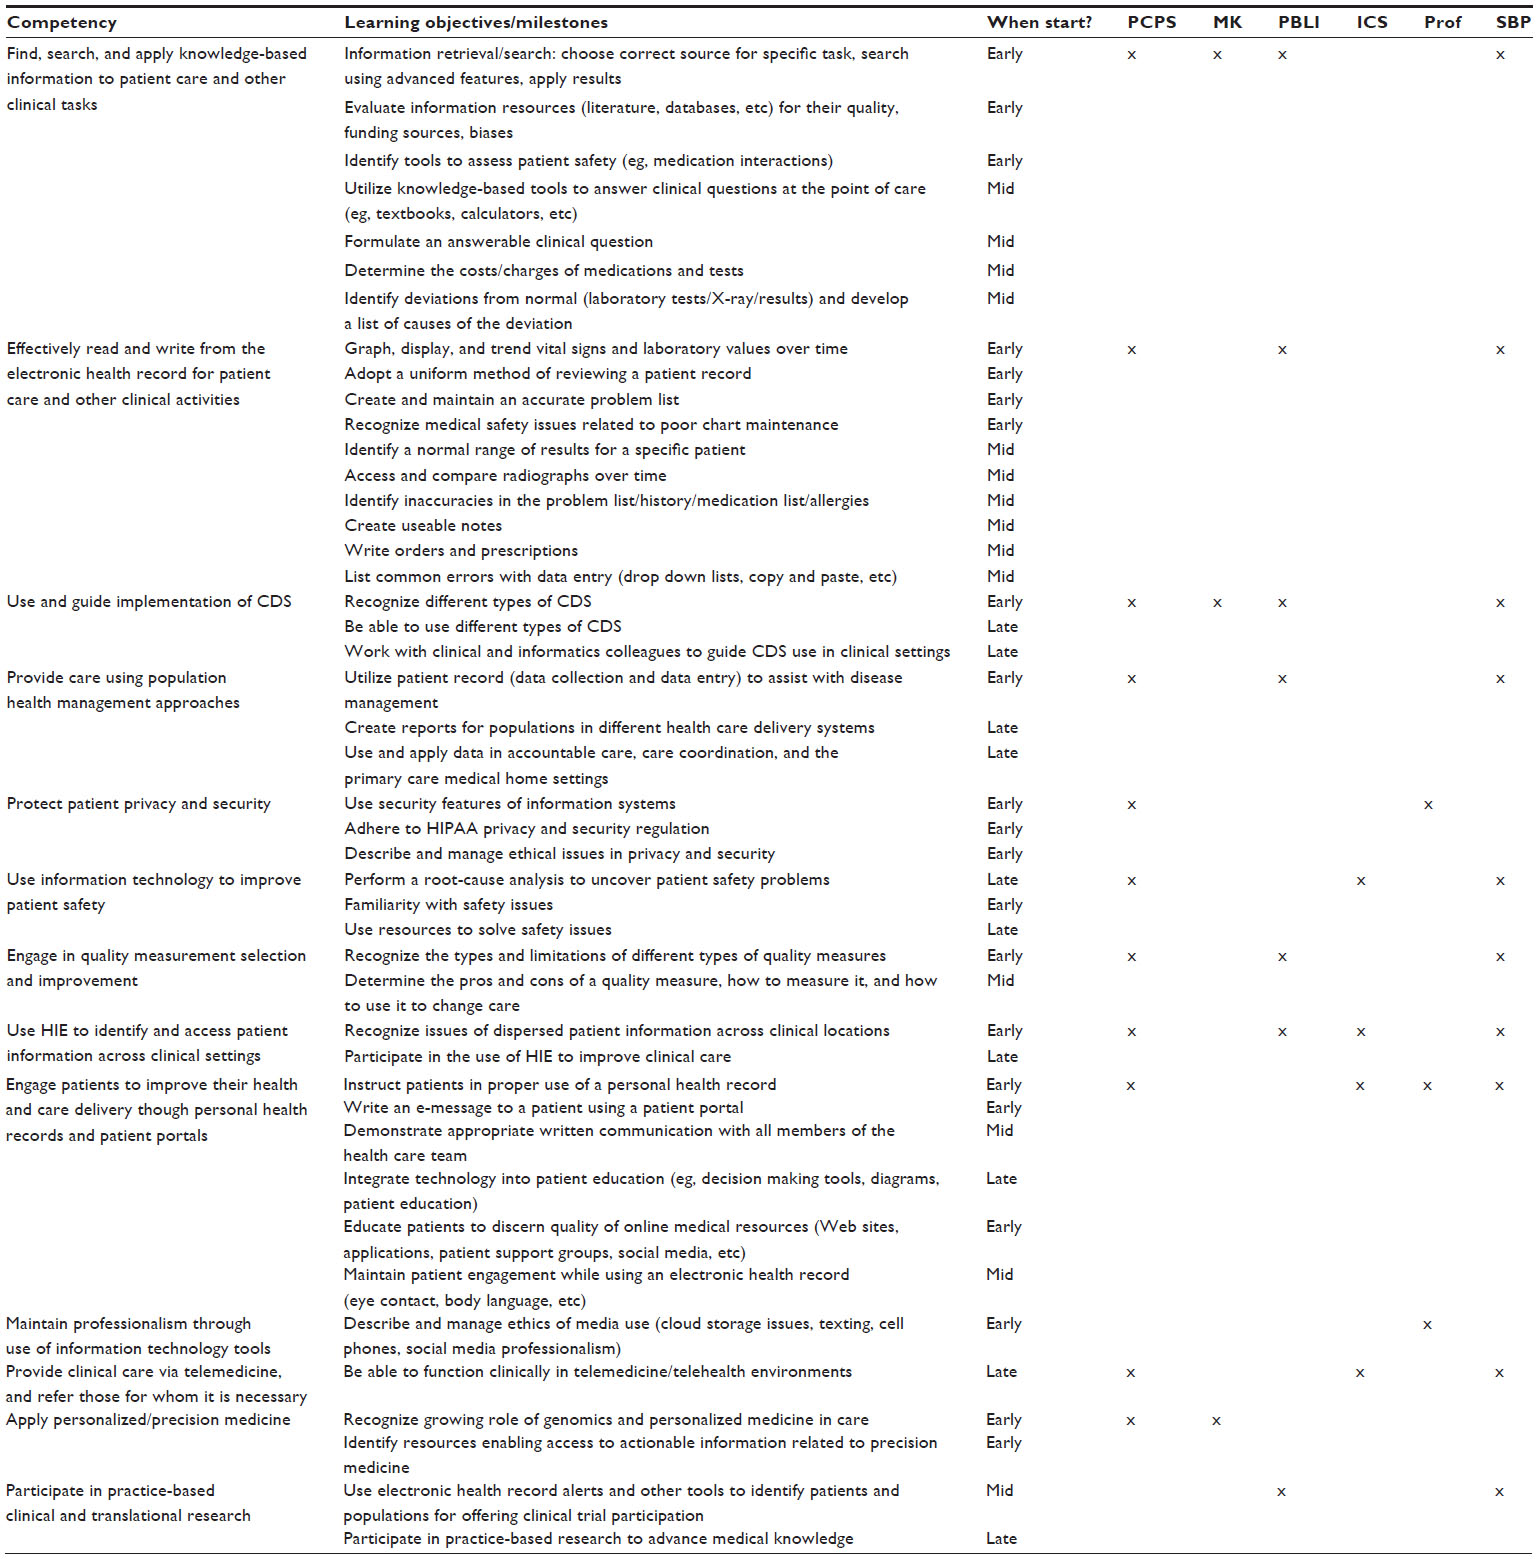
File:Tab1 Hersh AdvancesMedEdPrac2014 2014-5.jpg ...ll learning objectives/milestones are designated for time to start (early: start of medical school; mid: later in preclinical years; and late: during clinic |Date=2014(1,538 × 1,559 (550 KB)) - 16:45, 22 September 2015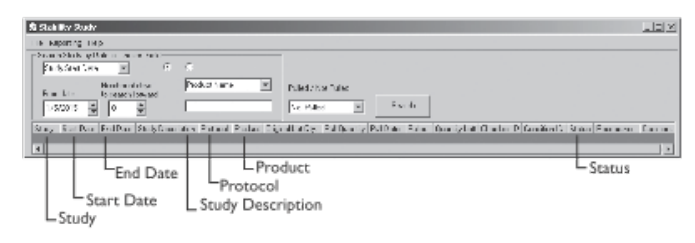
File:Fig3-9b Liscouski LabInfo24.png ...nformation in a variety of ways; including study start, end or pull [test] date; product name or number, study number, lot number, researcher, department, ...formatics: Information and Workflows |author=Liscouski, J. |work=LIMSwiki |date=April 2024}}(695 × 243 (52 KB)) - 18:43, 5 April 2024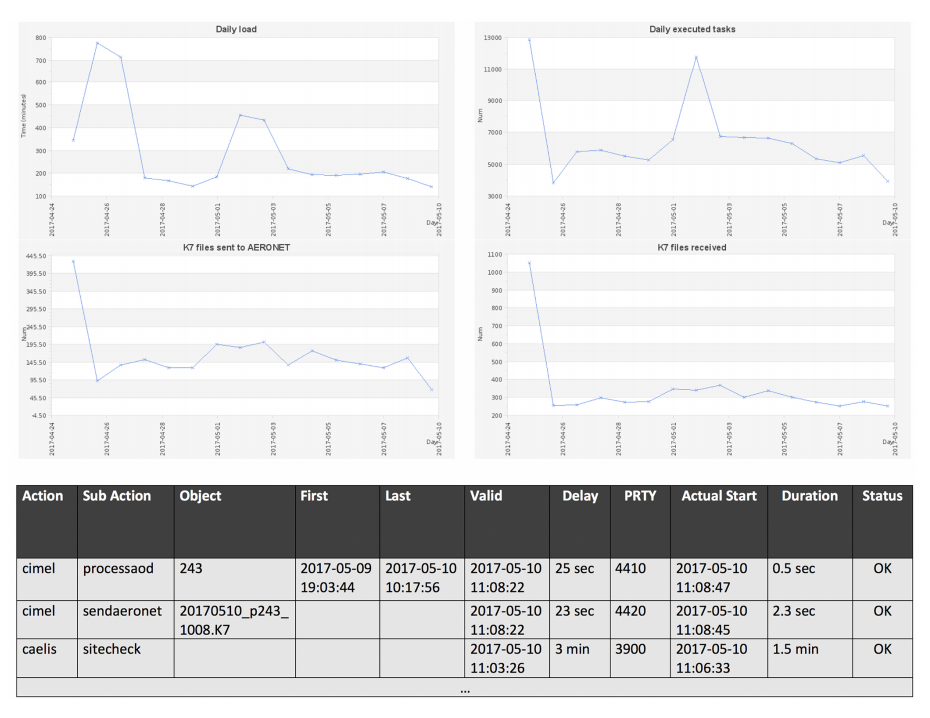
File:Fig6 Fuertes GIMDS2018 7-1.png ...shows an example of the log. Delay indicates the difference between actual start and valid time therefore indicating NRT capabilities. |Date=2018(930 × 718 (227 KB)) - 20:30, 17 August 2018
File:Fig2 Backman BMCBio2016 17.gif ...ber of transcripts with nucleotide resolution upstream/downstream of their start and stop codons, as well as binned coverage for their coding regions; (4) e |Date=2016(567 × 576 (187 KB)) - 22:24, 20 August 2018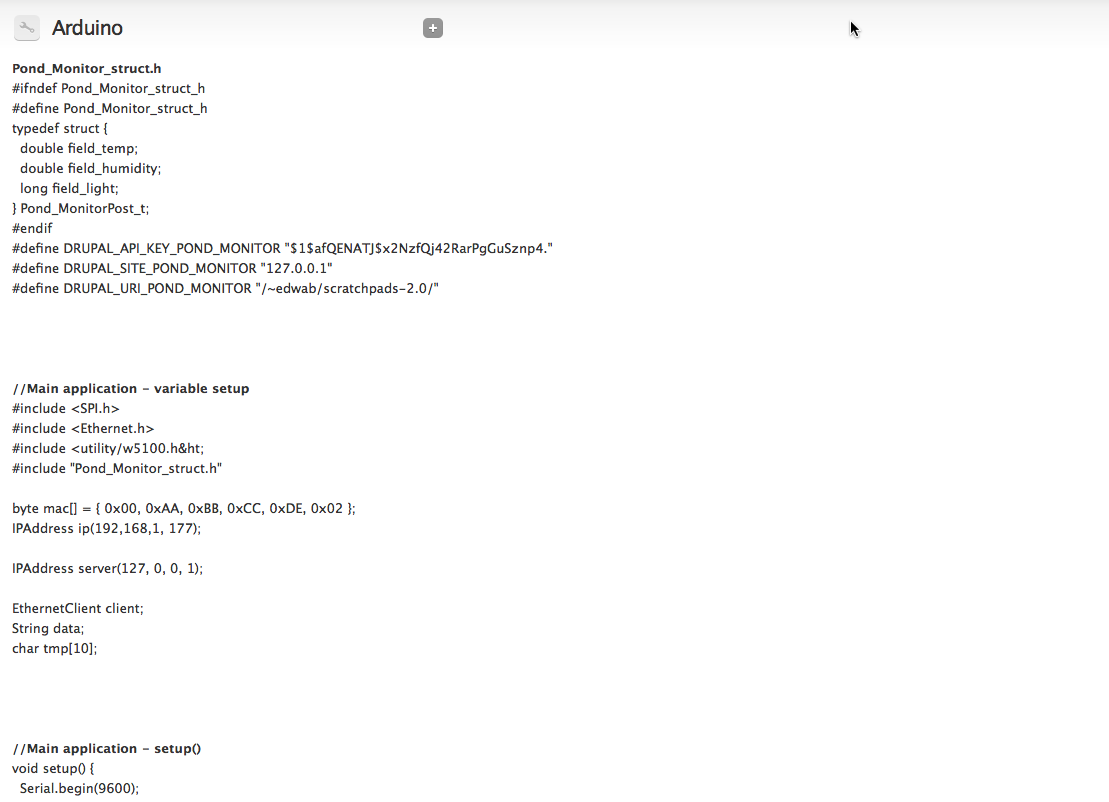
File:Fig19 Baker BiodiversityDataJournal2014 2.png ...e full struct definition file (in this case Pond_Monitor_struct.h) and the start of the example code for the main application. |Date=2014(1,109 × 802 (115 KB)) - 22:14, 30 June 2016
File:Fig1 Maier MammalianGenome2015 26-9.gif ...re a project can be continued later or an independent, derived project can start. Arrow-connected processes may be performed optionally in a mouse clinic or |Date=2015(568 × 808 (73 KB)) - 20:19, 25 July 2016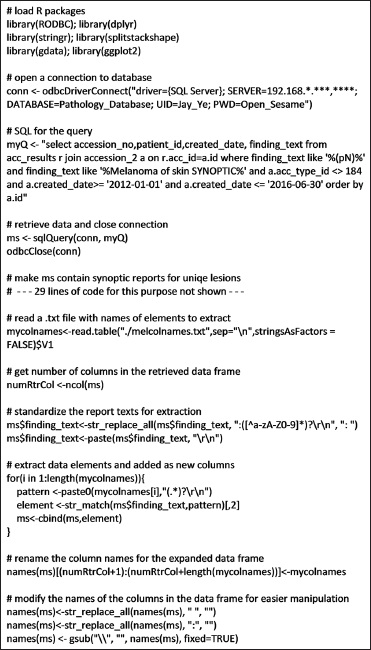
File:Fig1 Ye JofPathInformatics2016 7.jpg ...rom database and for performing preliminary data element extraction. Lines start with hash mark are comment lines, not executed by R interpreter. The conten |Date=2016(371 × 650 (102 KB)) - 22:22, 16 November 2016
File:Fig1 Lukauskas BMCBioinformatics2016 17-Supp16.gif ...ic marks H3K4me3 (left) and H3K9ac (right) accumulate around transcription start sites often showing a bimodal peak with a valley over the TSS. Shown are tw |Date=2016(779 × 770 (76 KB)) - 19:14, 30 January 2017
File:Fig3 Lukauskas BMCBioinformatics2016 17-Supp16.gif ...ue are five seed regions, i.e., original ENCODE H3K4me3 read counts at the start of five known genes. For each of the seed regions we show 10 simulated modi |Date=2016(779 × 441 (61 KB)) - 18:32, 31 January 2017
File:Fig4 Lukauskas BMCBioinformatics2016 17-Supp16.gif ...to normalized read counts. X axis represents original (unwarped) bins from start of the peaks. '''c''' Matthews Correlation Coefficient for hierarchical clu |Date=2016(567 × 528 (90 KB)) - 18:53, 31 January 2017
File:Fig6 Lukauskas BMCBioinformatics2016 17-Supp16.gif ...-maps of the raw and '''b''' aligned data. Red dots indicate transcription start sites, orange dots first splice sites. '''c''' Histograms of the positions |Date=2016(779 × 721 (143 KB)) - 20:30, 31 January 2017


