File:Fig10 BaldominosIntJOfIMAI2018 4-7.png
Original file (1,056 × 354 pixels, file size: 104 KB, MIME type: image/png)
Summary
| Description |
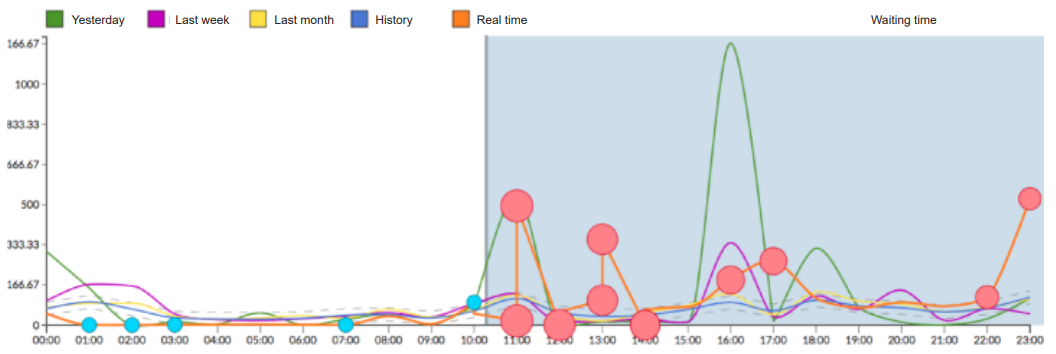
Figure 10. Real-time dashboard displaying the average waiting times. The orange time series over the light blue background shows the predicted value for the rest of the day. Blue dots show real-time alerts, while red dots show early alerts. Different time series are shown so that current and historic values can be compared. |
|---|---|
| Source |
Baldominos, A.; de Rada, F.; Saez, Y. (2018). "DataCare: Big data analytics solution for intelligent healthcare management". International Journal of Interactive Multimedia and Artificial Intelligence 4 (7): 13–20. doi:10.9781/ijimai.2017.03.002. |
| Date |
2018 |
| Author |
Baldominos, A.; de Rada, F.; Saez, Y. |
| Permission (Reusing this file) |
|
| Other versions |
Licensing
|
|
This work is licensed under the Creative Commons Attribution 3.0 Unported License. |
File history
Click on a date/time to view the file as it appeared at that time.
| Date/Time | Thumbnail | Dimensions | User | Comment | |
|---|---|---|---|---|---|
| current | 16:12, 24 May 2018 | 1,056 × 354 (104 KB) | Shawndouglas (talk | contribs) |
You cannot overwrite this file.
File usage
The following page uses this file:


