File:Fig11 Fuertes GIMDS2018 7-1.png
Original file (698 × 642 pixels, file size: 198 KB, MIME type: image/png)
Summary
| Description |
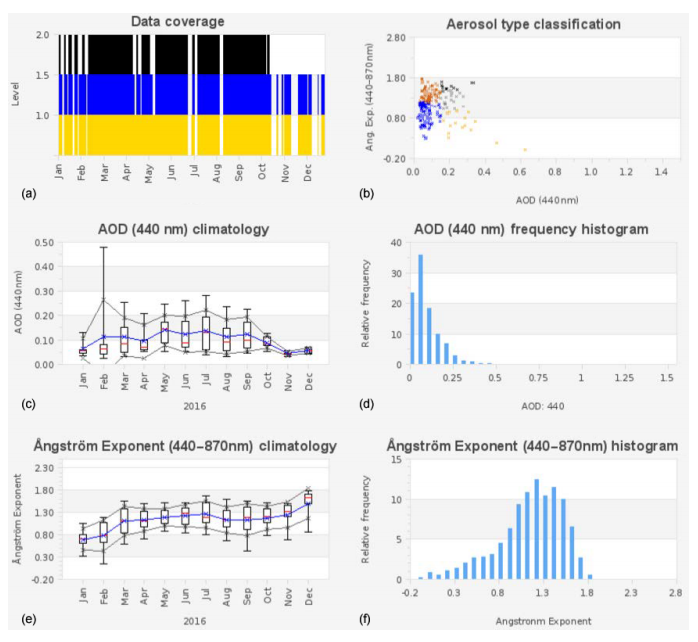
Figure 11. Statistical analysis of aerosol optical depth (AOD) and Ångström exponent (AE) derived from AERONET for Palencia site in 2016: (a) data coverage for level 1.0, 1.5 and 2.0 of the AERONET database; (b) aerosol type classification based on the AOD vs. AE scatter plot. (c) AOD (440 nm) monthly statistics using box plot; (d) frequency histogram for AOD (440 nm); (e) AE monthly statistics using box plot; (f) frequency histogram for AE. |
|---|---|
| Source |
Fuertes, D.; Toledano, C.; González, R.; Berjón, A.; Torres, B.; Cachorro, V.E.; de Frutos, Á.M. (2018). "CÆLIS: Software for assimilation, management, and processing data of an atmospheric measurement network". Geoscientific Instrumentation, Methods and Data Systems 7 (1): 67–81. doi:10.5194/gi-7-67-2018. |
| Date |
2018 |
| Author |
Fuertes, D.; Toledano, C.; González, R.; Berjón, A.; Torres, B.; Cachorro, V.E.; de Frutos, Á.M. |
| Permission (Reusing this file) |
|
| Other versions |
Licensing
|
|
This work is licensed under the Creative Commons Attribution 4.0 License. |
File history
Click on a date/time to view the file as it appeared at that time.
| Date/Time | Thumbnail | Dimensions | User | Comment | |
|---|---|---|---|---|---|
| current | 22:37, 17 August 2018 | | 698 × 642 (198 KB) | Shawndouglas (talk | contribs) |
You cannot overwrite this file.
File usage
The following page uses this file:


