File:Fig1 Lam BMCBioinformatics2016 17.gif
Fig1_Lam_BMCBioinformatics2016_17.gif (567 × 263 pixels, file size: 39 KB, MIME type: image/gif)
Summary
| Description |
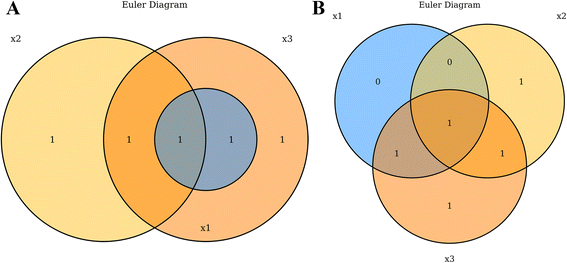
Figure 1. Euler and Venn diagrams produced by VennDiagramWeb each depicting three sets: x1 = {7,8}, x2 = {4,6,7}, x3 = {4,7,8,10}. a. An Euler diagram, produced with euler.d = TRUE and scaled = TRUE. b. A Venn diagram, produced with euler.d = FALSE and scaled = FALSE |
|---|---|
| Source |
Lam, Felix.; Lalansingh, Christopher, M.; Babaran, Holly E.; Wang, Zhiyuan; Prokepec, Stephenie D.; Fox, Natalie S.; Boutros, Paul C. (2016). "VennDiagramWeb: A web application for the generation of highly customizable Venn and Euler diagrams". BMC Bioinformatics 17: 401. doi:10.1186/s12859-016-1281-5. PMID 27716034. |
| Date |
2016 |
| Author |
Lam, Felix.; Lalansingh, Christopher, M.; Babaran, Holly E.; Wang, Zhiyuan; Prokepec, Stephenie D.; Fox, Natalie S.; Boutros, Paul C. |
| Permission (Reusing this file) |
|
| Other versions |
Licensing
|
|
This work is licensed under the Creative Commons Attribution 4.0 License. |
File history
Click on a date/time to view the file as it appeared at that time.
| Date/Time | Thumbnail | Dimensions | User | Comment | |
|---|---|---|---|---|---|
| current | 22:16, 11 October 2016 |  | 567 × 263 (39 KB) | Shawndouglas (talk | contribs) |
You cannot overwrite this file.
File usage
The following page uses this file:


