File:Fig1 Lukauskas BMCBioinformatics2016 17-Supp16.gif
Original file (779 × 770 pixels, file size: 76 KB, MIME type: image/gif)
Summary
| Description |
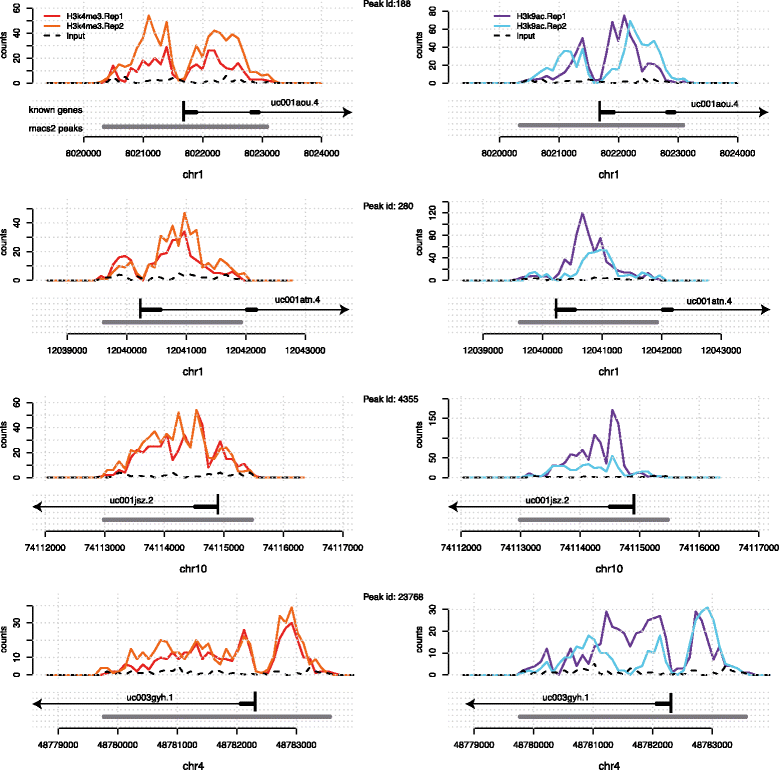
Figure 1. The epigenomic marks H3K4me3 (left) and H3K9ac (right) accumulate around transcription start sites often showing a bimodal peak with a valley over the TSS. Shown are two biological replicates for each mark and the input signal. Y axis corresponds to read counts. Annotated genes and the enriched regions called by MACS2 are shown in grey below each profile. |
|---|---|
| Source |
Lukauskas, S.; Visintainer, R.; Sanguinetti, G.; Schweikert, G.B. (2016). "DGW: An exploratory data analysis tool for clustering and visualisation of epigenomic marks". BMC Bioinformatics 17 (Suppl 16): 447. doi:10.1186/s12859-016-1306-0. PMC PMC5249015. PMID 28105912. https://www.ncbi.nlm.nih.gov/pmc/articles/PMC5249015. |
| Date |
2016 |
| Author |
Lukauskas, S.; Visintainer, R.; Sanguinetti, G.; Schweikert, G.B. |
| Permission (Reusing this file) |
|
| Other versions |
Licensing
|
|
This work is licensed under the Creative Commons Attribution 4.0 License. |
File history
Click on a date/time to view the file as it appeared at that time.
| Date/Time | Thumbnail | Dimensions | User | Comment | |
|---|---|---|---|---|---|
| current | 19:11, 30 January 2017 | | 779 × 770 (76 KB) | Shawndouglas (talk | contribs) |
You cannot overwrite this file.
File usage
The following page uses this file:


