File:Fig1 Maier MammalianGenome2015 26-9.gif
Original file (568 × 808 pixels, file size: 73 KB, MIME type: image/gif)
Summary
| Description |
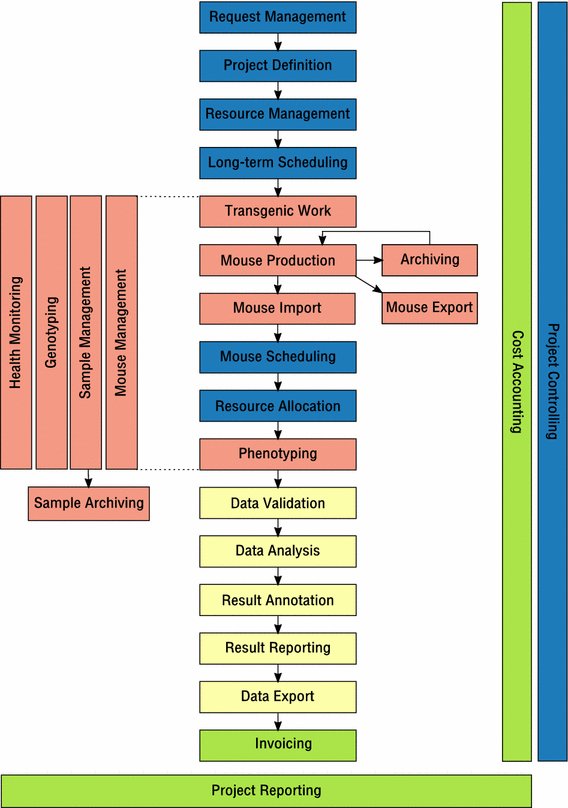
Figure 1. A business process model for mouse clinics. Shown as coloured boxes are operational processes that are performed in mouse clinics (described in text). A particular project is run through the processes from top to bottom, as indicated by arrows. Archiving may provide a loop, where a project can be continued later or an independent, derived project can start. Arrow-connected processes may be performed optionally in a mouse clinic or a mouse facility, allowing the application of the model to virtually any facility. Lateral processes accompany a particular project throughout sequential, arrow-connected processes, as indicated by the larger horizontal and vertical boxes. Different colours represent different process families (blue process management, red working with mice & samples, yellow data analysis, green finance & reporting) |
|---|---|
| Source |
Maier, H.; Schütt, C.; Steinkamp, R. et al. (2015). "Principles and application of LIMS in mouse clinics". Mammalian Genome 26 (9): 467–481. doi:10.1007/s00335-015-9586-7. PMC PMC4602070. PMID 26208973. https://www.ncbi.nlm.nih.gov/pmc/articles/PMC4602070. |
| Date |
2015 |
| Author |
Maier, H.; Schütt, C.; Steinkamp, R. et al. |
| Permission (Reusing this file) |
|
| Other versions |
Licensing
|
|
This work is licensed under the Creative Commons Attribution 4.0 License. |
File history
Click on a date/time to view the file as it appeared at that time.
| Date/Time | Thumbnail | Dimensions | User | Comment | |
|---|---|---|---|---|---|
| current | 20:14, 25 July 2016 | | 568 × 808 (73 KB) | Shawndouglas (talk | contribs) |
You cannot overwrite this file.
File usage
The following page uses this file:


