File:Fig1 Palmieri Molecules2019 24-19.png
Original file (3,532 × 2,400 pixels, file size: 1.05 MB, MIME type: image/png)
Summary
| Description |
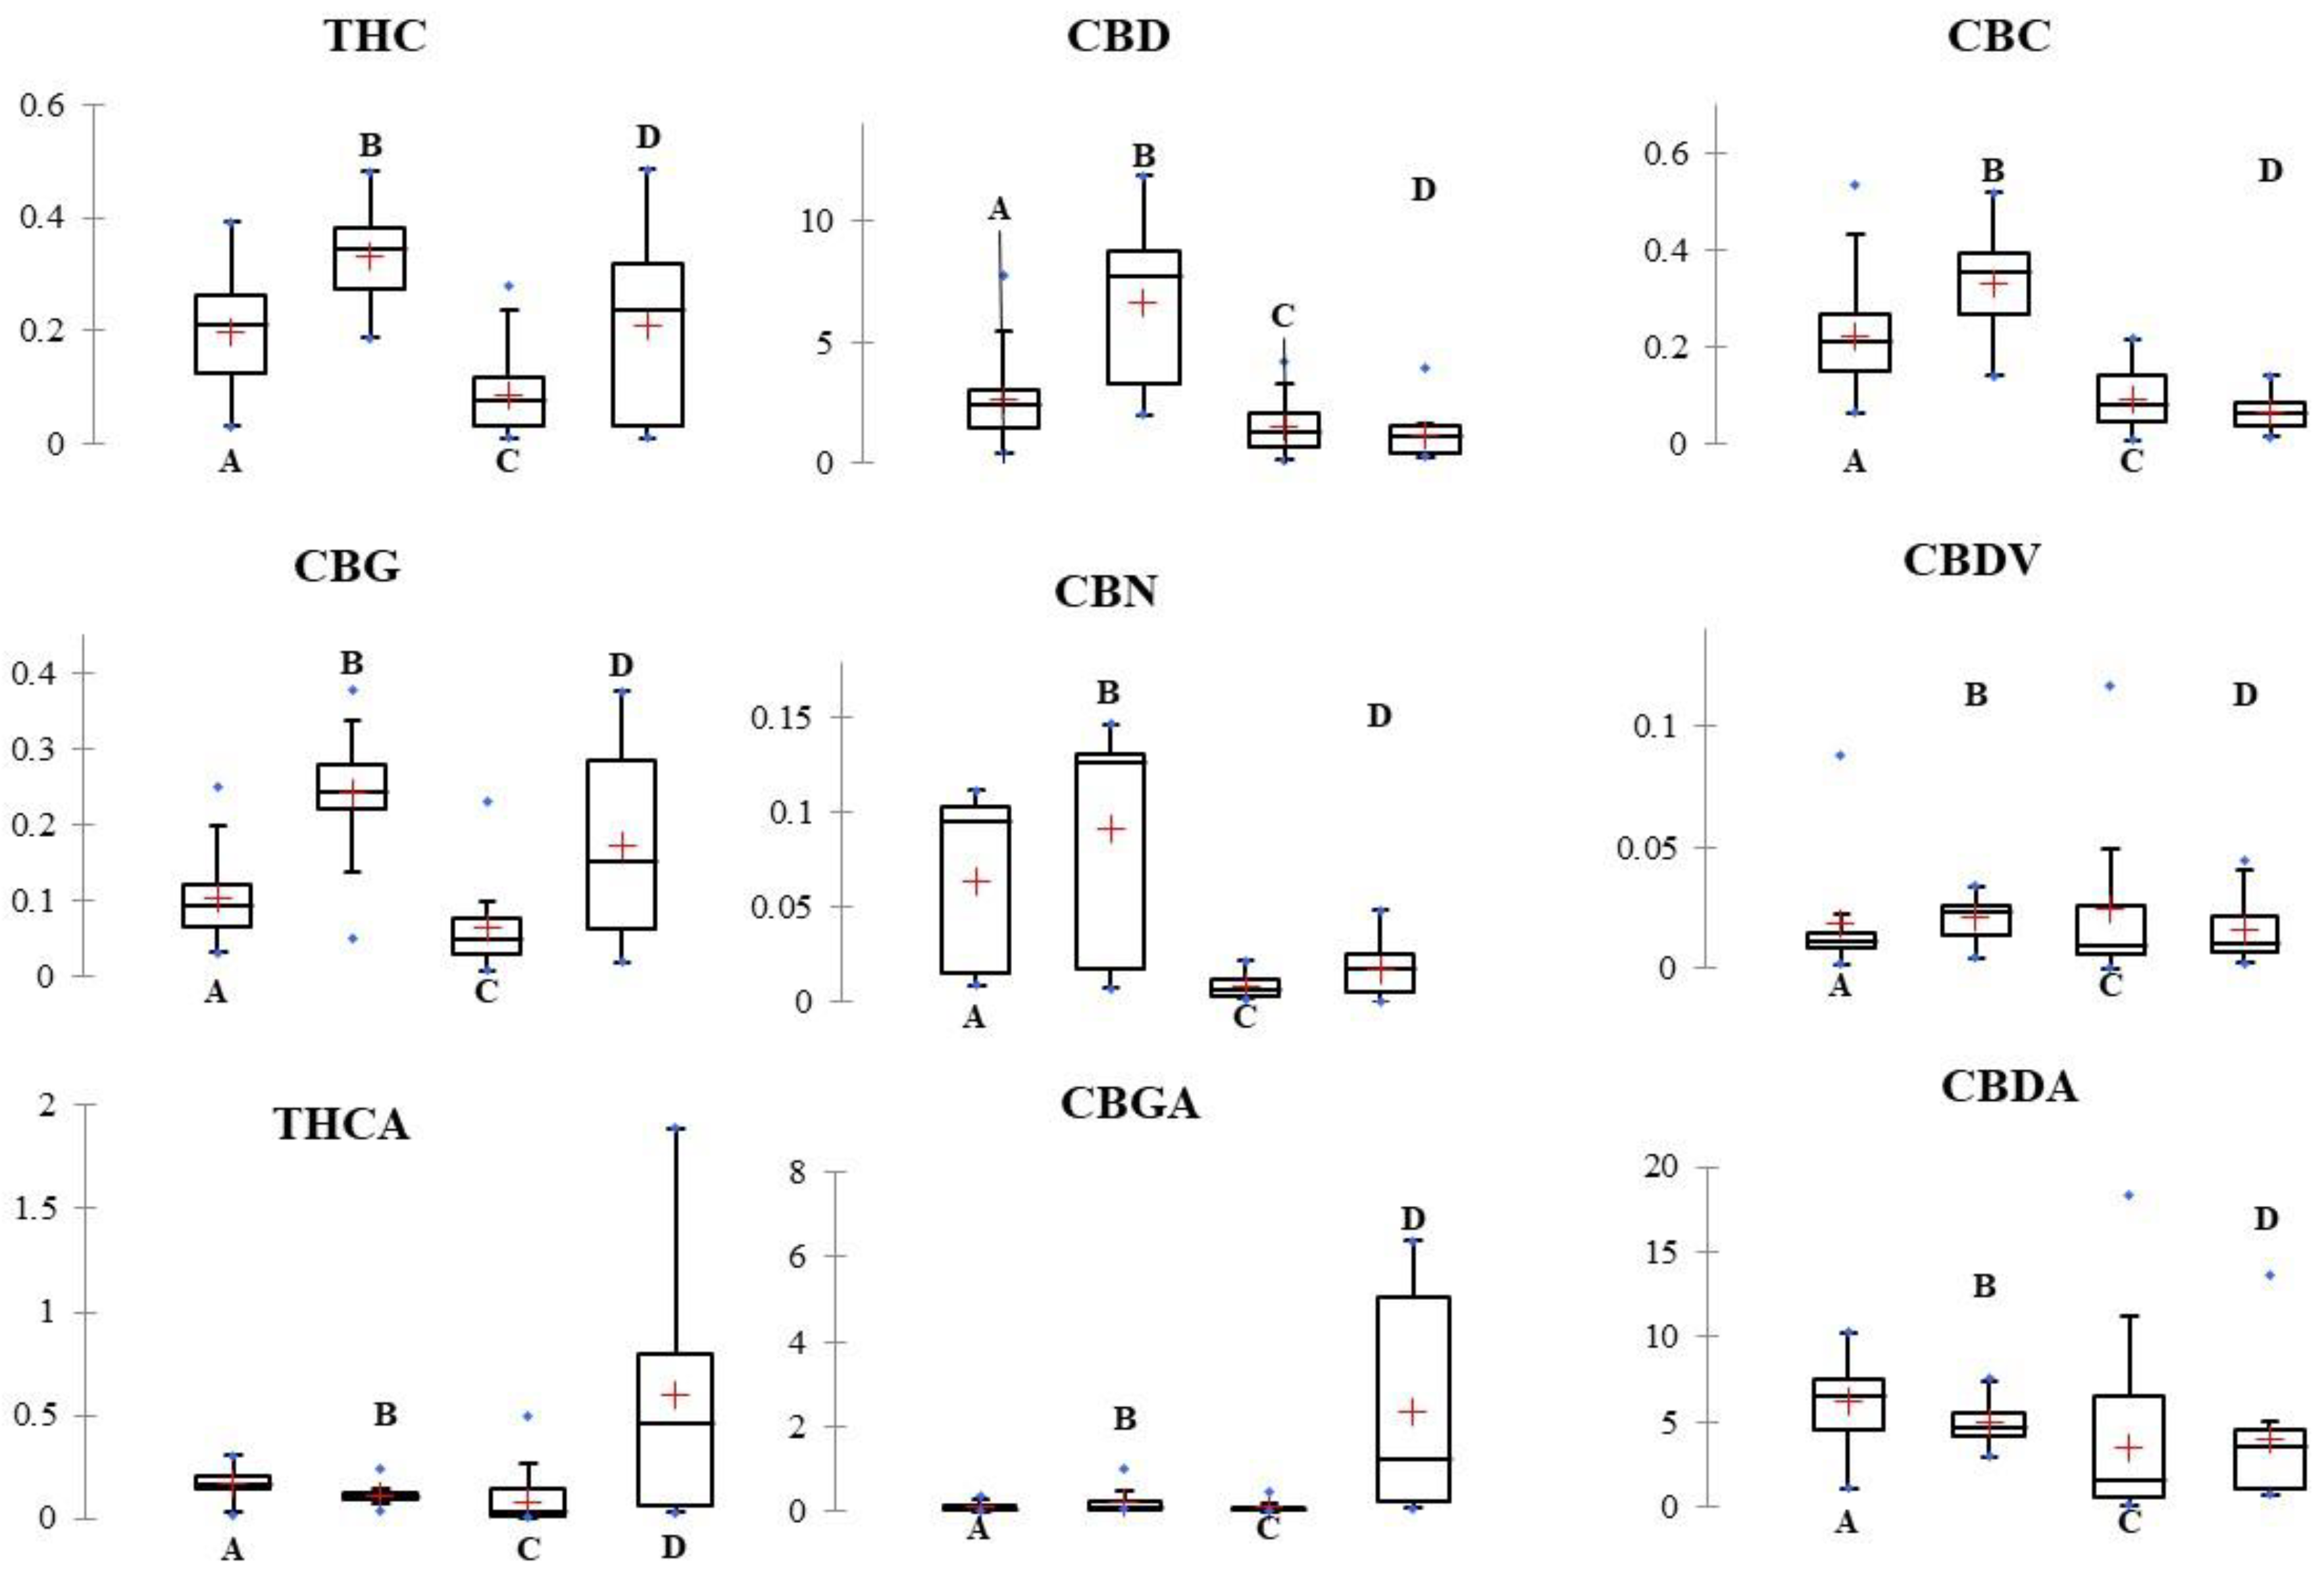
Figure 1. Box and whisker plot of the relative concentrations of the six neutral (THC, CBD, CBC, CBG, CBN and CBDV) and the three acidic cannabinoids (THCA CBGA and CBDA) in the 161 hemp samples. The hemp samples were grouped as sold by the four Italian hemp retailers. Concentration of cannabinoids was reported as % w/w. Y axis title = Concentration (% w/w). X axis Title = Hemp retailers. Median and average were depicted with a flat black line and a red cross, respectively. |
|---|---|
| Source |
Palmieri, S.; Mascini, M.; Ricci, A.; Fanti, F.; Ottaviani, C.; Sterzo, C.L.; Sergi, M. (2019). "Identification of Cannabis sativa L. (hemp) retailers by means of multivariate analysis of cannabinoids". Molecules 24 (19): 3602. doi:10.3390/molecules24193602. |
| Date |
2019 |
| Author |
Palmieri, S.; Mascini, M.; Ricci, A.; Fanti, F.; Ottaviani, C.; Sterzo, C.L.; Sergi, M. |
| Permission (Reusing this file) |
|
| Other versions |
Licensing
|
|
This work is licensed under the Creative Commons Attribution 4.0 License. |
File history
Click on a date/time to view the file as it appeared at that time.
| Date/Time | Thumbnail | Dimensions | User | Comment | |
|---|---|---|---|---|---|
| current | 22:30, 14 October 2019 | | 3,532 × 2,400 (1.05 MB) | Shawndouglas (talk | contribs) |
You cannot overwrite this file.
File usage
The following page uses this file:


