File:Fig1 Trellet JOfIntegBioinfo2018 15-2.jpg
Original file (1,419 × 1,666 pixels, file size: 273 KB, MIME type: image/jpeg)
Summary
| Description |
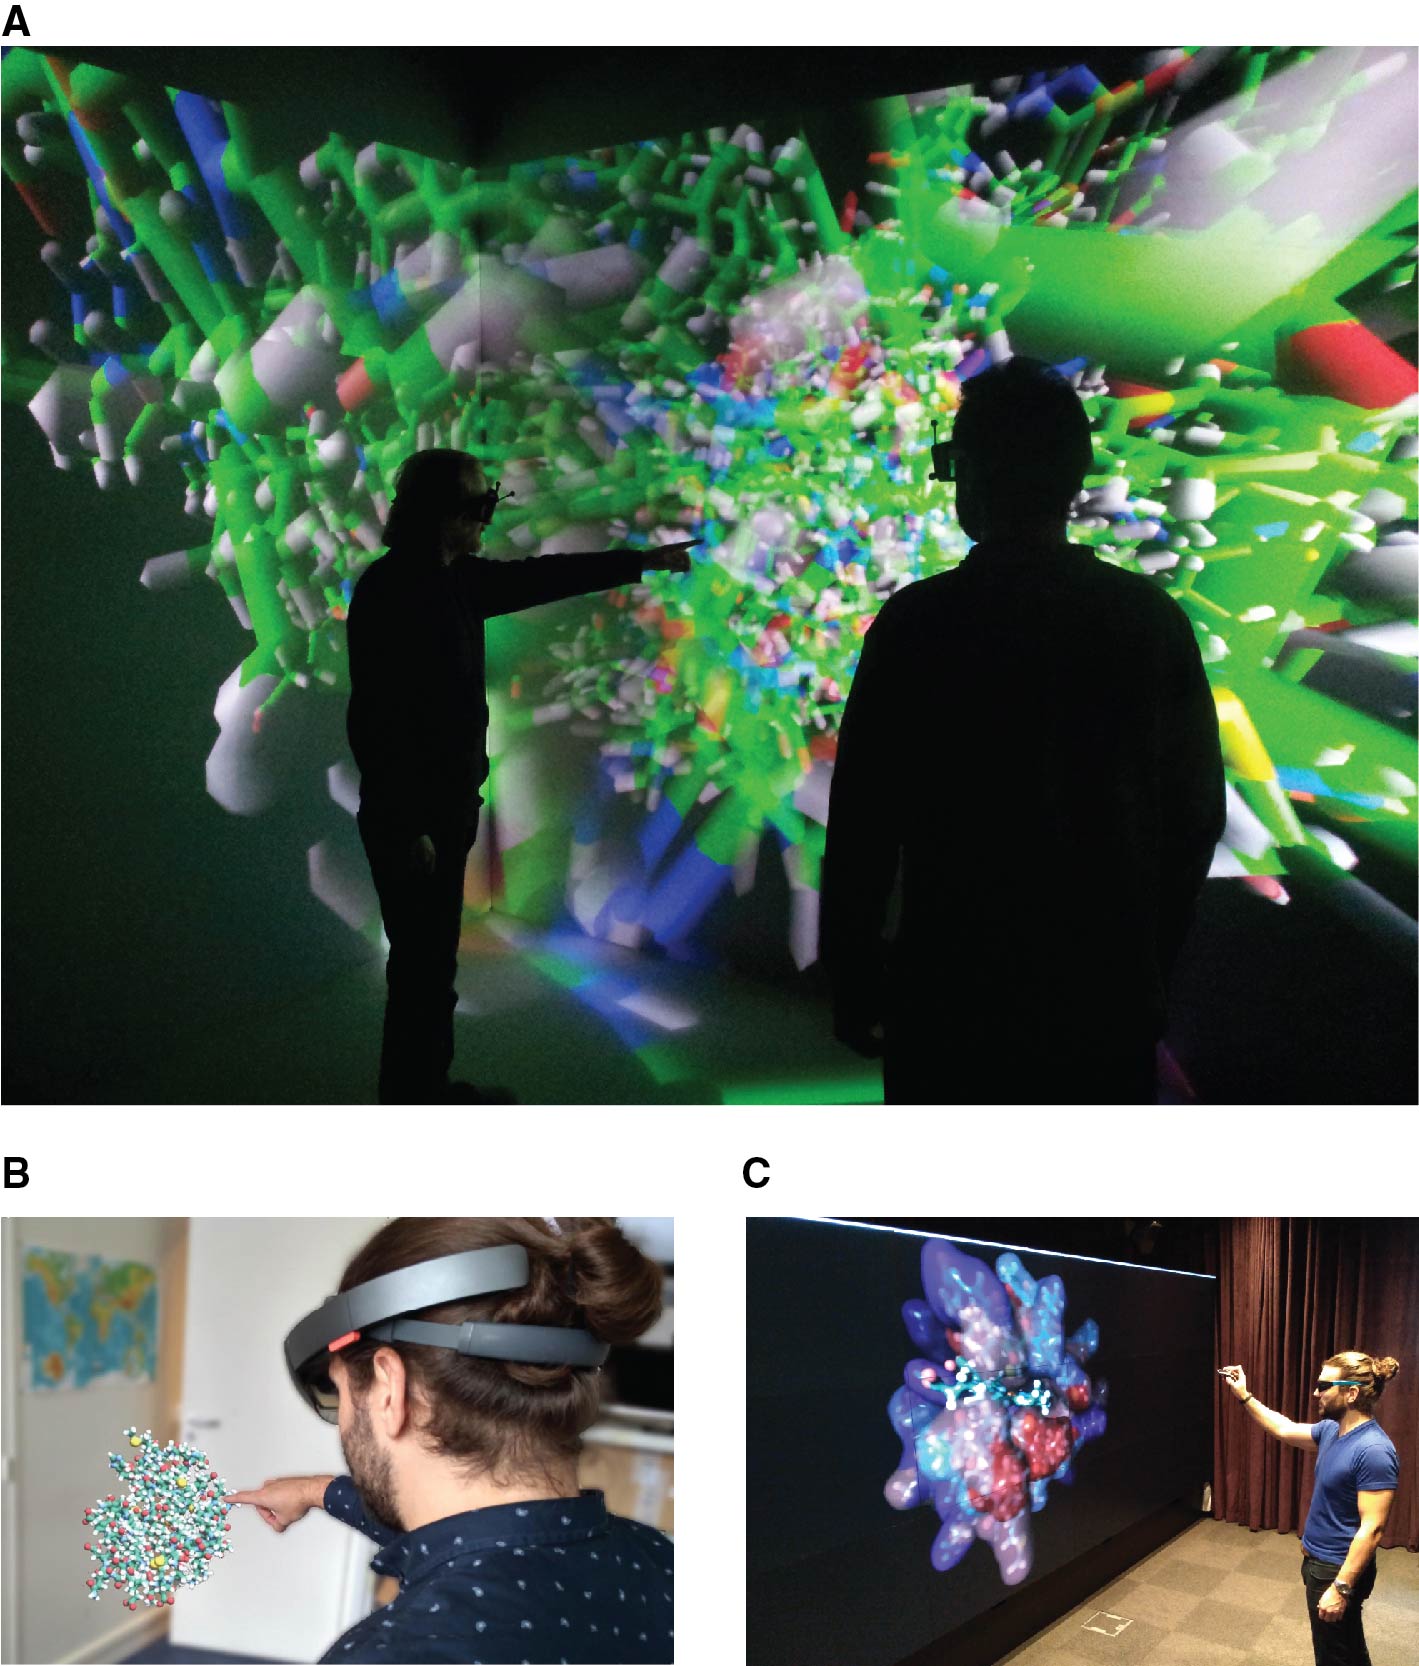
Figure 1. Immersive, augmented reality, and screen wall environments used for molecular visualization: (A) EVE platform, a multi-user CAVE-system composed of 4 screens (LIMSI-CNRS/VENISE team, Orsay), (B) Microsoft Hololens and (C) screen wall of 8.3 m2 composed of 12 screens at full HD resolution with 120 Hz refresh rate in stereoscopy (IBPC-CNRS/LBT, Paris). |
|---|---|
| Source |
Trellet, M.; Férey, N.; Flotyński, J.; Baaden, M.; Bourdot, P. (2019). "Semantics for an integrative and immersive pipeline combining visualization and analysis of molecular data". Journal of Integrative Bioinformatics 5 (1): 9. doi:10.3390/ijns5010009. |
| Date |
2018 |
| Author |
Trellet, M.; Férey, N.; Flotyński, J.; Baaden, M.; Bourdot, P. |
| Permission (Reusing this file) |
Creative Commons Attribution-NonCommercial-NoDerivatives 4.0 International |
| Other versions |
Licensing
|
|
This work is licensed under the Creative Commons Attribution-NonCommercial-NoDerivatives 4.0 International License. |
File history
Click on a date/time to view the file as it appeared at that time.
| Date/Time | Thumbnail | Dimensions | User | Comment | |
|---|---|---|---|---|---|
| current | 00:08, 5 March 2019 | | 1,419 × 1,666 (273 KB) | Shawndouglas (talk | contribs) |
You cannot overwrite this file.
File usage
The following page uses this file:


