File:Fig1 Zuckerman Viruses2020 12-8.png
Original file (1,690 × 699 pixels, file size: 195 KB, MIME type: image/png)
Summary
| Description |
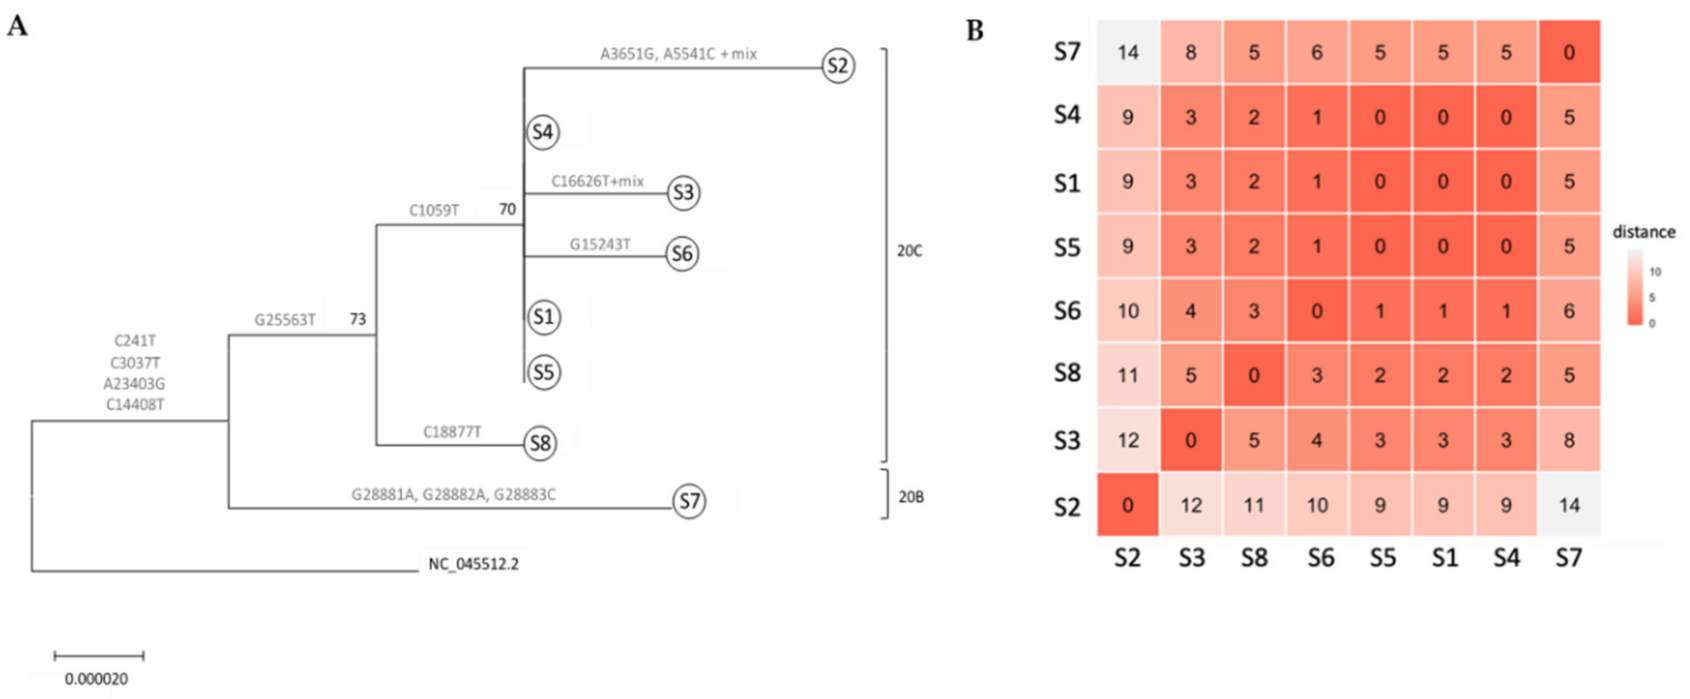
Fig. 1 Whole genome-based phylogenetic tree of ICVL local outbreak. (A) Phylogenetic tree of six ICVL specimens (S1–S6), two family-related specimens (S7–S8) and SARS-CoV-2 reference sequence (NC 045512.2). Tree was inferred by maximum likelihood based on the GTR + I + G evolutionary model. The robustness of branching pattern was tested by 1000 bootstrap replications, and the percentage of successful bootstrap replicates is indicated at the nodes, where only values of >70% are shown. Mutational positions separating the specimens are shown by each branch and corresponding 20B and 20C clades (according to Nextstrain nomenclature) are indicated. (B) Specimen similarity clustering, calculated according to hamming distance (the number of different nucleotides across the whole genome sequences calculated for each pair of specimens). Red represents the least difference and white the most. The number of differences is also noted. |
|---|---|
| Source |
Zuckerman, N.S.; Pando, R.; Bucris, E.; Drori, Y.; Lustig, Y.; Erster, O.; Mor, O.; Mendelson, E.; Mandelboim, M. (2020). "Comprehensive analyses of SARS-CoV-2 transmission in a public health virology laboratory". Viruses 12 (8): 854. doi:10.3390/v12080854. |
| Date |
2020 |
| Author |
Zuckerman, N.S.; Pando, R.; Bucris, E.; Drori, Y.; Lustig, Y.; Erster, O.; Mor, O.; Mendelson, E.; Mandelboim, M. |
| Permission (Reusing this file) |
|
| Other versions |
Licensing
|
|
This work is licensed under the Creative Commons Attribution 4.0 License. |
File history
Click on a date/time to view the file as it appeared at that time.
| Date/Time | Thumbnail | Dimensions | User | Comment | |
|---|---|---|---|---|---|
| current | 22:15, 17 August 2020 | | 1,690 × 699 (195 KB) | Shawndouglas (talk | contribs) |
You cannot overwrite this file.
File usage
The following page uses this file:


