File:Fig2 Closha BMCBioinfo2018 19-Sup1.gif
Fig2_Closha_BMCBioinfo2018_19-Sup1.gif (778 × 479 pixels, file size: 148 KB, MIME type: image/gif)
Summary
| Description |
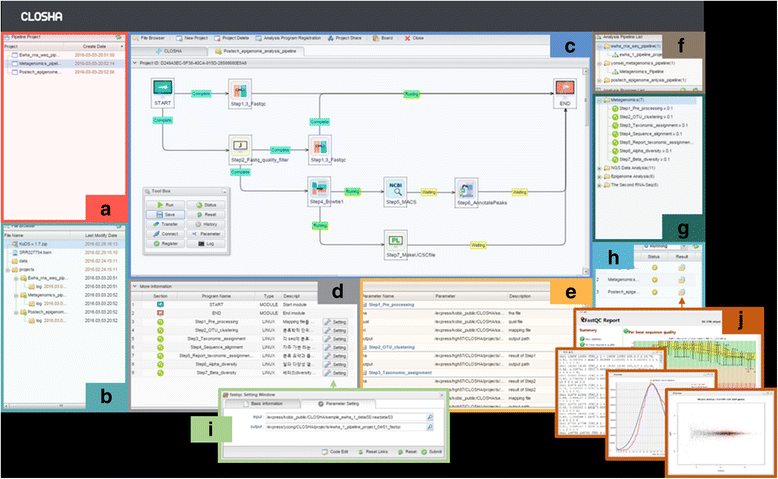
Figure 2. The interface of the Closha workspace. The web-based Closha workflow editor has several panels: (a) the pipeline project list, (b) the file explorer, (c) the canvas: pipeline modeling screen, (d) a table detailing the analysis program, (e) a table detailing the analysis program parameters, (f) the analysis pipeline list, (g) the list of analysis programs available for use, and (h) the pipeline project job execution history and current progress. |
|---|---|
| Source |
Ko, G.; Kim, P.-G.; Yoon, J.; Han, G.; Park, S.-J.; Song, W.; Lee, B. (2018). "Closha: Bioinformatics workflow system for the analysis of massive sequencing data". BMC Bioinformatics 19 (Suppl 1): 43. doi:10.1186/s12859-018-2019-3. |
| Date |
2018 |
| Author |
Ko, G.; Kim, P.-G.; Yoon, J.; Han, G.; Park, S.-J.; Song, W.; Lee, B. |
| Permission (Reusing this file) |
|
| Other versions |
Licensing
|
|
This work is licensed under the Creative Commons Attribution 4.0 License. |
File history
Click on a date/time to view the file as it appeared at that time.
| Date/Time | Thumbnail | Dimensions | User | Comment | |
|---|---|---|---|---|---|
| current | 19:37, 27 February 2018 |  | 778 × 479 (148 KB) | Shawndouglas (talk | contribs) |
You cannot overwrite this file.
File usage
The following page uses this file:


