File:Fig2 Feder FrontPlantSci2021 12.jpg
Original file (4,083 × 3,934 pixels, file size: 674 KB, MIME type: image/jpeg)
Summary
| Description |
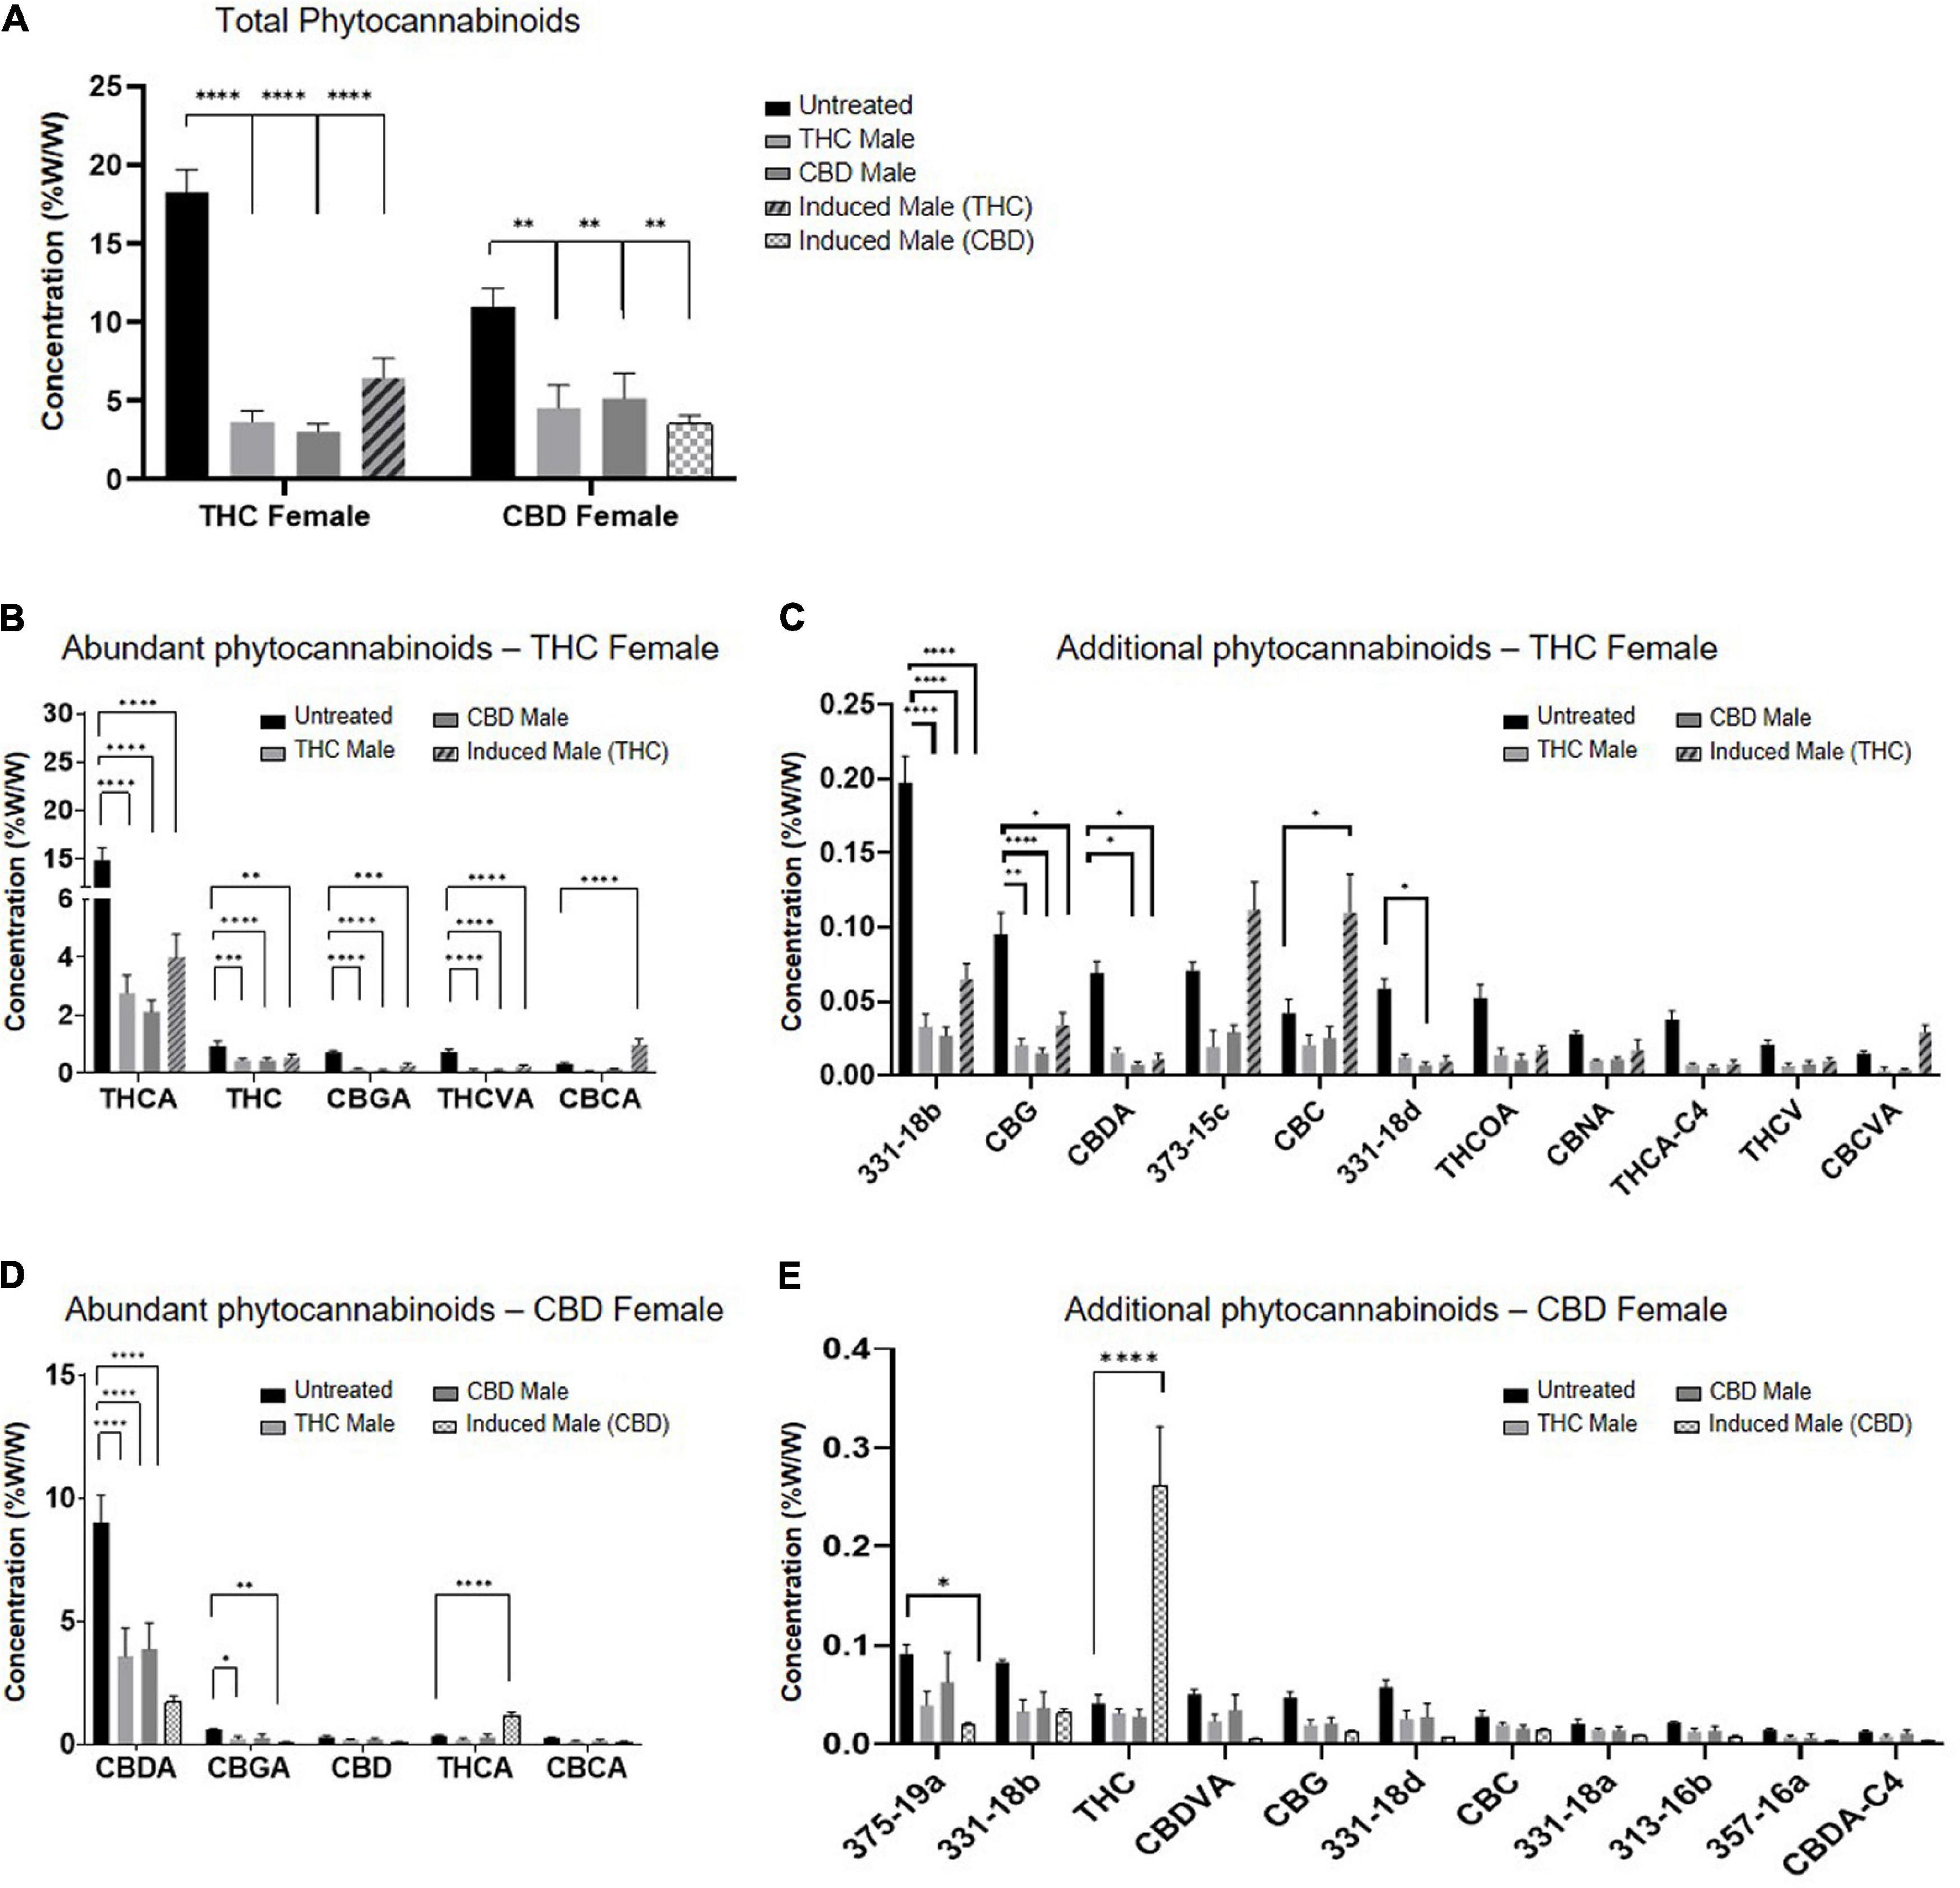
Fig. 2 Phytocannabinoids quantity predominantly decreases after fertilization with all types of males. (A) Total phytocannabinoid concentrations and (B–E) Individual phytocannabinoid concentrations after fertilization relative to unfertilized control. Abundant phytocannabinoid concentrations were considered > 0.2% (B, D) and additional phytocannabinoid concentrations were 0.001–0.2% (C, E) in the unfertilized plants. Data are presented as mean ± SEM (n = 4–6, %w/w) and statistically analyzed by two-way ANOVA followed by Dunnett’s multiple comparison test (*p ≤ 0.05; **p ≤ 0.01; ***p ≤ 0.001; ****p ≤ 0.0001). Significance in C and E was calculated after excluding THCA and CBDA, respectively, from the data. |
|---|---|
| Source |
Feder, C.L.; Cohen, O.; Shapira, A.; Katzir, I.; Peer, R.; Guberman, O.; Procaccia, S.; Berman, P.; Flaishman, M.; Meiri, D. (2021). "Fertilization following pollination predominantly decreases phytocannabinoids accumulation and alters the accumulation of terpenoids in Cannabis inflorescences". Frontiers in Plant Science 12: 753847. doi:10.3389/fpls.2021.753847. |
| Date |
2021 |
| Author |
Feder, C.L.; Cohen, O.; Shapira, A.; Katzir, I.; Peer, R.; Guberman, O.; Procaccia, S.; Berman, P.; Flaishman, M.; Meiri, D. |
| Permission (Reusing this file) |
|
| Other versions |
Licensing
|
|
This work is licensed under the Creative Commons Attribution 4.0 License. |
File history
Click on a date/time to view the file as it appeared at that time.
| Date/Time | Thumbnail | Dimensions | User | Comment | |
|---|---|---|---|---|---|
| current | 21:43, 26 December 2023 | | 4,083 × 3,934 (674 KB) | Shawndouglas (talk | contribs) |
You cannot overwrite this file.


