File:Fig2 Joppich PeerJ2019 7.jpg
Original file (1,200 × 775 pixels, file size: 176 KB, MIME type: image/jpeg)
Summary
| Description |
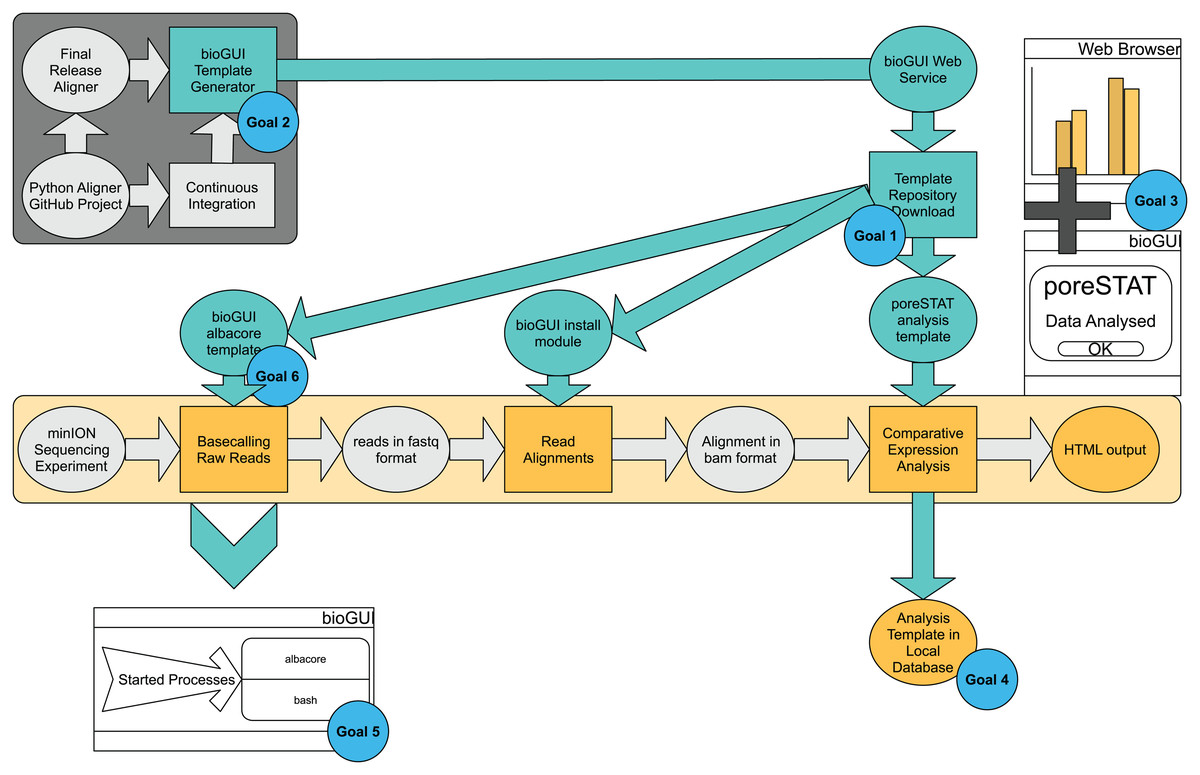
Fig. 2 bioGUI use-case study, from a developer’s and user’s perspective, performed on an exemplary RNAseq analysis workflow. The dark-gray underlayed tasks represent the developer’s tasks, and the bright-yellow part represents the analysis pipeline the user wants to execute. Tasks requiring user-action are shown as rectangles and intermediate results are shown in ellipses. Cyan ellipses denote solutions/results (e.g., template repository) offered by bioGUI. bioGUI starts sub-processes for each task, such that the overhead for any started processes is as small as possible. Upon finishing a task or pipeline, bioGUI can display a notification and open generated output. |
|---|---|
| Source |
Joppich, M.; Zimmer, R. (2019). "From command-line bioinformatics to bioGUI". PeerJ 7: e8111. doi:10.7717/peerj.8111. |
| Date |
2019 |
| Author |
=Joppich, M.; Zimmer, R. |
| Permission (Reusing this file) |
|
| Other versions |
Licensing
|
|
This work is licensed under the Creative Commons Attribution 4.0 License. |
File history
Click on a date/time to view the file as it appeared at that time.
| Date/Time | Thumbnail | Dimensions | User | Comment | |
|---|---|---|---|---|---|
| current | 23:12, 6 January 2020 | | 1,200 × 775 (176 KB) | Shawndouglas (talk | contribs) |
You cannot overwrite this file.
File usage
The following page uses this file:


