File:Fig2 Maury FrontDigHlth2021 3.jpg
Original file (1,084 × 1,029 pixels, file size: 527 KB, MIME type: image/jpeg)
Summary
| Description |
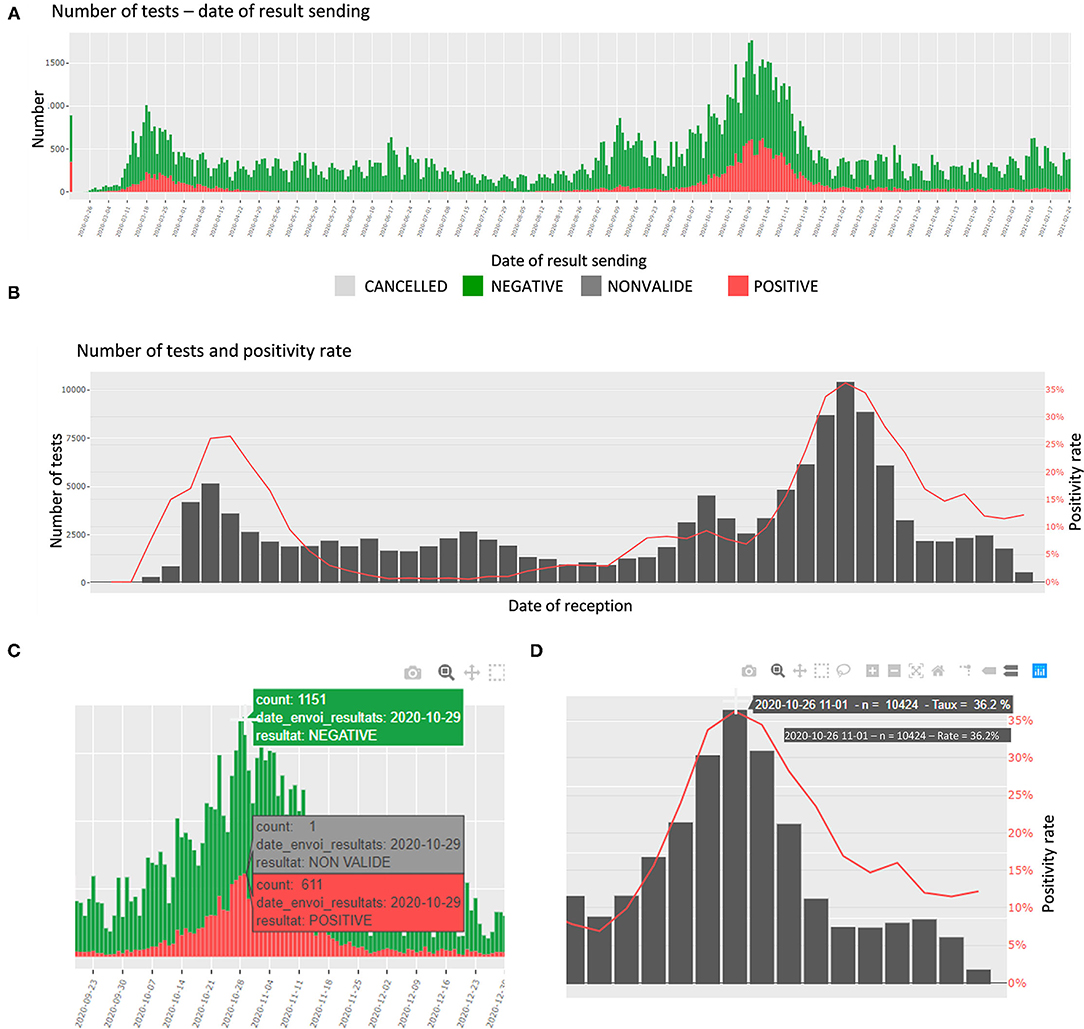
Figure 2. Screen shots of the upper panel of the Filter page. (A) Number of tests and test results per date of results sending. (B) Weekly number of tests and positivity rate. (C) Panel (A) zoomed on the label shown when hovering. (D) Panel (B) zoomed on the label shown when hovering. |
|---|---|
| Source |
Maury, E.; Boldi, M.-O.; Greub, G.; Chavez, V.; Jaton, K.; Opota, O. (2021). "An automated dashboard to improve laboratory COVID-19 diagnostics management". Frontiers in Digital Health 3: 773986. doi:10.3389/fdgth.2021.773986. |
| Date |
2021 |
| Author |
Maury, E.; Boldi, M.-O.; Greub, G.; Chavez, V.; Jaton, K.; Opota, O. |
| Permission (Reusing this file) |
|
| Other versions |
Licensing
|
|
This work is licensed under the Creative Commons Attribution 4.0 License. |
File history
Click on a date/time to view the file as it appeared at that time.
| Date/Time | Thumbnail | Dimensions | User | Comment | |
|---|---|---|---|---|---|
| current | 21:00, 17 February 2022 | | 1,084 × 1,029 (527 KB) | Shawndouglas (talk | contribs) |
You cannot overwrite this file.
File usage
The following page uses this file:


