File:Fig2 Palmieri Molecules2019 24-19.png
Original file (3,343 × 1,090 pixels, file size: 660 KB, MIME type: image/png)
Summary
| Description |
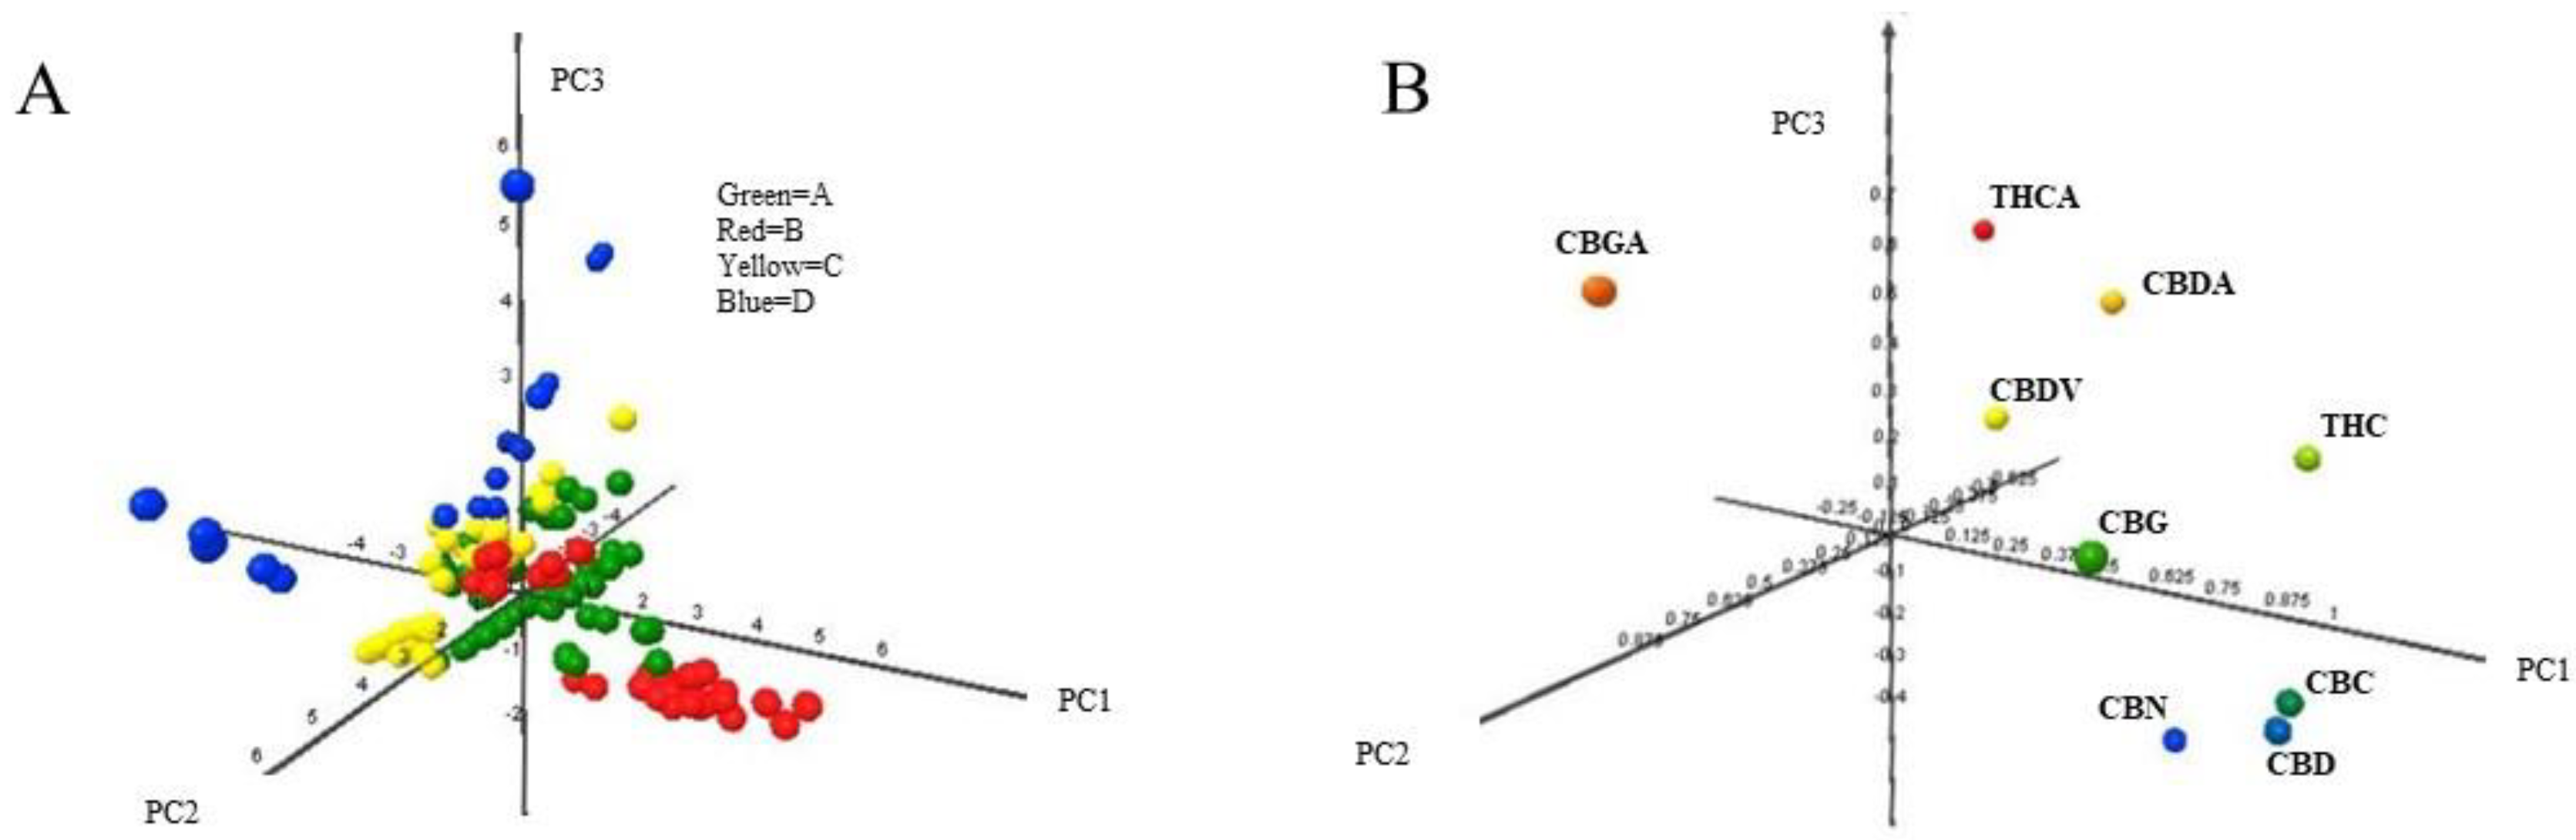
Figure 2. Scores plot (A) and loadings plot (B) obtained from the PCA on the matrix data of the 161 hemp samples (in the matrix rows) and the nine cannabinoids analyzed (the matrix columns). Plots of the first three components (explained variance: PC1 = 42.7%; PC2 = 15.8%; PC3 = 14.9%; total = 73.4%). Data have been auto-scaled (zero mean and unitary variance) before PCA. The four hemp retailers are marked with different colors: Green = A; Red = B; Yellow = C; Blue = D. |
|---|---|
| Source |
Palmieri, S.; Mascini, M.; Ricci, A.; Fanti, F.; Ottaviani, C.; Sterzo, C.L.; Sergi, M. (2019). "Identification of Cannabis sativa L. (hemp) retailers by means of multivariate analysis of cannabinoids". Molecules 24 (19): 3602. doi:10.3390/molecules24193602. |
| Date |
2019 |
| Author |
Palmieri, S.; Mascini, M.; Ricci, A.; Fanti, F.; Ottaviani, C.; Sterzo, C.L.; Sergi, M. |
| Permission (Reusing this file) |
|
| Other versions |
Licensing
|
|
This work is licensed under the Creative Commons Attribution 4.0 License. |
File history
Click on a date/time to view the file as it appeared at that time.
| Date/Time | Thumbnail | Dimensions | User | Comment | |
|---|---|---|---|---|---|
| current | 23:18, 14 October 2019 | 3,343 × 1,090 (660 KB) | Shawndouglas (talk | contribs) |
You cannot overwrite this file.
File usage
The following 2 pages use this file:


