File:Fig2 Sbailò npjCompMat22 8.png
Original file (950 × 1,150 pixels, file size: 767 KB, MIME type: image/png)
Summary
| Description |
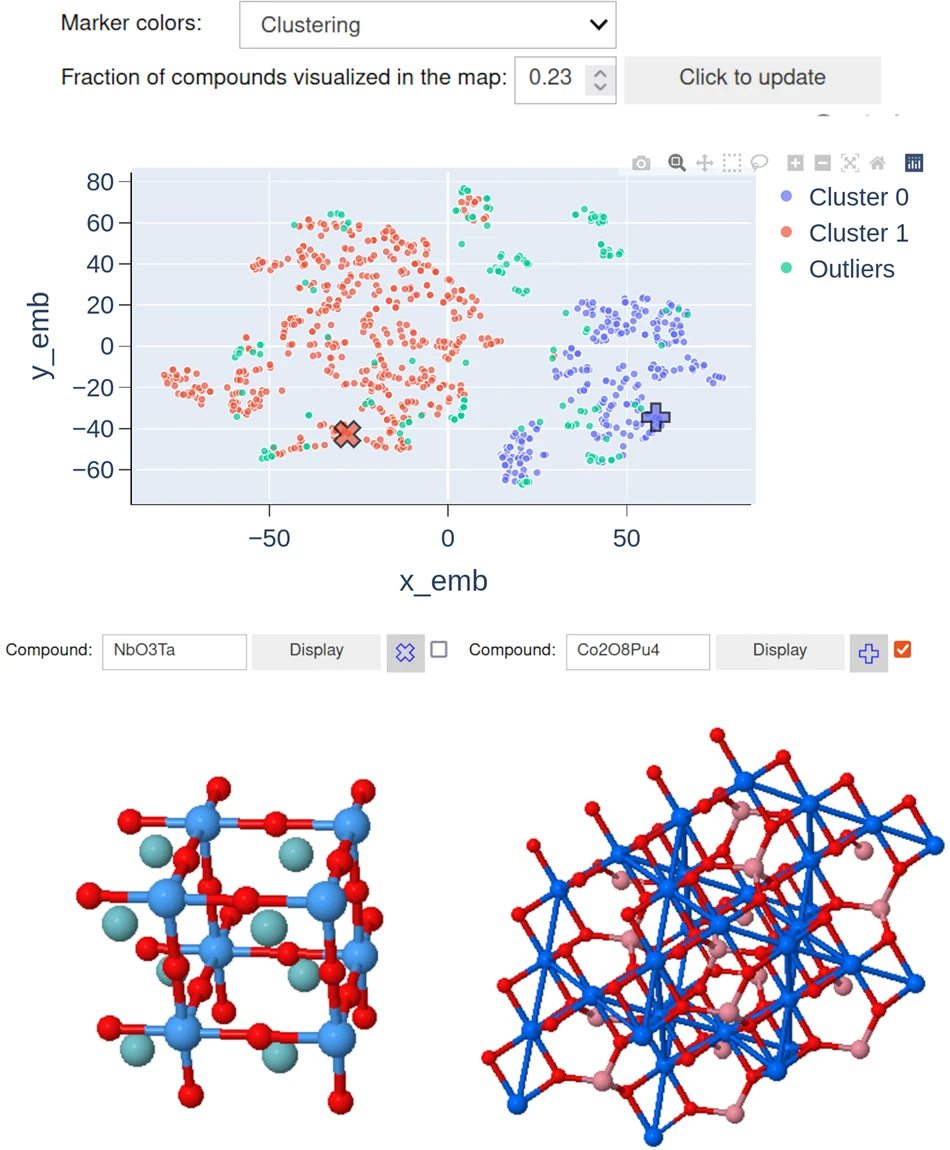
Figure 2. Snapshot of Visualizer in the "Querying the Archive and performing artificial intelligence modeling’ notebook. The visualization of a two-dimensional map allows to identify subsets (in AI nomenclature: clusters) of materials with similar properties. Two windows at the bottom of the map allow viewing the structures of the compounds in the map. Clicking a point shows the structure of the selected material. Ticking the box on top of the windows selects which one of the two windows is used for the next visualization. The two windows have different types of symbols (here, crosses) to mark the position on the map. It is also possible to display a specific material chosen from the "Compound" text box to show its structure and its position on the map, which is then labeled with a cross. In this figure, two compounds are visualized, and it is possible to spot the position of the materials on the map. |
|---|---|
| Source |
Sbailò, Luigi; Fekete, Ádám; Ghiringhelli, Luca M.; Scheffler, Matthias (2023). "The NOMAD Artificial Intelligence Toolkit: Turning materials science data into knowledge and understanding". npj Computational Materials 8: 250. doi:10.1038/s41524-022-00935-z. |
| Date |
2023 |
| Author |
Sbailò, Luigi; Fekete, Ádám; Ghiringhelli, Luca M.; Scheffler, Matthias |
| Permission (Reusing this file) |
|
| Other versions |
Licensing
|
|
This work is licensed under the Creative Commons Attribution 4.0 License. |
File history
Click on a date/time to view the file as it appeared at that time.
| Date/Time | Thumbnail | Dimensions | User | Comment | |
|---|---|---|---|---|---|
| current | 20:45, 20 November 2023 | | 950 × 1,150 (767 KB) | Shawndouglas (talk | contribs) |
You cannot overwrite this file.
File usage
The following page uses this file:


