File:Fig2 Seifert JAMIAOpen20 3.png
Original file (3,931 × 2,151 pixels, file size: 185 KB, MIME type: image/png)
Summary
| Description |
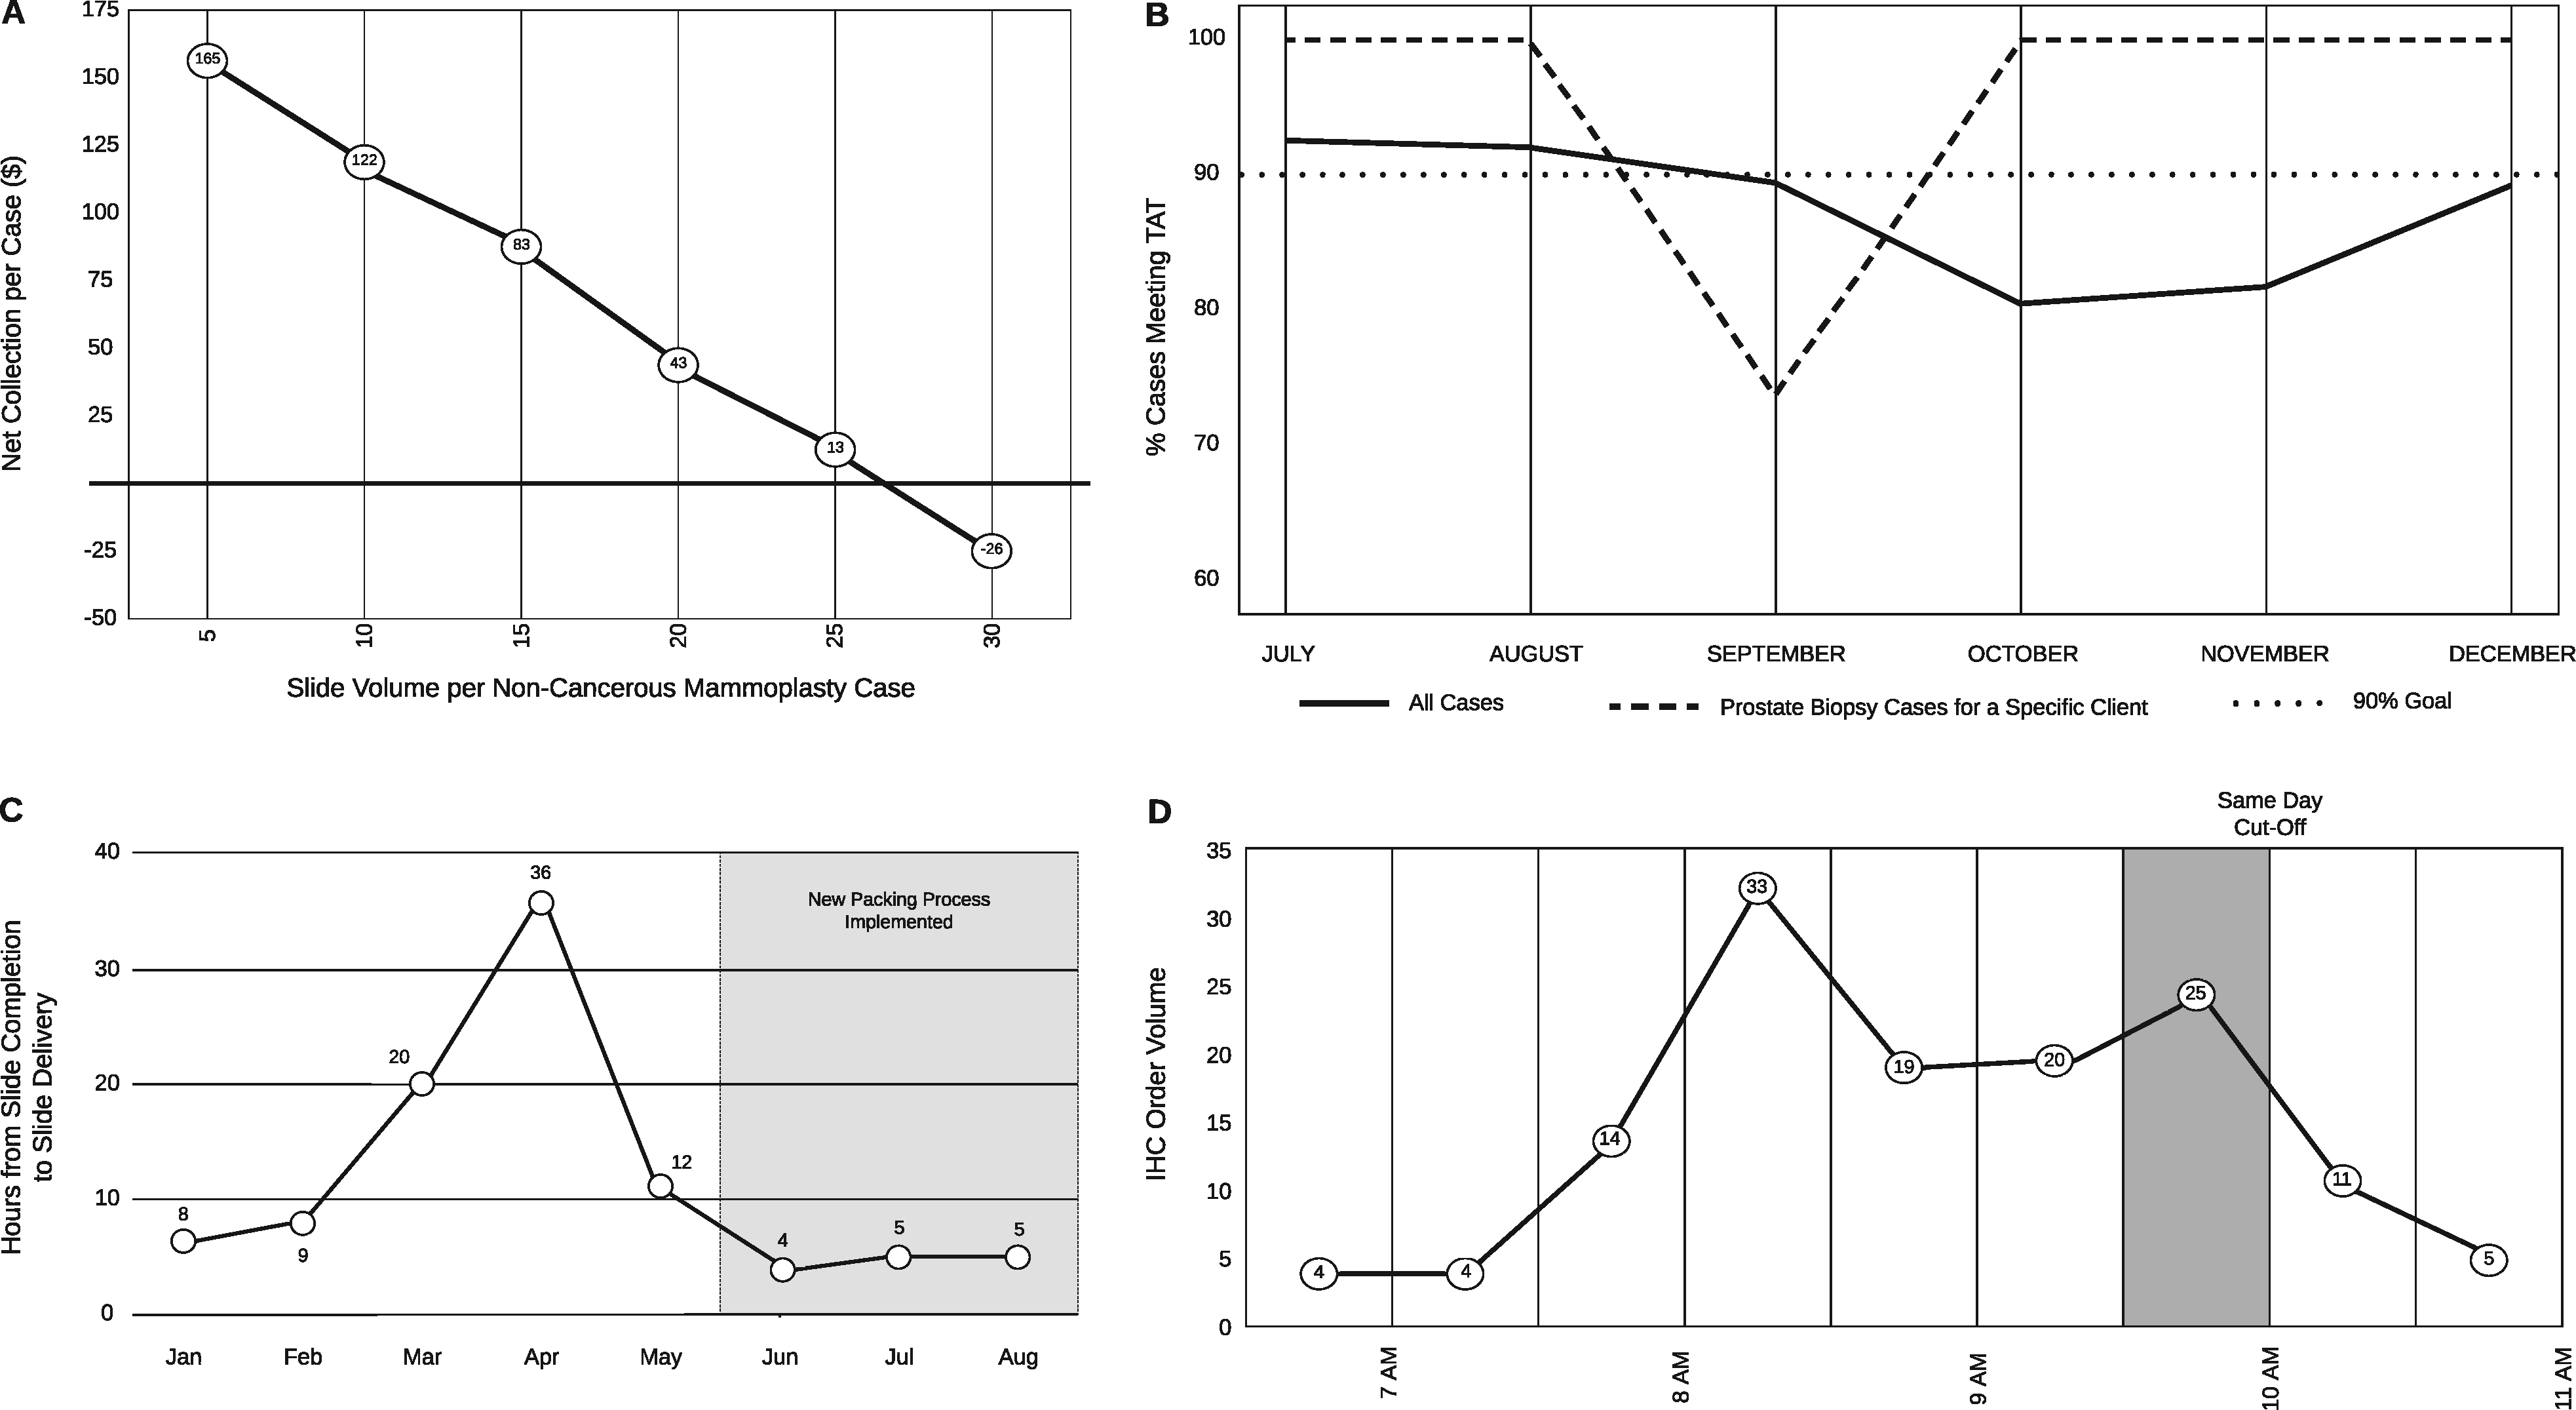
Figure 2. This composite figure shows a rendering of data generated by our SAP Business Objects dashboards. These graphs are continuously reviewed, but, as described in their relevant sections, SAP Business Objects functionality allowed for drill-down and filtering data elements to investigate and solve various histology lab problems. (A) A plot of slides per non-cancerous mammoplasty case by compensation illustrates the inverse relationship between the number of blocks submitted and the net revenue. (B) Prostate biopsy specimens from a specific client (dashed line) and overall (solid line) histology TAT. (C) Plot of hours from slide completion in histology to slide delivery to pathologist by month. This delay was ameliorated by changing courier procedure. (D) A daily surge in IHC order volume was identified immediately prior to the 10 a.m. “same day” cutoff. This surge, and its effects on case turnaround time, assisted in lobbying for additional instrumentation. |
|---|---|
| Source |
Seifert, R.P.; Casler, V.; Al Qaysi, N.; Gothi, S.R.; Williams, L.; Christensen, P.R.; Flax, S.; Chamala, S. (2020). "Informatics driven quality improvement in the modern histology lab". JAMIA Open 3: 4. doi:10.1093/jamiaopen/ooaa066. |
| Date |
2020 |
| Author |
Seifert, R.P.; Casler, V.; Al Qaysi, N.; Gothi, S.R.; Williams, L.; Christensen, P.R.; Flax, S.; Chamala, S. |
| Permission (Reusing this file) |
|
| Other versions |
Licensing
|
|
This work is licensed under the Creative Commons Attribution 4.0 License. |
File history
Click on a date/time to view the file as it appeared at that time.
| Date/Time | Thumbnail | Dimensions | User | Comment | |
|---|---|---|---|---|---|
| current | 22:55, 2 May 2021 | | 3,931 × 2,151 (185 KB) | Shawndouglas (talk | contribs) |
You cannot overwrite this file.
File usage
The following 2 pages use this file:


