File:Fig3 Cassim AfricanJLabMed2020 9-2-b.jpg
From LIMSWiki
Jump to navigationJump to search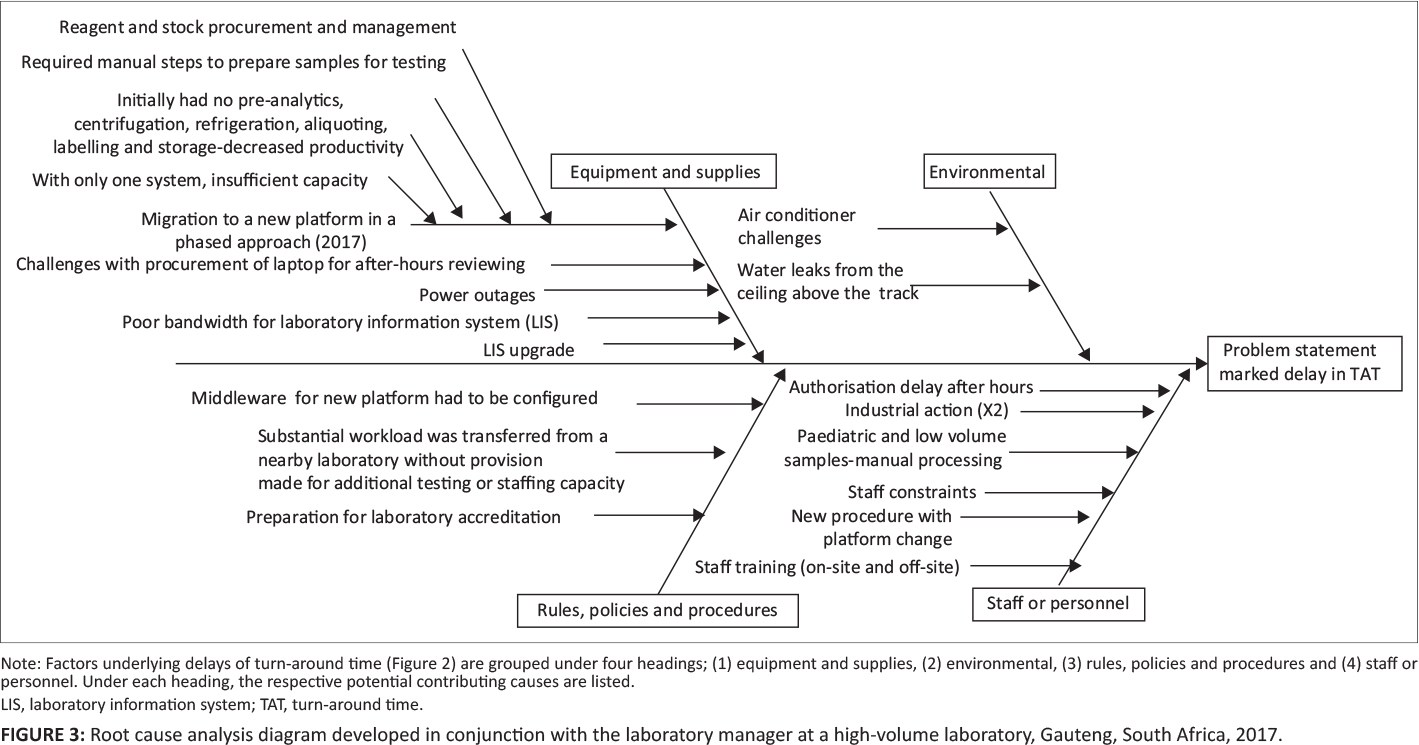
Size of this preview: 800 × 420 pixels. Other resolution: 1,419 × 745 pixels.
Original file (1,419 × 745 pixels, file size: 638 KB, MIME type: image/jpeg)
Summary
| Description |
Figure 3. Root cause analysis diagram developed in conjunction with the laboratory manager at a high-volume laboratory, Gauteng, South Africa, 2017 |
|---|---|
| Source |
Cassim, N.; Coetzee, L.M.; Tepper, M.E.; Perelson, L.; Glencross, D.K. (2020). "Timely delivery of laboratory efficiency information, Part II: Assessing the impact of a turnaround time dashboard at a high-volume laboratory". African Journal of Laboratory Medicine 9 (2): a948. doi:10.4102/ajlm.v9i2.948. |
| Date |
2020 |
| Author |
Cassim, N.; Coetzee, L.M.; Tepper, M.E.; Perelson, L.; Glencross, D.K. |
| Permission (Reusing this file) |
|
| Other versions |
Licensing
|
|
This work is licensed under the Creative Commons Attribution 4.0 License. |
File history
Click on a date/time to view the file as it appeared at that time.
| Date/Time | Thumbnail | Dimensions | User | Comment | |
|---|---|---|---|---|---|
| current | 18:34, 24 January 2021 | | 1,419 × 745 (638 KB) | Shawndouglas (talk | contribs) |
You cannot overwrite this file.
File usage
The following page uses this file:


