File:Fig3 Garza BMCBioinformatics2016 17.gif
Fig3_Garza_BMCBioinformatics2016_17.gif (471 × 248 pixels, file size: 16 KB, MIME type: image/gif)
Summary
| Description |
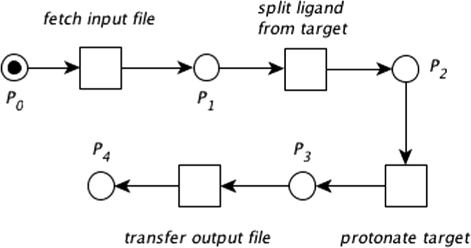
Fig. 3 A workflow as represented by a Petri net. Petri net modelling a software pipeline to protonate a molecule found in a single input file. Places are shown as circles, transitions are depicted as squares. The place P0 expects and contains one token, represented by a black dot, and is thus enabled. It follows that P0 is the starting place and P4 represents the end of the process. |
|---|---|
| Source |
de la Garza, L.; Veit, J.; Szolek, A.; Röttig, M.; Aiche, S.; Gesing, S.; Reinert, K.; Kohlbacher, O. (2016). "From the desktop to the grid: Scalable bioinformatics via workflow conversion". BMC Bioinformatics 17: 127. doi:10.1186/s12859-016-0978-9. PMC PMC4788856. PMID 26968893. https://www.ncbi.nlm.nih.gov/pmc/articles/PMC4788856. |
| Date |
2016 |
| Author |
de la Garza, L.; Veit, J.; Szolek, A.; Röttig, M.; Aiche, S.; Gesing, S.; Reinert, K.; Kohlbacher, O. |
| Permission (Reusing this file) |
|
| Other versions |
Licensing
|
|
This work is licensed under the Creative Commons Attribution 4.0 License. |
File history
Click on a date/time to view the file as it appeared at that time.
| Date/Time | Thumbnail | Dimensions | User | Comment | |
|---|---|---|---|---|---|
| current | 21:15, 13 June 2016 |  | 471 × 248 (16 KB) | Shawndouglas (talk | contribs) |
You cannot overwrite this file.
File usage
The following page uses this file:


