File:Fig3 Jikomes SciReports2018 8.jpg
Original file (900 × 786 pixels, file size: 50 KB, MIME type: image/jpeg)
Summary
| Description |
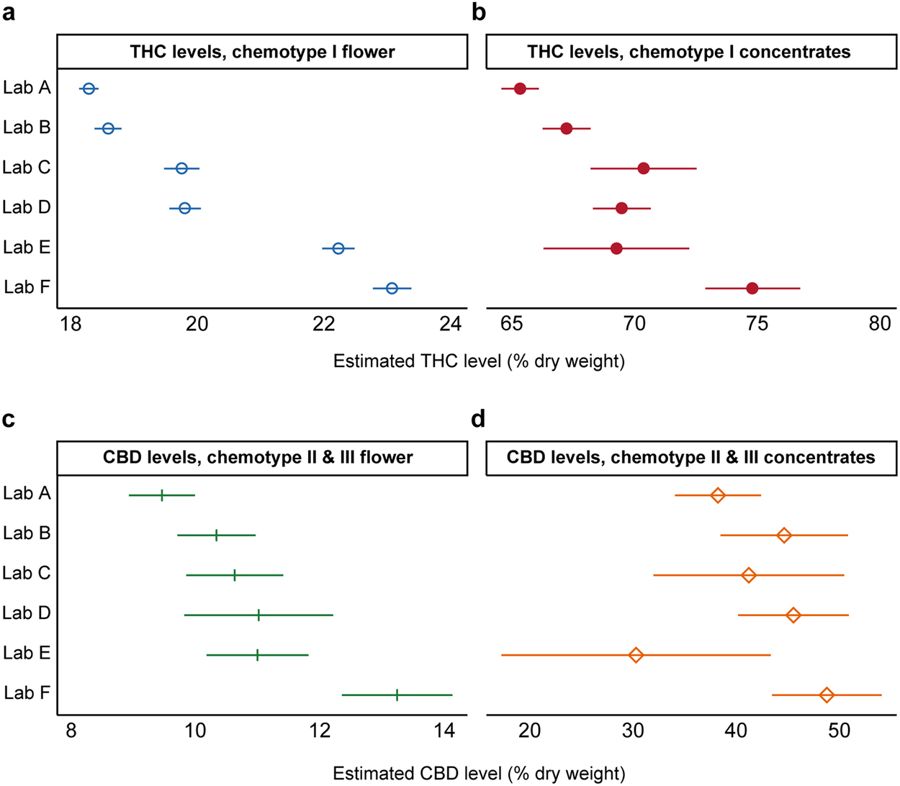
Figure 3. THC and CBD Levels Vary Between Labs After Controlling for Plausible Confounds. Average predicted values (+/− 99% confidence intervals) are shown, by lab, for (a) THC levels in chemotype I flower products (n = 161,933); (b) THC levels in chemotype I concentrate products (n = 33,888); (c) CBD levels in chemotype II and III flower products (n = 4,661); and (d) CBD levels in chemotype II and III concentrate products (n = 2,156) after adjusting for grower, strain-name, and time of measurement. Predicted values were generated from fixed-effects regressions with cluster-robust standard errors (see Methods). |
|---|---|
| Source |
Jikomes, N.; Zoorob, M. (2018). "The cannabinoid content of legal cannabis in Washington State varies systematically across testing facilities and popular consumer products". Scientific Reports 8: 4519. doi:10.1038/s41598-018-22755-2. |
| Date |
2018 |
| Author |
Jikomes, N.; Zoorob, M. |
| Permission (Reusing this file) |
|
| Other versions |
Licensing
|
|
This work is licensed under the Creative Commons Attribution 4.0 License. |
File history
Click on a date/time to view the file as it appeared at that time.
| Date/Time | Thumbnail | Dimensions | User | Comment | |
|---|---|---|---|---|---|
| current | 21:31, 5 April 2019 | | 900 × 786 (50 KB) | Shawndouglas (talk | contribs) | {{Information |Description='''Figure 3.''' THC and CBD Levels Vary Between Labs After Controlling for Plausible Confounds. Average predicted values (+/− 99% confidence intervals) are shown, by lab, for '''(a)''' THC levels in chemotype I flower produ... |
You cannot overwrite this file.


