File:Fig3 Maury FrontDigHlth2021 3.jpg
From LIMSWiki
Jump to navigationJump to search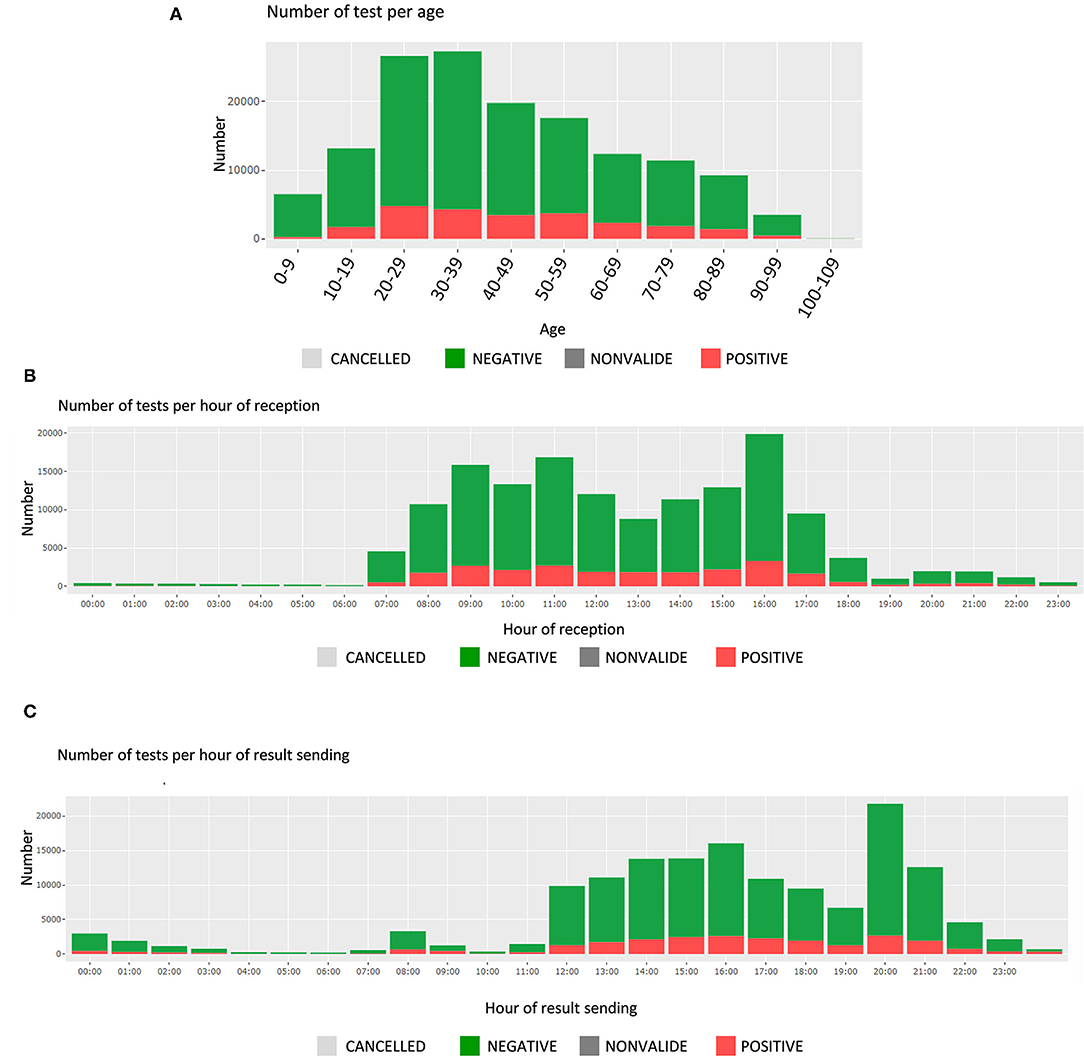
Size of this preview: 615 × 599 pixels. Other resolution: 1,084 × 1,056 pixels.
Original file (1,084 × 1,056 pixels, file size: 338 KB, MIME type: image/jpeg)
Summary
| Description |
Figure 3. Screen shots of the middle panel of Filter page showing (A) the number of tests and test results, per age group, (B) the number of tests per hour of reception, and (C) the number of tests per hour of results sending. |
|---|---|
| Source |
Maury, E.; Boldi, M.-O.; Greub, G.; Chavez, V.; Jaton, K.; Opota, O. (2021). "An automated dashboard to improve laboratory COVID-19 diagnostics management". Frontiers in Digital Health 3: 773986. doi:10.3389/fdgth.2021.773986. |
| Date |
2021 |
| Author |
Maury, E.; Boldi, M.-O.; Greub, G.; Chavez, V.; Jaton, K.; Opota, O. |
| Permission (Reusing this file) |
|
| Other versions |
Licensing
|
|
This work is licensed under the Creative Commons Attribution 4.0 License. |
File history
Click on a date/time to view the file as it appeared at that time.
| Date/Time | Thumbnail | Dimensions | User | Comment | |
|---|---|---|---|---|---|
| current | 21:09, 17 February 2022 | | 1,084 × 1,056 (338 KB) | Shawndouglas (talk | contribs) |
You cannot overwrite this file.
File usage
The following page uses this file:


