File:Fig3 Starks JPathInfo2021 12.jpg
Original file (809 × 1,344 pixels, file size: 246 KB, MIME type: image/jpeg)
Summary
| Description |
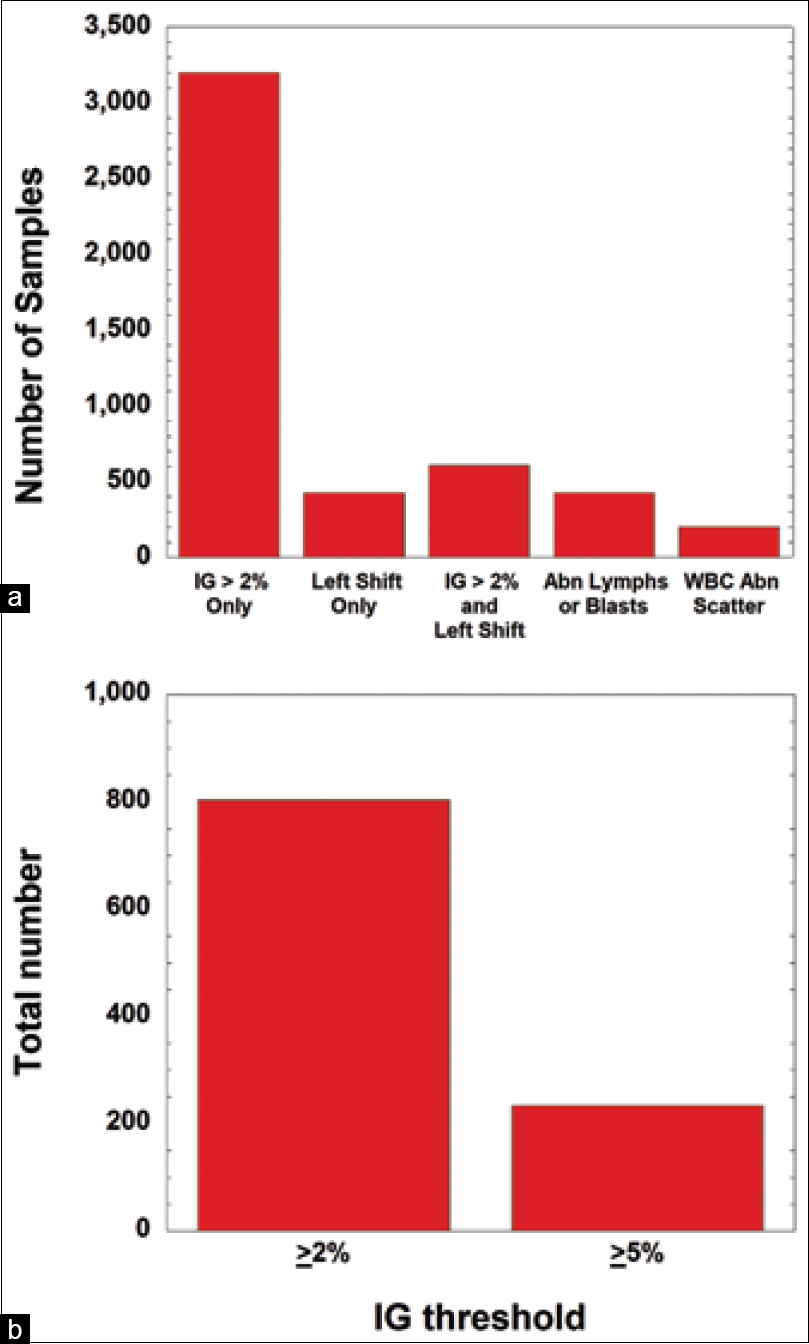
Figure 3. When a single flag for manual review was triggered, the four most frequent rules identified are shown, including a potential overlap of parameters in IG Present and Left Shift in (a). Shown in (b) is the difference in manual review rates when the IG cutoff is changed from ≥2% (804 samples) to ≥5% (234 samples). IG: Immature granulocytes, Abn Lymphs or Blasts: Abnormal lymphocytes or blasts, WBC Abn Scatter: White blood cell abnormal scattergram |
|---|---|
| Source |
Starks, R.D.; Merrill, A.E.; Davis, S.R.; Voss, D.R.; Goldsmith, P.J.; Brown, B.S.; Kulhavy, J.; Krasowski, M.D. (2021). "Use of middleware data to dissect and optimize hematology autoverification". Journal of Pathology Informatics 21 (16): 5493. doi:10.3390/s21165493. |
| Date |
2021 |
| Author |
Starks, R.D.; Merrill, A.E.; Davis, S.R.; Voss, D.R.; Goldsmith, P.J.; Brown, B.S.; Kulhavy, J.; Krasowski, M.D. |
| Permission (Reusing this file) |
Creative Commons Attribution-NonCommercial-ShareAlike 4.0 International |
| Other versions |
Licensing
|
|
This work is licensed under the Creative Commons Creative Commons Attribution-NonCommercial-ShareAlike 4.0 International License. |
File history
Click on a date/time to view the file as it appeared at that time.
| Date/Time | Thumbnail | Dimensions | User | Comment | |
|---|---|---|---|---|---|
| current | 19:51, 18 October 2021 | | 809 × 1,344 (246 KB) | Shawndouglas (talk | contribs) |
You cannot overwrite this file.
File usage
The following page uses this file:


