File:Fig4 Cassim AfricanJLabMed2020 9-2.jpg
Original file (1,419 × 917 pixels, file size: 670 KB, MIME type: image/jpeg)
Summary
| Description |
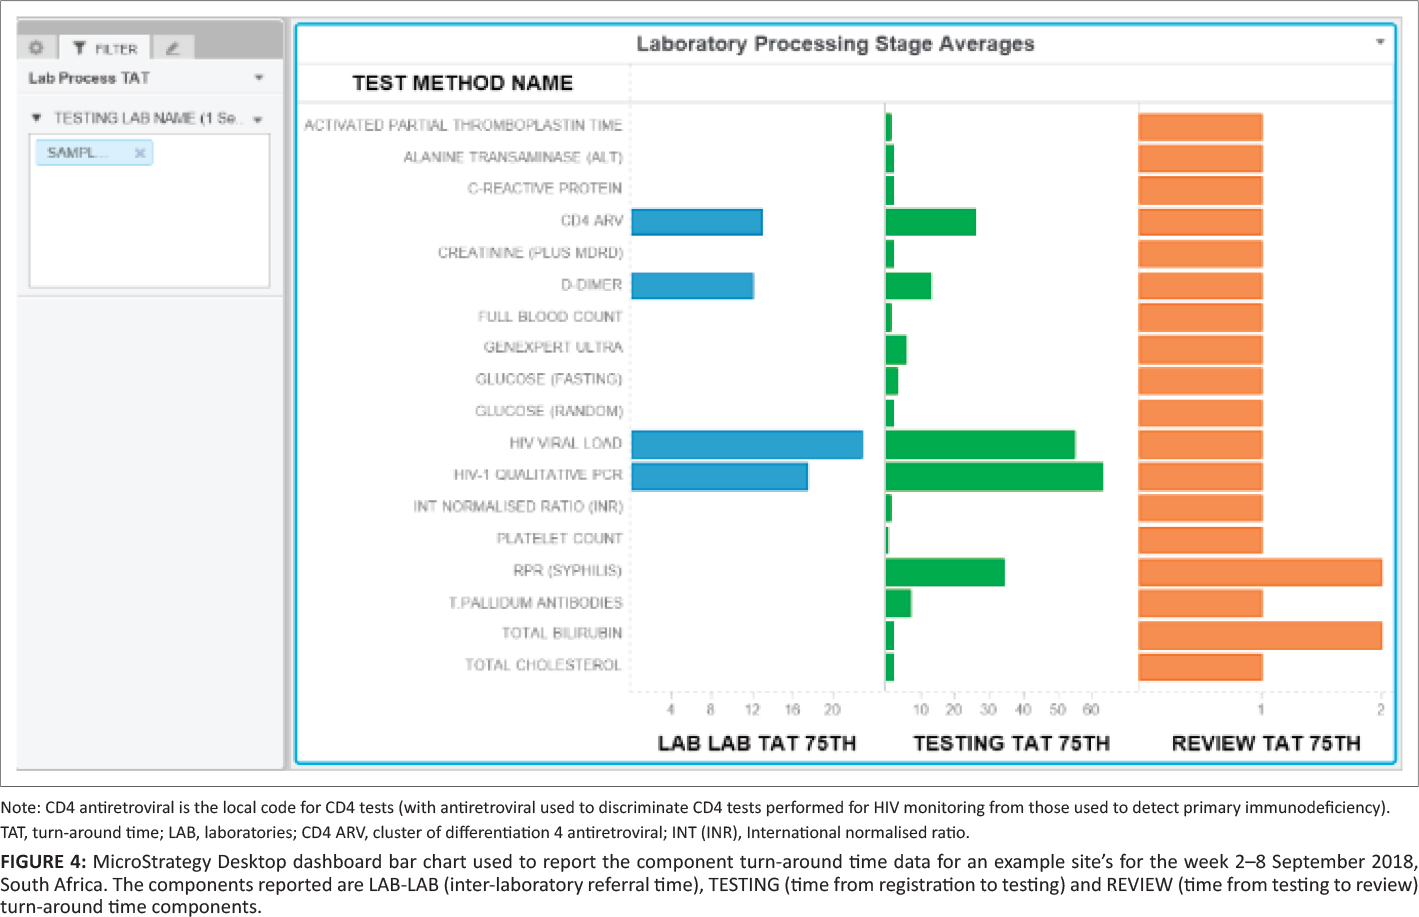
Figure 4. MicroStrategy Desktop dashboard bar chart used to report the component turnaround time data for an example site’s for the week of September 2–8, 2018, South Africa. The components reported are LAB-LAB (inter-laboratory referral time), TESTING (time from registration to testing), and REVIEW (time from testing to review) turnaround time components. |
|---|---|
| Source |
Cassim, N.; Tepper, M.E.; Coetzee, L.M.; Glencross, D.K. (2020). "Timely delivery of laboratory efficiency information, Part I: Developing an interactive turnaround time dashboard at a high-volume laboratory". African Journal of Laboratory Medicine 9 (2): a947. doi:10.4102/ajlm.v9i2.947. |
| Date |
2020 |
| Author |
Cassim, N.; Tepper, M.E.; Coetzee, L.M.; Glencross, D.K. |
| Permission (Reusing this file) |
|
| Other versions |
Licensing
|
|
This work is licensed under the Creative Commons Attribution 4.0 License. |
File history
Click on a date/time to view the file as it appeared at that time.
| Date/Time | Thumbnail | Dimensions | User | Comment | |
|---|---|---|---|---|---|
| current | 22:17, 18 January 2021 | | 1,419 × 917 (670 KB) | Shawndouglas (talk | contribs) |
You cannot overwrite this file.
File usage
The following page uses this file:


