File:Fig4 Easton OJofPubHlthInfo2015 7-3.jpg
From LIMSWiki
Jump to navigationJump to search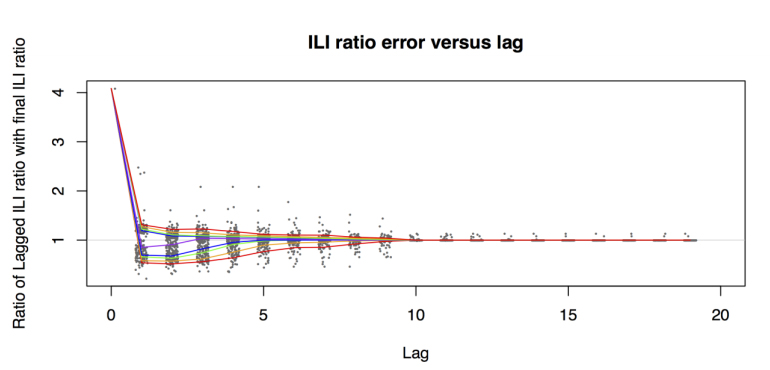
No higher resolution available.
Fig4_Easton_OJofPubHlthInfo2015_7-3.jpg (770 × 370 pixels, file size: 90 KB, MIME type: image/jpeg)
Summary
| Description |
Figure 4. ILI ratio errors with 5th, 10th, 25th, 50th, 75th, 90th and 95th quantiles using the ratio error function. We used the 21 day lagged counts as final counts to avoid the effects of long backfills that sites periodically provided. |
|---|---|
| Source |
Eaton, J.; Painter, I.; Olson, D.; Lober, W. (2015). "Visualizing the quality of partially accruing data for use in decision making". Online Journal of Public Health Informatics 7 (3): e226. doi:10.5210/ojphi.v7i3.6096. |
| Date |
2015 |
| Author |
Eaton, J.; Painter, I.; Olson, D.; Lober, W. |
| Permission (Reusing this file) |
|
| Other versions |
Licensing
|
|
This work is licensed under the Creative Commons Attribution-NonCommercial 3.0 Unported License. |
File history
Click on a date/time to view the file as it appeared at that time.
| Date/Time | Thumbnail | Dimensions | User | Comment | |
|---|---|---|---|---|---|
| current | 22:51, 16 May 2016 | | 770 × 370 (90 KB) | Shawndouglas (talk | contribs) |
You cannot overwrite this file.
File usage
The following page uses this file:


