File:Fig4 Frede Processes23 11-1.png
From LIMSWiki
Jump to navigationJump to search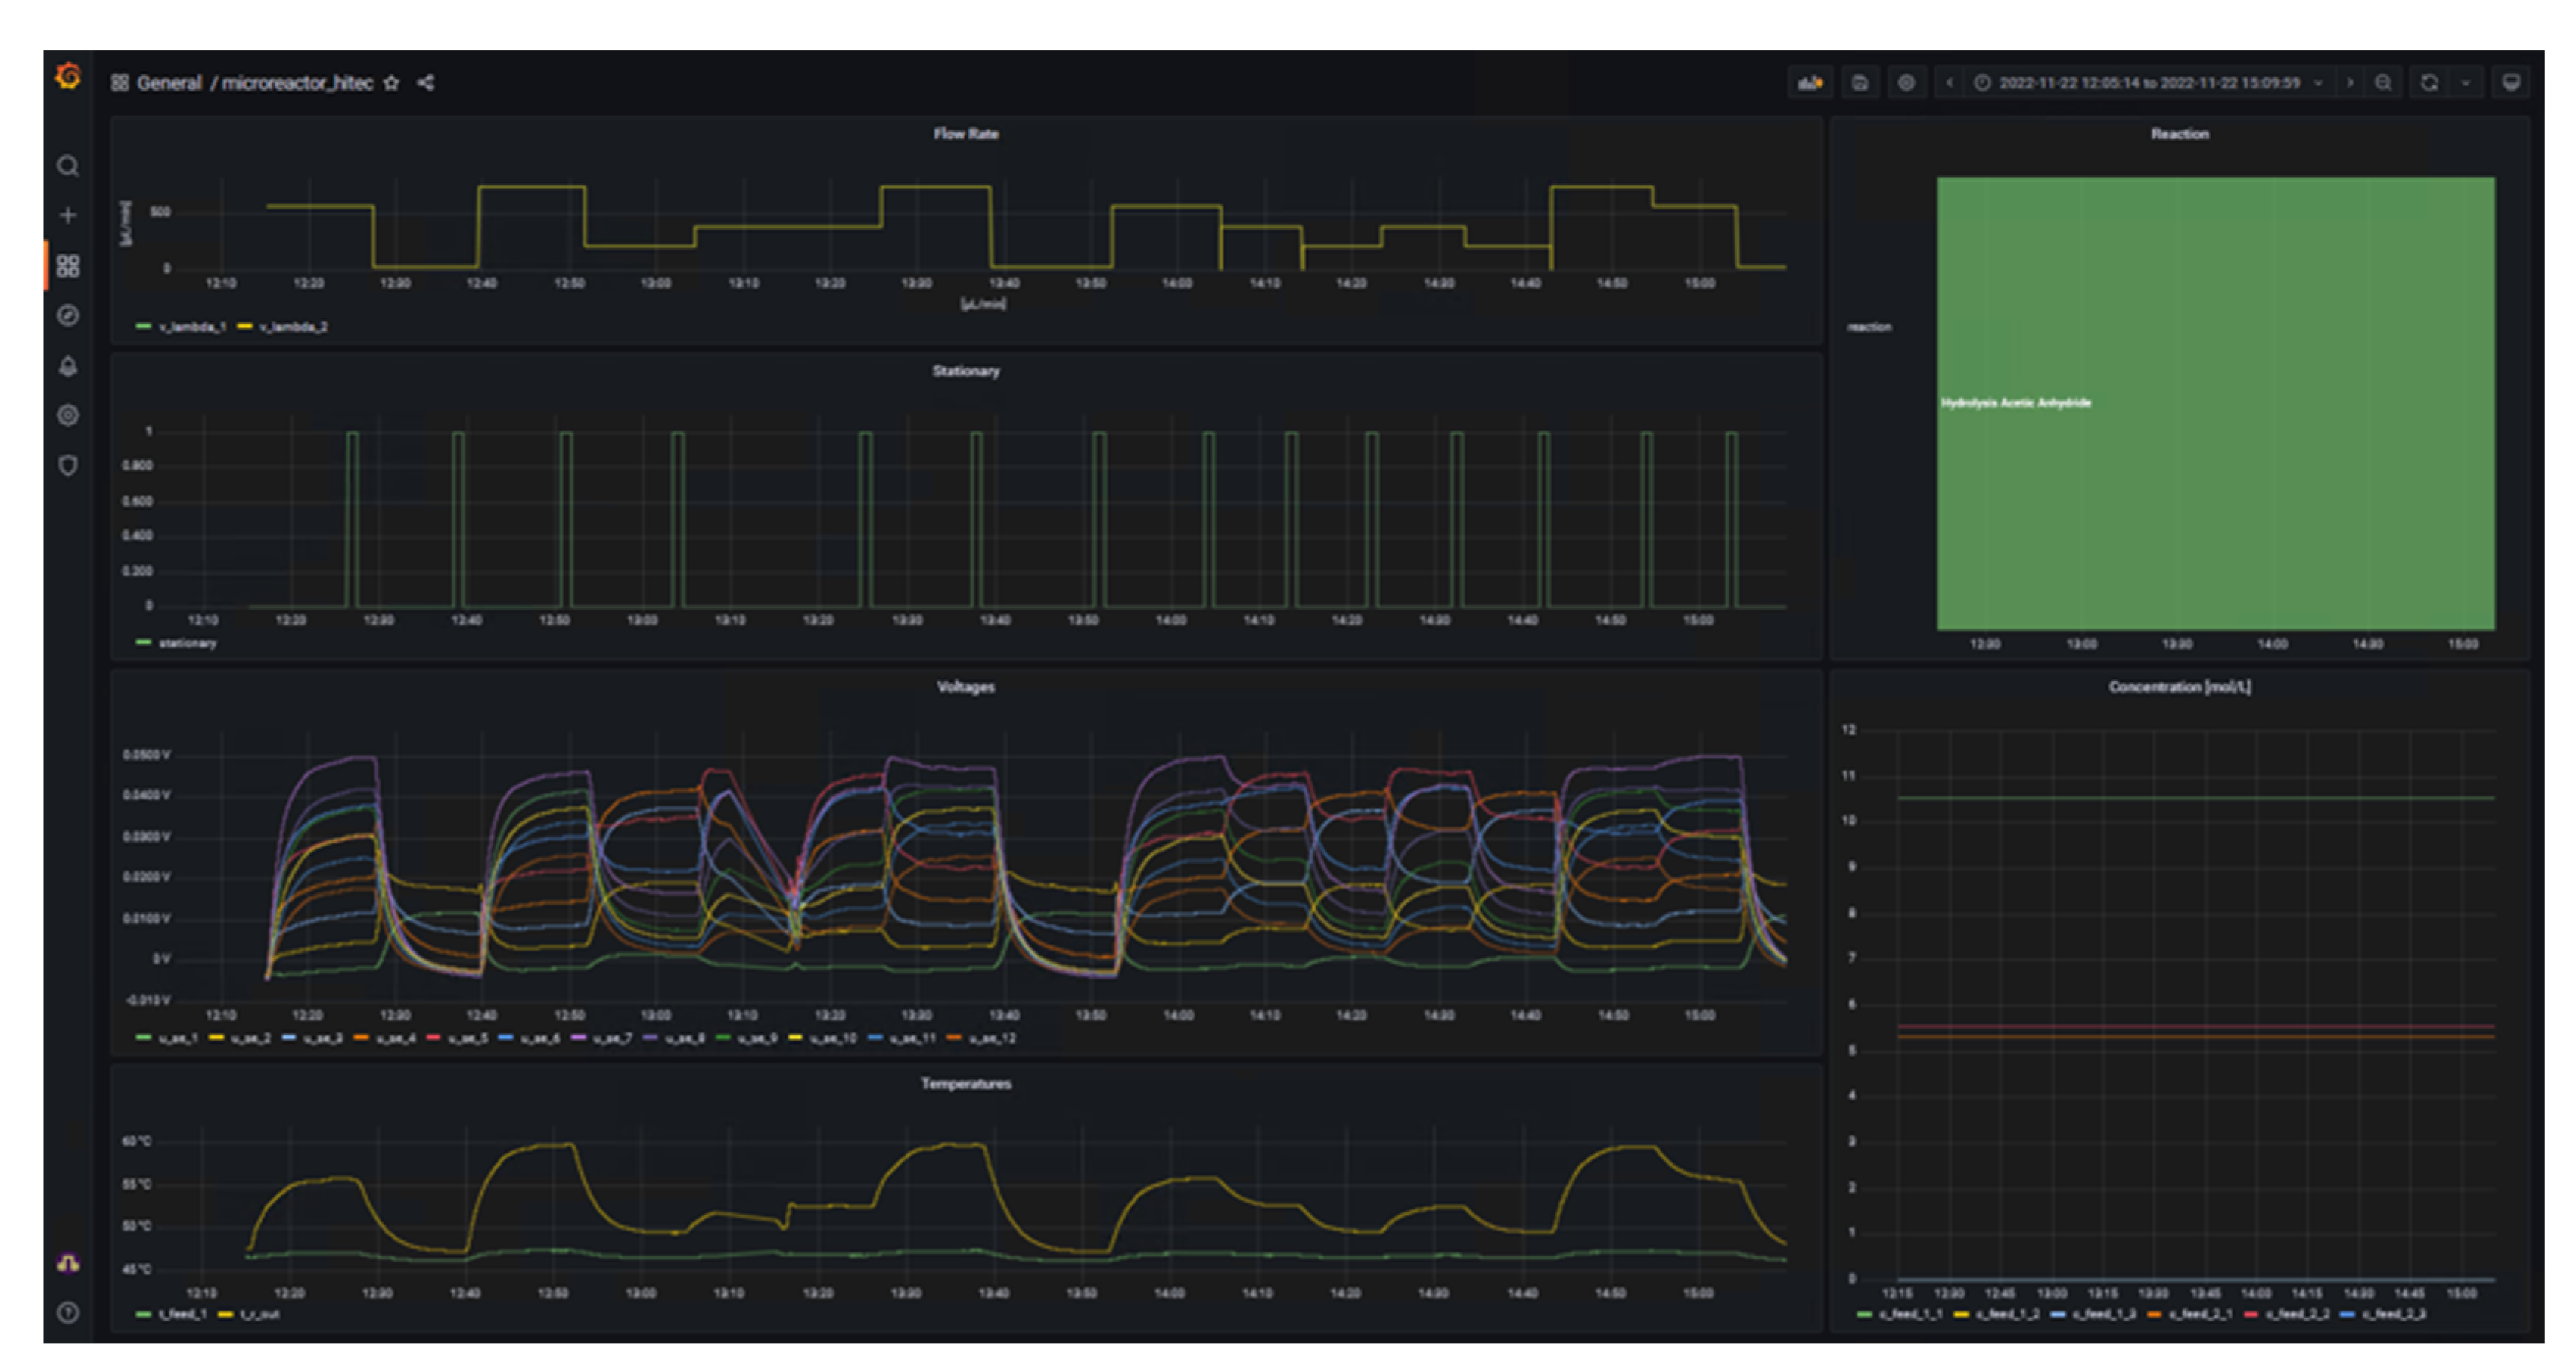
Size of this preview: 800 × 426 pixels. Other resolution: 3,405 × 1,814 pixels.
Original file (3,405 × 1,814 pixels, file size: 1.66 MB, MIME type: image/png)
Summary
| Description |
Figure 4. Dashboard for visualization of experimental data during calorimetric measurements such as volumetric flow rates and temperatures. |
|---|---|
| Source |
Frede, T.A.; Weber, C.; Brockhoff, T.; Christ, T.; Ludwig, D.; Kockmann, N. (2023). "Data management of microscale reaction calorimeter using a modular open-source IoT platform". Processes 11 (1): 279. doi:10.3390/pr11010279. |
| Date |
2023 |
| Author |
Frede, T.A.; Weber, C.; Brockhoff, T.; Christ, T.; Ludwig, D.; Kockmann, N. |
| Permission (Reusing this file) |
|
| Other versions |
Licensing
|
|
This work is licensed under the Creative Commons Attribution 4.0 License. |
File history
Click on a date/time to view the file as it appeared at that time.
| Date/Time | Thumbnail | Dimensions | User | Comment | |
|---|---|---|---|---|---|
| current | 20:46, 19 April 2023 | | 3,405 × 1,814 (1.66 MB) | Shawndouglas (talk | contribs) |
You cannot overwrite this file.
File usage
The following page uses this file:


