File:Fig4 Riley JOfBioEng2017 11.gif
Fig4_Riley_JOfBioEng2017_11.gif (358 × 171 pixels, file size: 13 KB, MIME type: image/gif)
Summary
| Description |
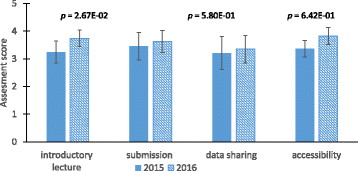
Figure 4. User assessment scores for various attributes from 2015 and 2016 course offerings. Data is represented as mean ± standard deviation. Statistical significance is evaluated using a two sample t-Test assuming unequal variances. Data categories include: introductory lecture = LabArchives introductory lecture; submission = turning in protocols and lab notebook pages; data sharing = sharing data with other teams; accessibility = accessibility of information needed for the experiments in LabArchives. n = 32 for 2015 and n = 23 for 2016. |
|---|---|
| Source |
Riley, E.M.; Hattaway, H.Z.; Felse, P.A. (2017). "Implementation and use of cloud-based electronic lab notebook in a bioprocess engineering teaching laboratory". Journal of Biological Engineering 11: 40. doi:10.1186/s13036-017-0083-2. PMC PMC5701295. PMID 29201138. https://www.ncbi.nlm.nih.gov/pmc/articles/PMC5701295. |
| Date |
2017 |
| Author |
Riley, E.M.; Hattaway, H.Z.; Felse, P.A. |
| Permission (Reusing this file) |
|
| Other versions |
Licensing
|
|
This work is licensed under the Creative Commons Attribution 4.0 License. |
File history
Click on a date/time to view the file as it appeared at that time.
| Date/Time | Thumbnail | Dimensions | User | Comment | |
|---|---|---|---|---|---|
| current | 22:30, 24 April 2018 |  | 358 × 171 (13 KB) | Shawndouglas (talk | contribs) |
You cannot overwrite this file.
File usage
The following page uses this file:


