File:Fig5 Jikomes SciReports2018 8.jpg
Original file (900 × 1,135 pixels, file size: 100 KB, MIME type: image/jpeg)
Summary
| Description |
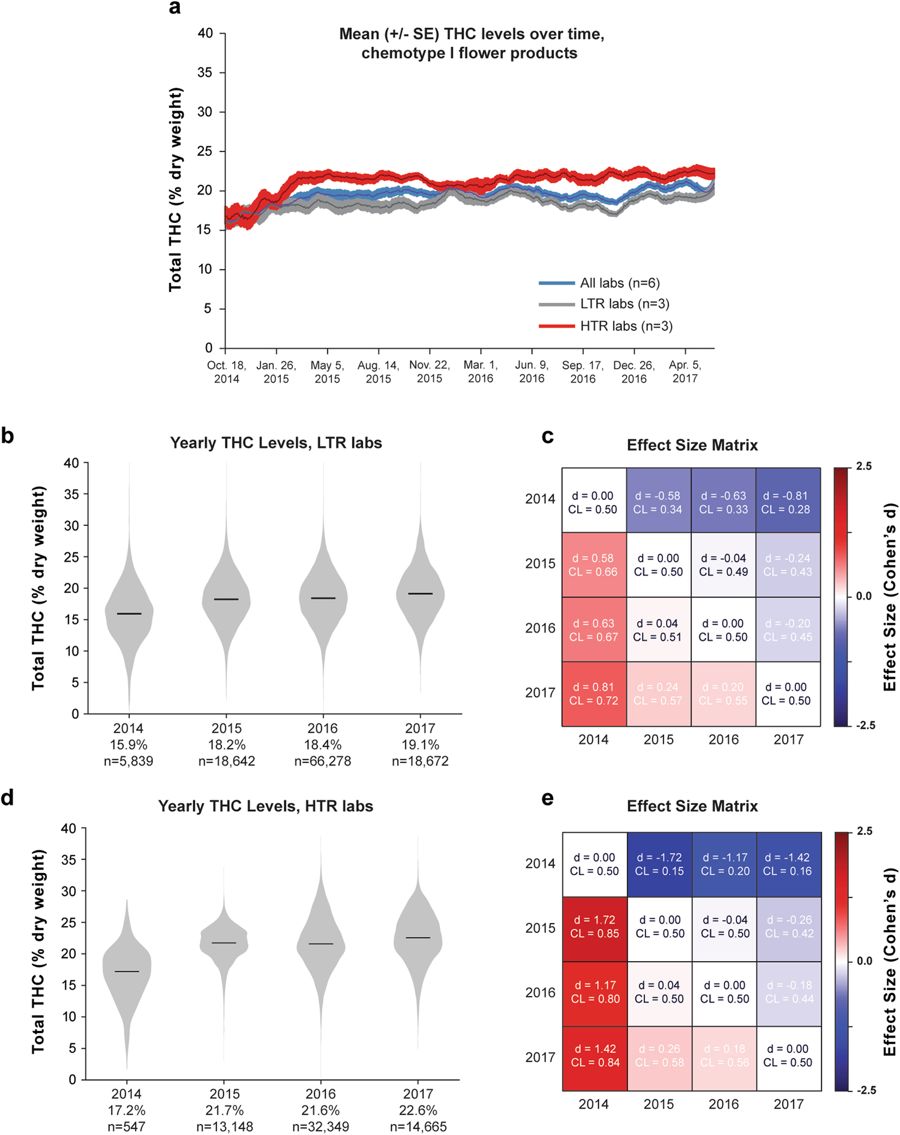
Figure 5. Mean THC Levels for Chemotype I Flower Products Over Time. (a) Total THC levels over time averaged across all labs or those reporting the highest or lowest mean THC levels. (b) Distribution of THC levels for each year on record for low THC reporting (LTR) labs. (c) Effect size matrix quantifying the mean difference in THC levels across years for LTR labs. (d) Distribution of THC levels for each year for high THC reporting (HTR) labs, and (e) the effect size matrix quantifying the magnitude of yearly differences. |
|---|---|
| Source |
Jikomes, N.; Zoorob, M. (2018). "The cannabinoid content of legal cannabis in Washington State varies systematically across testing facilities and popular consumer products". Scientific Reports 8: 4519. doi:10.1038/s41598-018-22755-2. |
| Date |
2018 |
| Author |
Jikomes, N.; Zoorob, M. |
| Permission (Reusing this file) |
|
| Other versions |
Licensing
|
|
This work is licensed under the Creative Commons Attribution 4.0 License. |
File history
Click on a date/time to view the file as it appeared at that time.
| Date/Time | Thumbnail | Dimensions | User | Comment | |
|---|---|---|---|---|---|
| current | 21:33, 5 April 2019 | | 900 × 1,135 (100 KB) | Shawndouglas (talk | contribs) | {{Information |Description='''Figure 5.''' Mean THC Levels for Chemotype I Flower Products Over Time. '''(a)''' Total THC levels over time averaged across all labs or those reporting the highest or lowest mean THC levels. '''(b)''' Distribution of THC... |
You cannot overwrite this file.


