File:Fig5 Maury FrontDigHlth2021 3.jpg
Original file (1,084 × 726 pixels, file size: 240 KB, MIME type: image/jpeg)
Summary
| Description |
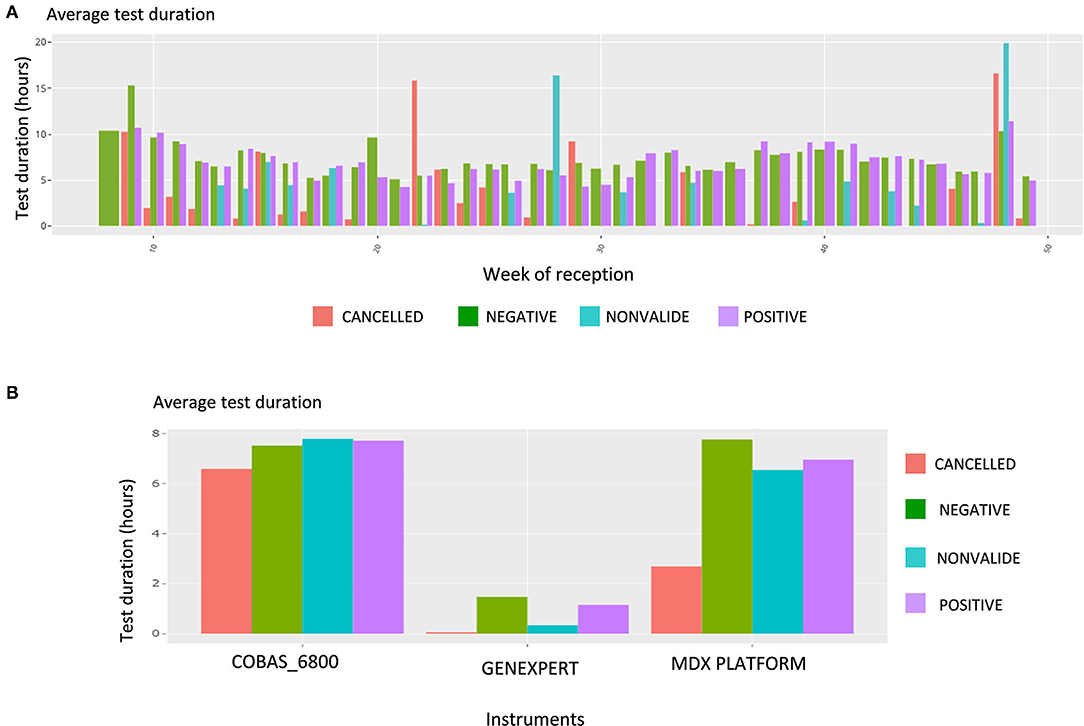
Figure 5. Screen shot of the Comparison page that allows 182 different combinations, with a focus on test duration. (A) Average test duration, per week of reception and test result, for all tests. (B) Average test duration, per device and test result, for all tests. |
|---|---|
| Source |
Maury, E.; Boldi, M.-O.; Greub, G.; Chavez, V.; Jaton, K.; Opota, O. (2021). "An automated dashboard to improve laboratory COVID-19 diagnostics management". Frontiers in Digital Health 3: 773986. doi:10.3389/fdgth.2021.773986. |
| Date |
2021 |
| Author |
Maury, E.; Boldi, M.-O.; Greub, G.; Chavez, V.; Jaton, K.; Opota, O. |
| Permission (Reusing this file) |
|
| Other versions |
Licensing
|
|
This work is licensed under the Creative Commons Attribution 4.0 License. |
File history
Click on a date/time to view the file as it appeared at that time.
| Date/Time | Thumbnail | Dimensions | User | Comment | |
|---|---|---|---|---|---|
| current | 21:30, 17 February 2022 | | 1,084 × 726 (240 KB) | Shawndouglas (talk | contribs) |
You cannot overwrite this file.
File usage
The following page uses this file:


