File:Fig5 Trellet JOfIntegBioinfo2018 15-2.jpg
Original file (1,422 × 513 pixels, file size: 77 KB, MIME type: image/jpeg)
Summary
| Description |
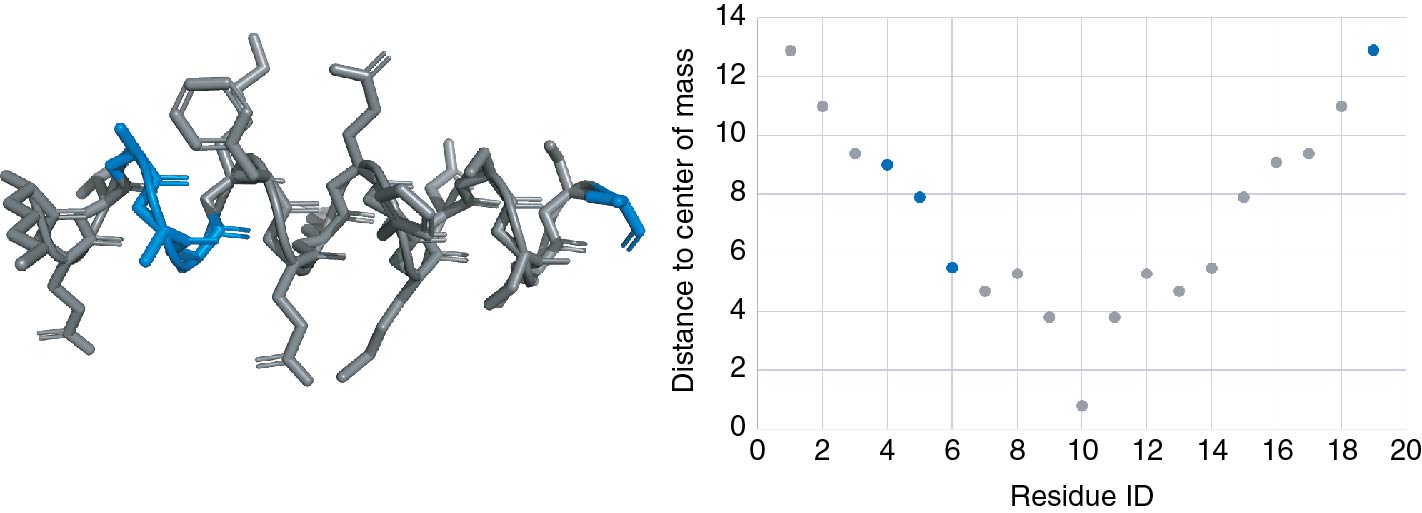
Figure 5. 3D structure visualization and analytical plot of residue distance to the center of mass for the KETAAAKFERQHMDSSTSA peptide in two different spaces of the same environment. The highlighted selection is the result of the 2nd command from Table 2. |
|---|---|
| Source |
Trellet, M.; Férey, N.; Flotyński, J.; Baaden, M.; Bourdot, P. (2019). "Semantics for an integrative and immersive pipeline combining visualization and analysis of molecular data". Journal of Integrative Bioinformatics 5 (1): 9. doi:10.3390/ijns5010009. |
| Date |
2018 |
| Author |
Trellet, M.; Férey, N.; Flotyński, J.; Baaden, M.; Bourdot, P. |
| Permission (Reusing this file) |
Creative Commons Attribution-NonCommercial-NoDerivatives 4.0 International |
| Other versions |
Licensing
|
|
This work is licensed under the Creative Commons Attribution-NonCommercial-NoDerivatives 4.0 International License. |
File history
Click on a date/time to view the file as it appeared at that time.
| Date/Time | Thumbnail | Dimensions | User | Comment | |
|---|---|---|---|---|---|
| current | 03:21, 6 March 2019 | 1,422 × 513 (77 KB) | Shawndouglas (talk | contribs) |
You cannot overwrite this file.
File usage
The following page uses this file:


