File:Fig6 Beaulieu-JonesJMIRMedInfo2018 6-1.png
Original file (2,500 × 1,458 pixels, file size: 674 KB, MIME type: image/png)
Summary
| Description |
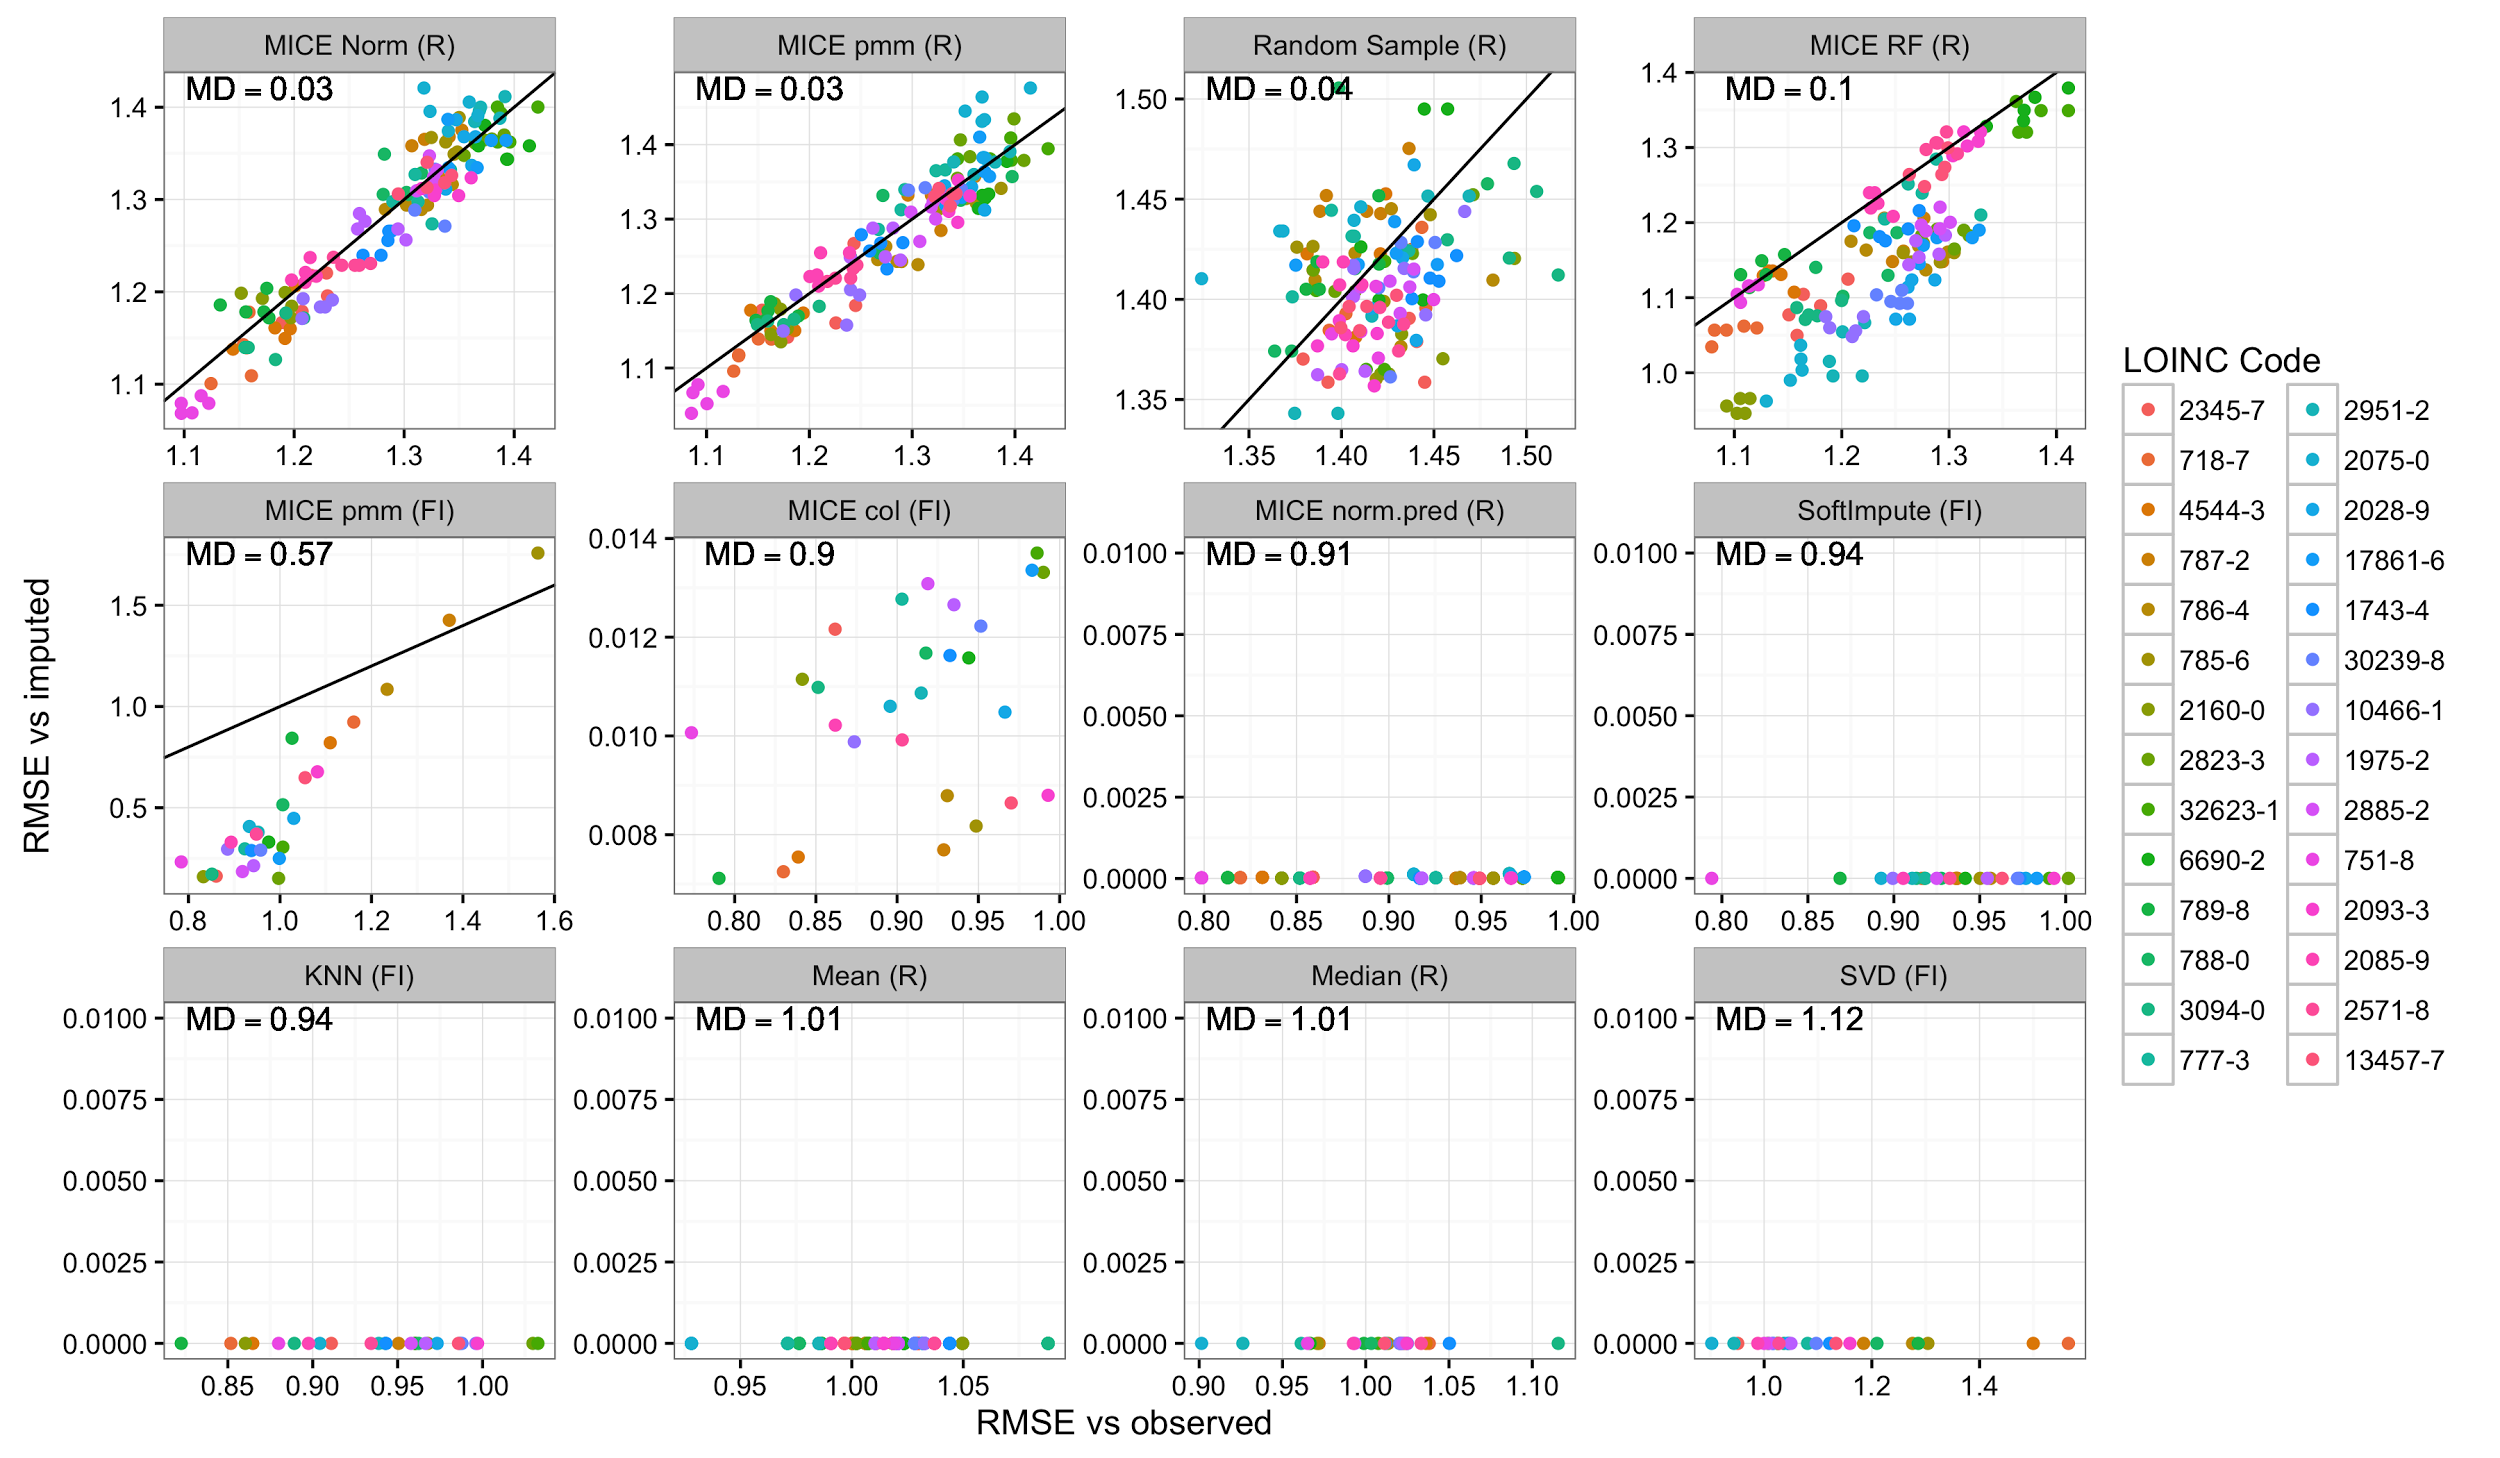
Figure 6. Assessment of multiple imputation for each method. Using simulation 4, missing values were imputed multiple times with each method. The x-axes show the root mean square error (RMSE) between the imputed data and the observed values. The y-axes show the RMSE between multiple imputations of the same data. The axis scales vary between panels to better show the range of variation. The laboratory tests are indicated by the color of the points. The black diagonal line represents unity (y=x). Panels are ordered by each method’s mean deviation (MD) from unity, indicated in the top left corner of each panel. In the last 7 panels, the unity line is not visible because the variation between multiple imputations was close to zero. FI: fancyimpute; KNN: k-nearest neighbors; MICE: Multivariate Imputation by Chained Equations; pmm: predictive mean matching; RF: random forest; SVD: singular value decomposition. |
|---|---|
| Source |
Beaulieu-Jones, B.K.; Lavage, D.R.; Snyder, J.W.; Moore, J.H.; Pendergrass, S.A.; Bauer, C.R. (2018). "Characterizing and managing missing structured data in electronic health records: Data analysis". JMIR Medical Informatics 6 (1): e11. doi:10.2196/medinform.8960. |
| Date |
2018 |
| Author |
Beaulieu-Jones, B.K.; Lavage, D.R.; Snyder, J.W.; Moore, J.H.; Pendergrass, S.A.; Bauer, C.R. |
| Permission (Reusing this file) |
|
| Other versions |
Licensing
|
|
This work is licensed under the Creative Commons Attribution 4.0 License. |
File history
Click on a date/time to view the file as it appeared at that time.
| Date/Time | Thumbnail | Dimensions | User | Comment | |
|---|---|---|---|---|---|
| current | 20:47, 6 March 2018 | | 2,500 × 1,458 (674 KB) | Shawndouglas (talk | contribs) |
You cannot overwrite this file.
File usage
The following page uses this file:


