File:Fig6 Easton OJofPubHlthInfo2015 7-3.jpg
From LIMSWiki
Jump to navigationJump to search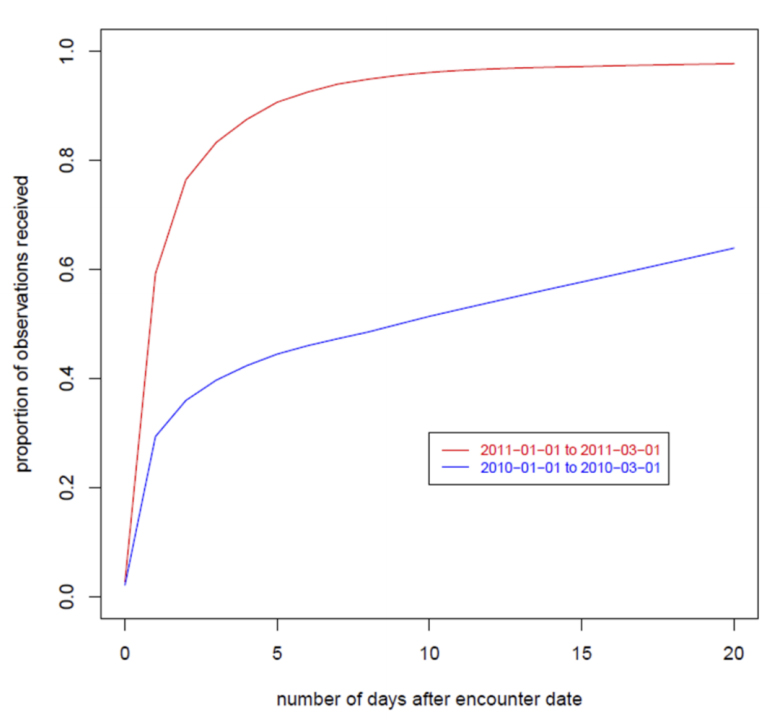
Size of this preview: 641 × 599 pixels. Other resolution: 770 × 720 pixels.
Original file (770 × 720 pixels, file size: 131 KB, MIME type: image/jpeg)
Summary
| Description |
Figure 6. Summary completion curves for all sites. |
|---|---|
| Source |
Eaton, J.; Painter, I.; Olson, D.; Lober, W. (2015). "Visualizing the quality of partially accruing data for use in decision making". Online Journal of Public Health Informatics 7 (3): e226. doi:10.5210/ojphi.v7i3.6096. |
| Date |
2015 |
| Author |
Eaton, J.; Painter, I.; Olson, D.; Lober, W. |
| Permission (Reusing this file) |
|
| Other versions |
Licensing
|
|
This work is licensed under the Creative Commons Attribution-NonCommercial 3.0 Unported License. |
File history
Click on a date/time to view the file as it appeared at that time.
| Date/Time | Thumbnail | Dimensions | User | Comment | |
|---|---|---|---|---|---|
| current | 23:12, 16 May 2016 | | 770 × 720 (131 KB) | Shawndouglas (talk | contribs) |
You cannot overwrite this file.
File usage
The following page uses this file:


