File:Fig6 Fuertes GIMDS2018 7-1.png
Original file (930 × 718 pixels, file size: 227 KB, MIME type: image/png)
Summary
| Description |
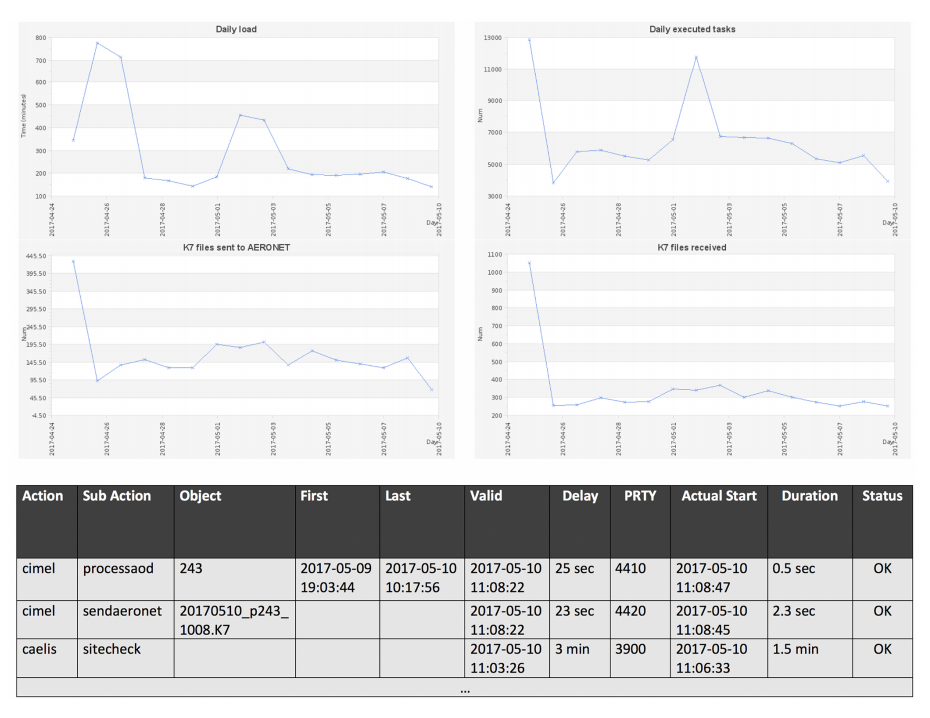
Figure 6. Plots represent CÆLIS load from different measurements: minutes of CPU per day, number of tasks executed per day and number of photometer raw data files sent to AERONET and received from stations. Those plots are constructed based on log information. The table at the bottom shows an example of the log. Delay indicates the difference between actual start and valid time therefore indicating NRT capabilities. |
|---|---|
| Source |
Fuertes, D.; Toledano, C.; González, R.; Berjón, A.; Torres, B.; Cachorro, V.E.; de Frutos, Á.M. (2018). "CÆLIS: Software for assimilation, management, and processing data of an atmospheric measurement network". Geoscientific Instrumentation, Methods and Data Systems 7 (1): 67–81. doi:10.5194/gi-7-67-2018. |
| Date |
2018 |
| Author |
Fuertes, D.; Toledano, C.; González, R.; Berjón, A.; Torres, B.; Cachorro, V.E.; de Frutos, Á.M. |
| Permission (Reusing this file) |
|
| Other versions |
Licensing
|
|
This work is licensed under the Creative Commons Attribution 4.0 License. |
File history
Click on a date/time to view the file as it appeared at that time.
| Date/Time | Thumbnail | Dimensions | User | Comment | |
|---|---|---|---|---|---|
| current | 20:28, 17 August 2018 | | 930 × 718 (227 KB) | Shawndouglas (talk | contribs) |
You cannot overwrite this file.
File usage
The following page uses this file:


