File:Fig6 Liscouski NotesOnInstDataSys20.png
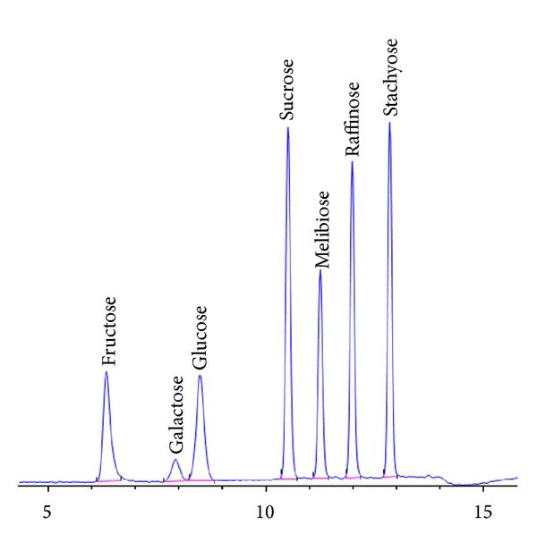
Fig6_Liscouski_NotesOnInstDataSys20.png (544 × 537 pixels, file size: 79 KB, MIME type: image/png)
Summary
| Description |
Figure 6. This chromatogram shows the separation of sugars in a mixture. In an analog chromatogram, the line would be smooth since it would come from a continuous signal that was being recorded in real-time. Images like this will often show stair-stepping on the peaks, a result of a computer sampling the signal periodically (possibly 20 to 50 times/sec depending on settings), and the resulting image is a connect-the-dots display of the sampled readings. This is a characteristic difference between real-time strip-chart analog recording and digital systems (though not a criticism of this particular chromatogram). |
|---|---|
| Source |
Liscouski, J. (2020). "Notes on Instrument Data Systems". |
| Date |
2020 |
| Author |
Liscouski, J. |
| Permission (Reusing this file) |
|
| Other versions |
Licensing
|
|
This work is licensed under the Creative Commons Attribution 4.0 License. |
File history
Click on a date/time to view the file as it appeared at that time.
| Date/Time | Thumbnail | Dimensions | User | Comment | |
|---|---|---|---|---|---|
| current | 20:13, 13 February 2021 | | 544 × 537 (79 KB) | Shawndouglas (talk | contribs) |
You cannot overwrite this file.
File usage
The following page uses this file:


