File:Fig7 Zakutayev SciData2018 5.jpg
Original file (926 × 594 pixels, file size: 127 KB, MIME type: image/jpeg)
Summary
| Description |
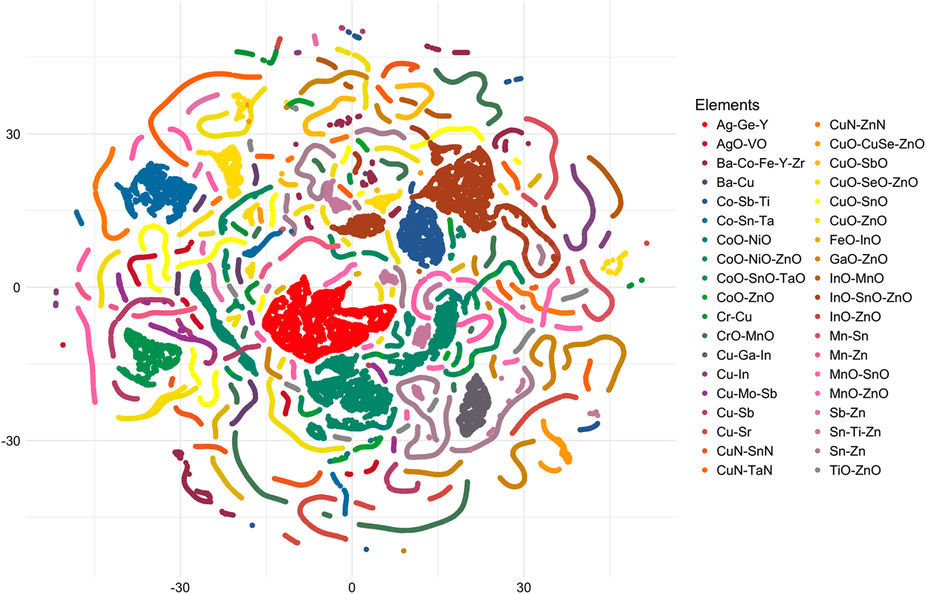
Figure 7. Visualization of most common compositions in the database (those with greater than 440 individual measurements) using the t-SNE dimensionality reduction algorithm. This visualization shows binary compounds as lines of points and ternary compounds as clouds of points. Using this technique, the complexities of the compositional space can be interactively visualized and explored in a single map. |
|---|---|
| Source |
Zakutayev, A.; Wunder, N.; Schwarting, M.; Perkins, J.D.; White, R.; Munch, K.; Tumas, W.; Phillips, C. (2018). "An open experimental database for exploring inorganic materials". Scientific Data 5: 180053. doi:10.1038/sdata.2018.53. |
| Date |
2018 |
| Author |
Zakutayev, A.; Wunder, N.; Schwarting, M.; Perkins, J.D.; White, R.; Munch, K.; Tumas, W.; Phillips, C. |
| Permission (Reusing this file) |
|
| Other versions |
Licensing
|
|
This work is licensed under the Creative Commons Attribution 4.0 License. |
File history
Click on a date/time to view the file as it appeared at that time.
| Date/Time | Thumbnail | Dimensions | User | Comment | |
|---|---|---|---|---|---|
| current | 23:21, 9 April 2018 | | 926 × 594 (127 KB) | Shawndouglas (talk | contribs) |
You cannot overwrite this file.
File usage
The following page uses this file:


