File:Fig8 Trellet JOfIntegBioinfo2018 15-2.jpg
Original file (1,949 × 1,411 pixels, file size: 322 KB, MIME type: image/jpeg)
Summary
| Description |
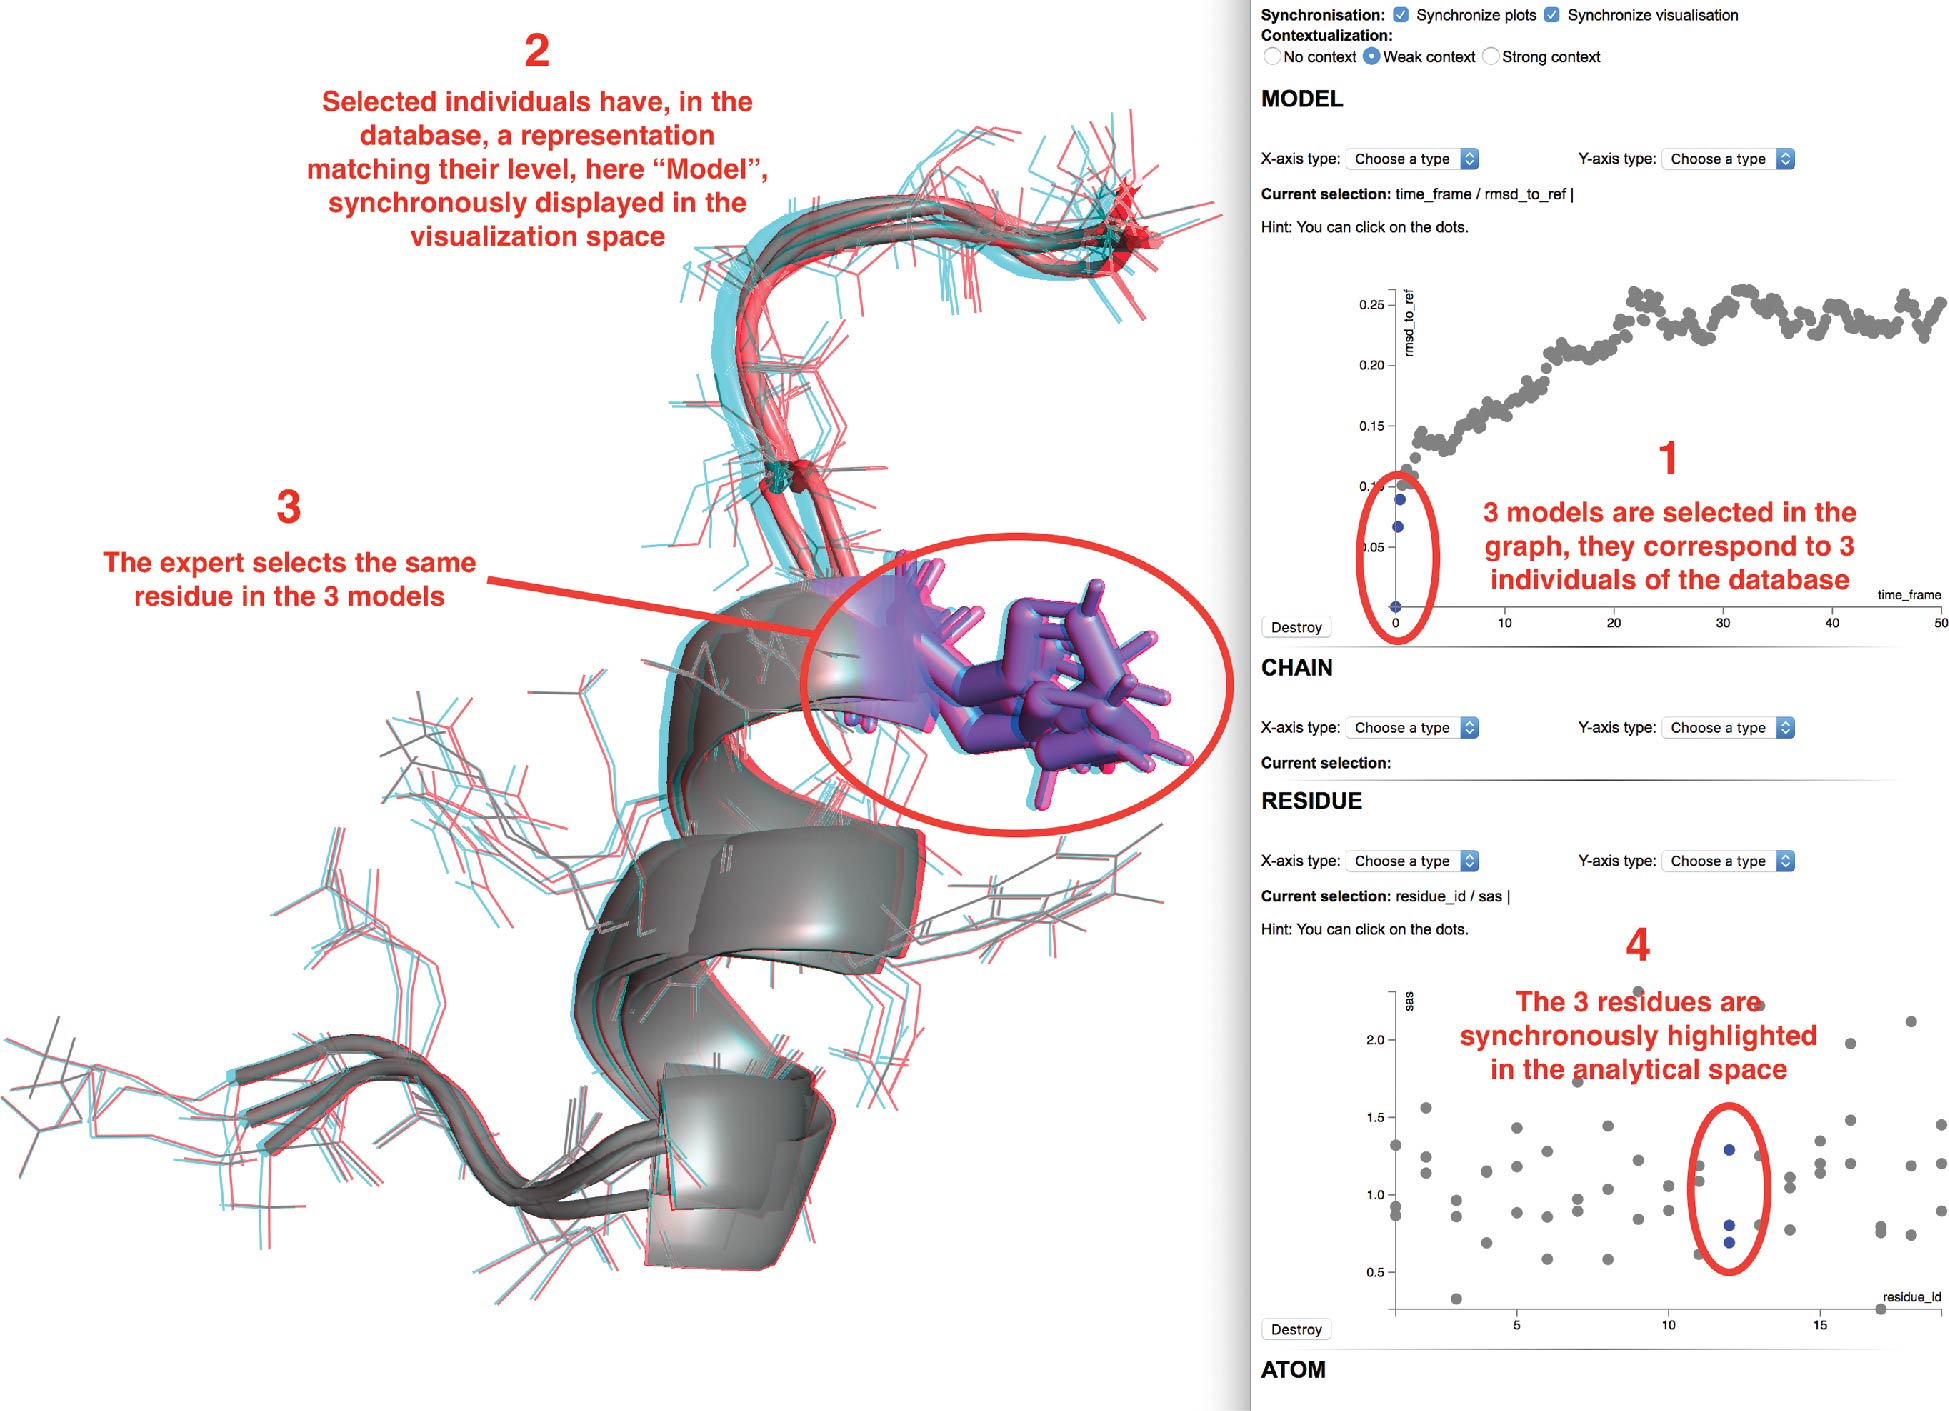
Figure 8. On the right, analytical space where interactive plotting are added upon user actions in the visualization space or through the available menus. On the left, visualization space, each object is displayed synchronously with the selected individuals of the analytical space. |
|---|---|
| Source |
Trellet, M.; Férey, N.; Flotyński, J.; Baaden, M.; Bourdot, P. (2019). "Semantics for an integrative and immersive pipeline combining visualization and analysis of molecular data". Journal of Integrative Bioinformatics 5 (1): 9. doi:10.3390/ijns5010009. |
| Date |
2018 |
| Author |
Trellet, M.; Férey, N.; Flotyński, J.; Baaden, M.; Bourdot, P. |
| Permission (Reusing this file) |
Creative Commons Attribution-NonCommercial-NoDerivatives 4.0 International |
| Other versions |
Licensing
|
|
This work is licensed under the Creative Commons Attribution-NonCommercial-NoDerivatives 4.0 International License. |
File history
Click on a date/time to view the file as it appeared at that time.
| Date/Time | Thumbnail | Dimensions | User | Comment | |
|---|---|---|---|---|---|
| current | 03:43, 6 March 2019 | | 1,949 × 1,411 (322 KB) | Shawndouglas (talk | contribs) |
You cannot overwrite this file.
File usage
The following page uses this file:


