Difference between revisions of "File:Fig3 Musio EnviroAdv2022 7.jpg"
Shawndouglas (talk | contribs) |
Shawndouglas (talk | contribs) (Shawndouglas uploaded File:Fig3 Musio EnviroAdv2022 7.jpg) |
||
| (2 intermediate revisions by the same user not shown) | |||
| Line 1: | Line 1: | ||
==Summary== | |||
{{Information | |||
|Description='''Fig. 3''' <sup>1</sup>H NMR spectral regions [0.6–2.55 ppm; 5.03–5.54 ppm] of aqueous extracts of leaves ('''a.''') and stems ('''b.''') collected from the control plant (Ctrl), vigorous plant (LE_V; ST_V), and weak plant (LE_W; ST_W), respectively. The yellow rectangles delimit the broad signals (0.88, 1.29, 2.23, 5.31 ppm) observed predominantly in the aqueous extracts of leaves from vigorous plants (Fig. 3a, Ctrl vs LE_V vs LE_W) and not in the aqueous extracts of stems (Fig. 3b, Ctrl vs ST_V vs ST_W); the green rectangle highlights the ethanol signal (1.20 ppm) predominantly visible in the leaves ('''a.''') (For interpretation of the references to color in this figure legend, the reader is referred to the web version of this article.). | |||
|Source={{cite journal |title=A spectroscopic study to assess heavy metals absorption by a combined hemp-spirulina system from contaminated soil |journal=Environmental Advances |author=Musio, B.; Ahmed, E.M.F.M.H.; Antonicelli, M.; Chiapperini, D.; Dursi, O.; Grieco, F.; Latronico, M.; Mastrorilli, P.; Ragone, R.; Settanni, R.; Triggiani, M.; Gallo, V. |volume=7 |at=100144 |year=2022 |doi=10.1016/j.envadv.2021.100144}} | |||
|Author=Cicaloni, V.; Salvini, L.; Vitalini, S.; Garzoli, S. | |||
|Date=2022 | |||
|Permission=[https://creativecommons.org/licenses/by-nc-nd/4.0/ Creative Commons Attribution-NonCommercial-NoDerivatives 4.0 International] | |||
}} | |||
== Licensing == | == Licensing == | ||
{{cc-by-nc-nd-4.0}} | {{cc-by-nc-nd-4.0}} | ||
Latest revision as of 22:32, 26 December 2023
Summary
| Description |
Fig. 3 1H NMR spectral regions [0.6–2.55 ppm; 5.03–5.54 ppm] of aqueous extracts of leaves (a.) and stems (b.) collected from the control plant (Ctrl), vigorous plant (LE_V; ST_V), and weak plant (LE_W; ST_W), respectively. The yellow rectangles delimit the broad signals (0.88, 1.29, 2.23, 5.31 ppm) observed predominantly in the aqueous extracts of leaves from vigorous plants (Fig. 3a, Ctrl vs LE_V vs LE_W) and not in the aqueous extracts of stems (Fig. 3b, Ctrl vs ST_V vs ST_W); the green rectangle highlights the ethanol signal (1.20 ppm) predominantly visible in the leaves (a.) (For interpretation of the references to color in this figure legend, the reader is referred to the web version of this article.). |
|---|---|
| Source |
Musio, B.; Ahmed, E.M.F.M.H.; Antonicelli, M.; Chiapperini, D.; Dursi, O.; Grieco, F.; Latronico, M.; Mastrorilli, P.; Ragone, R.; Settanni, R.; Triggiani, M.; Gallo, V. (2022). "A spectroscopic study to assess heavy metals absorption by a combined hemp-spirulina system from contaminated soil". Environmental Advances 7: 100144. doi:10.1016/j.envadv.2021.100144. |
| Date |
2022 |
| Author |
Cicaloni, V.; Salvini, L.; Vitalini, S.; Garzoli, S. |
| Permission (Reusing this file) |
Creative Commons Attribution-NonCommercial-NoDerivatives 4.0 International |
| Other versions |
Licensing
|
|
This work is licensed under the Creative Commons Attribution-NonCommercial-NoDerivatives 4.0 International License. |
File history
Click on a date/time to view the file as it appeared at that time.
| Date/Time | Thumbnail | Dimensions | User | Comment | |
|---|---|---|---|---|---|
| current | 22:32, 26 December 2023 | 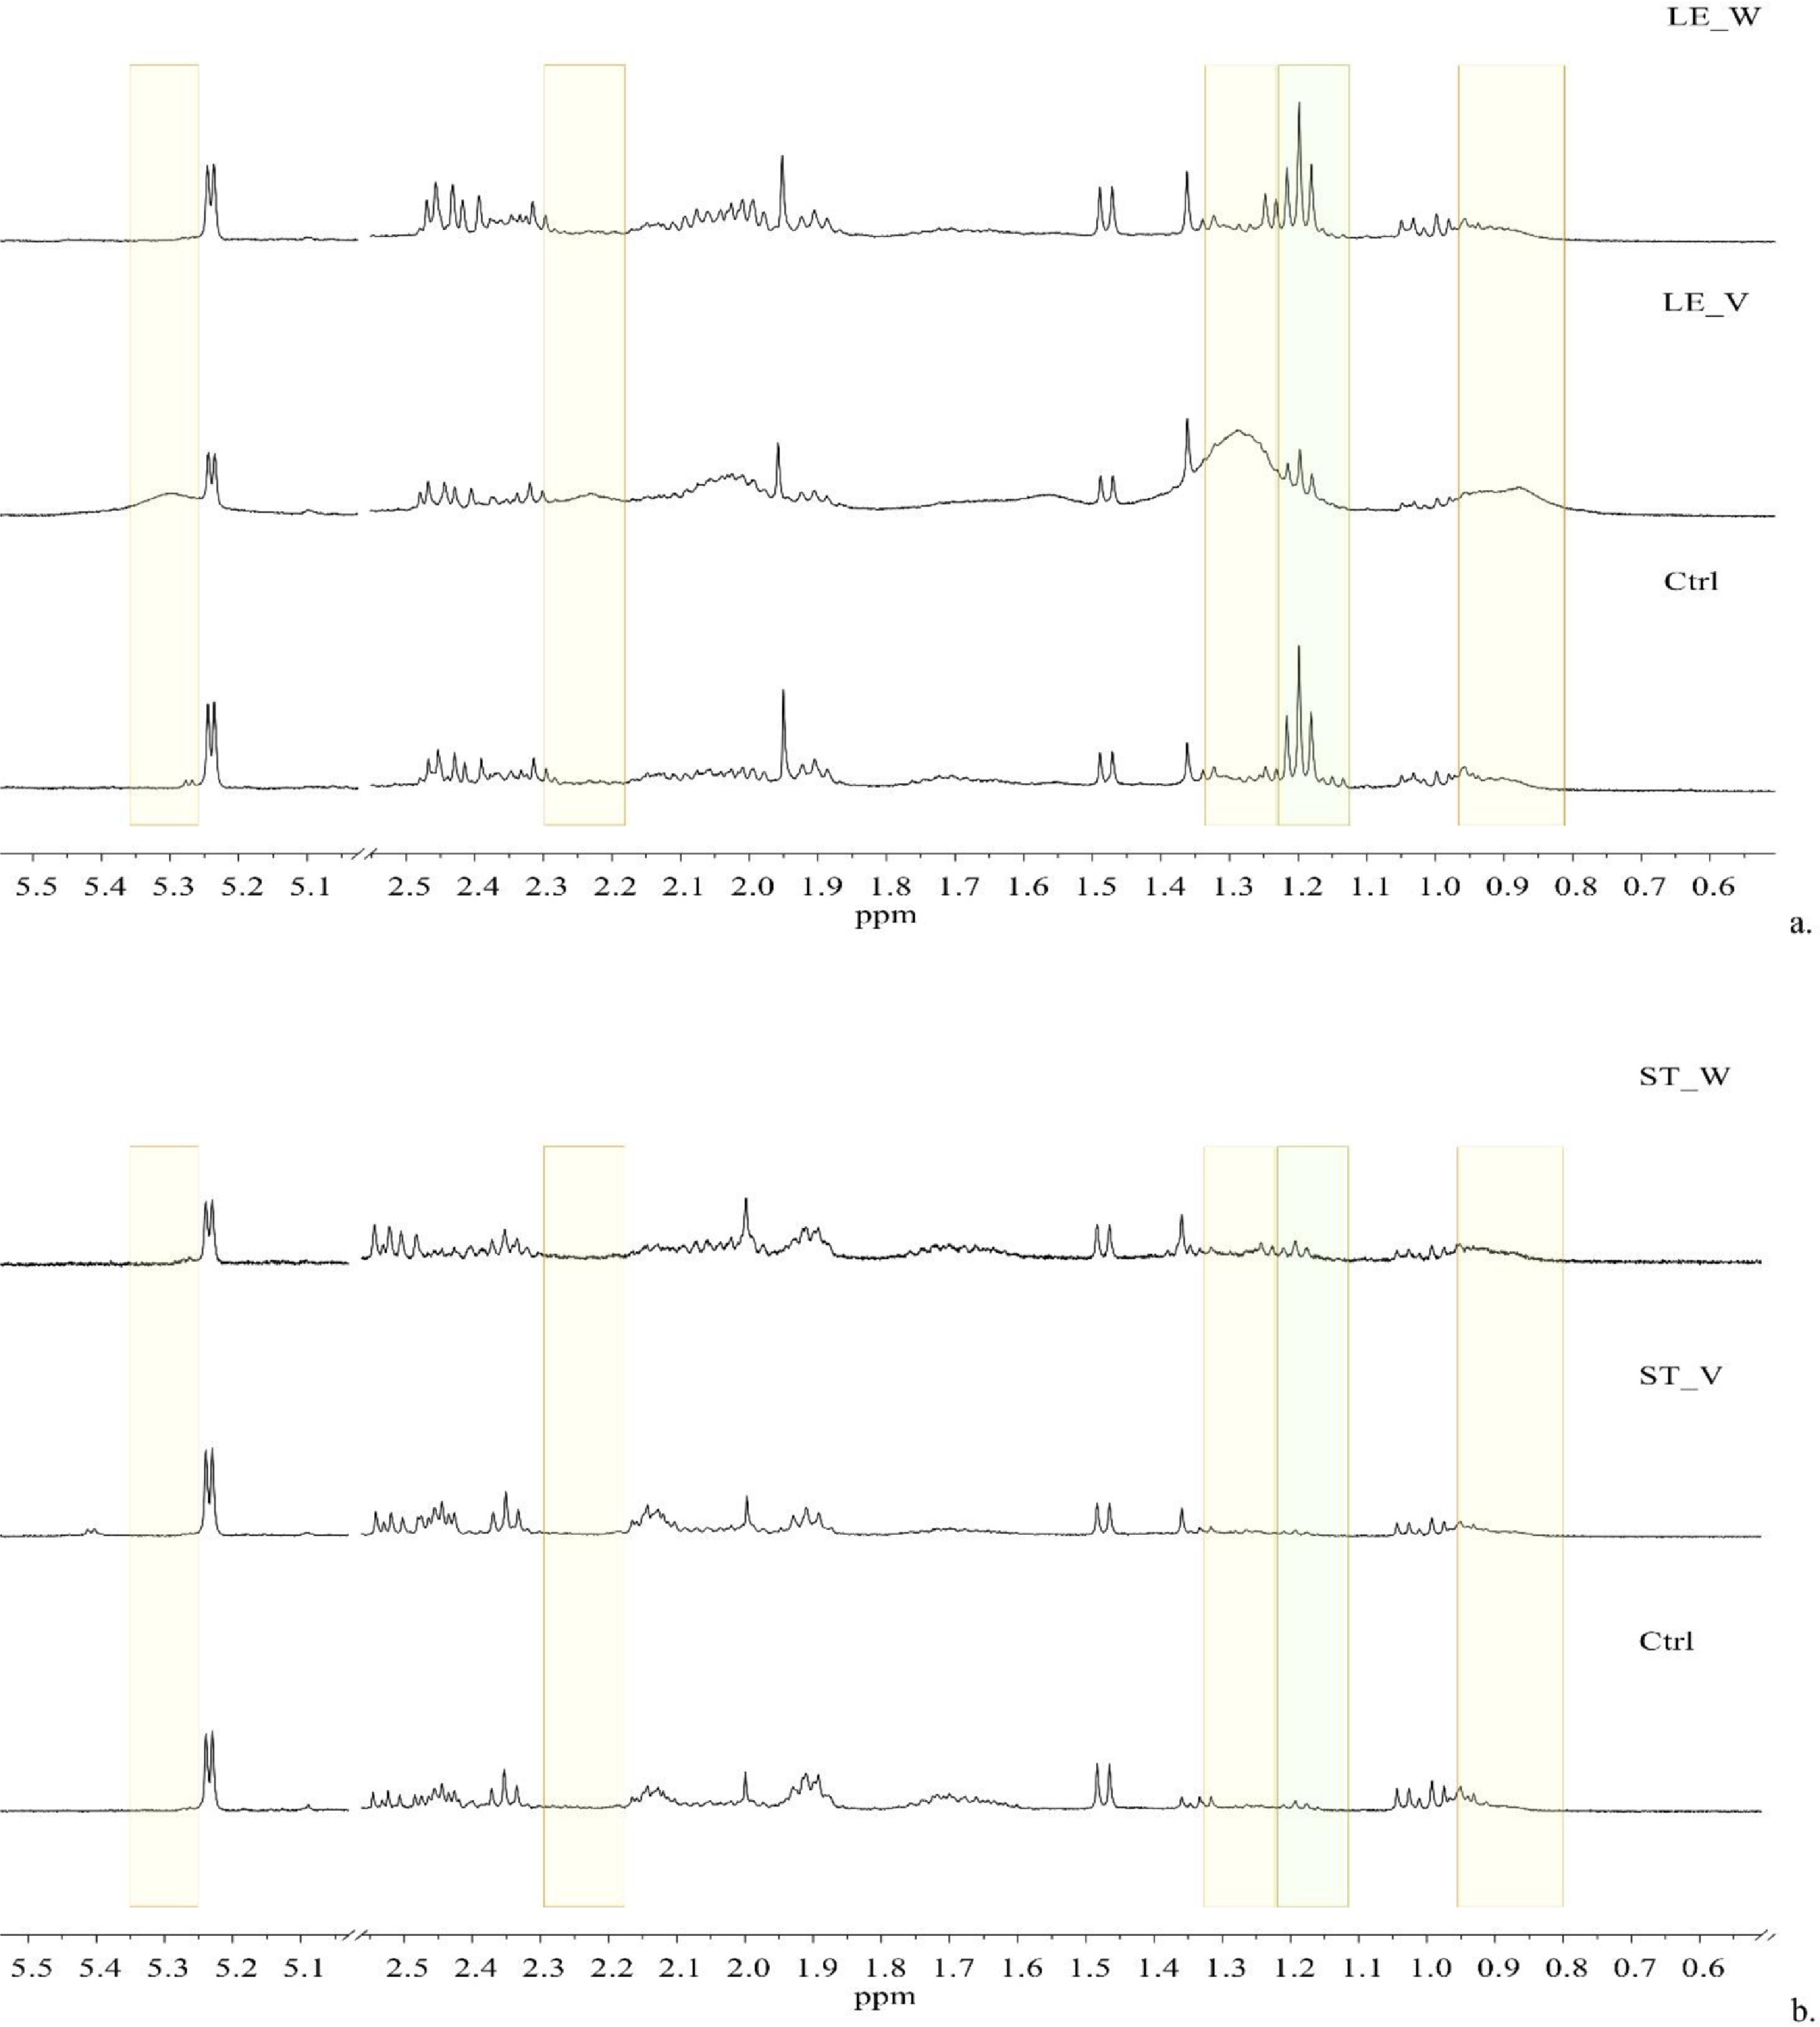 | 2,917 × 3,249 (532 KB) | Shawndouglas (talk | contribs) |
You cannot overwrite this file.
File usage
The following page uses this file:


